Effect of hypertension on the
resting-state functional connectivity in
patients with Alzheimer’s disease
Sang Joon Son
Department of Medicine
The Graduate School, Yonsei University
Effect of hypertension on the
resting-state functional connectivity in
patients with Alzheimer’s disease
Directed by Professor Byoung Hoon Oh
The Doctoral Dissertation
submitted to the Department of Medicine,
the Graduate School of Yonsei University
in partial fulfillment of the requirements for the degree
of Doctor of Philosophy
Sang Joon Son
This certifies that the Doctoral
Dissertation of Sang Joon Son is
approved.
---
Thesis Supervisor : Byoung Hoon Oh
---
Thesis Committee Member#1 : Dong Goo Kim
---
Thesis Committee Member#2 : Se Joo Kim
---
Thesis Committee Member#3 : Eosu Kim
---
Thesis Committee Member#4 : Kang Soo Lee
The Graduate School
Yonsei University
ACKNOWLEDGEMENTS
I am grateful to my thesis supervisor Prof. Byoung Hoon Oh for all of his
mentoring and support throughout my time. I would also like to express
deep appreciation to my advisors Profs. Dong Goo Kim, Se Joo Kim,
Eosu Kim, and Kang Soo Lee for their invaluable guidance,
encouragement, and support throughout the entire thesis writing process.
I wish to give a most special thank to Prof. Jeonghun Ku as well as other
colleagues for all their valuable advice and help. I am particularly
thankful to Prof. Chang Hyung Hong as well as other faculty member for
their consistent support and advice. And finally I would like to thank to
my wife, son, parents, grandmother, and sister for their unconditional
love and support.
I am really proud of my own work, but success is never final. Learning
is not attained by chance; it must be sought for with ardor and attended to
with diligence. Now, I stand on the starting line again.
<TABLE OF CONTENTS>
ABSTRACT ··· 1
I. INTRODUCTION ··· 3
II. MATERIALS AND METHODS ··· 4
1. Subjects ··· 4
2. Clinical evaluation ··· 5
3. Data acquisition ··· 5
4. Data analysis ··· 6
III. RESULTS ··· 7
1. Demographic characteristics··· 7
2. PCC connectivity: within group analyses ··· 8
3. PCC connectivity: between group analyses ··· 9
4. GM atrophy and resting-state connectivity alteration after GM
atrophy correction ··· 10
IV. DISCUSSION ··· 12
V. CONCLUSION ··· 15
REFERENCES ··· 17
LIST OF FIGURES
Figure 1. Intragroup maps of the resting-state connectivity based
on the seed of the PCC in A) AD patients without HTN group,
and B) AD patients with HTN group. ··· 9
Figure 2. Gray matter atrophy analysis through voxel-based
morphometry (VBM) in AD patients with HTN compared to AD
patients without HTN ··· 11
Figure 3. Location of regions demonstrating decreased A) left
subgenual anterior cingulate cortex and increased B) left inferior
parietal cortex resting-state connectivity to the PCC in AD
patients with HTN ··· 12
LIST OF TABLES
Table 1. Demographic and clinical characteristics ··· 8
Table 2. Main regions with significantly altered connectivity to
the PCC in AD with HTN ··· 10
1
ABSTRACT
Effect of hypertension on the resting-state functional connectivity
in patients with Alzheimer’s disease
Sang Joon Son
Department of Medicine
The Graduate School, Yonsei University
(Directed by Professor Byoung Hoon Oh)
Background: Although hypertension (HTN) is well known to be a risk factor for Alzheimer’s disease (AD), the effects of HTN on brain function in AD patients are not well understood. We investigated alterations in resting-state functional connectivity according to the presence of HTN in AD patients by using a method of correlation analysis based on a seed region in the posterior cingulate cortex (PCC). We also determined whether differences in resting-state connectivity were associated with gray matter (GM) atrophy.
Methods: Thirty-seven AD patients (18 with HTN group and 19 with non-HTN) underwent the resting-state functional magnetic resonance imaging. We obtained the posterior cingulate cortex (PCC) maps by a temporal correlation method, to identify alterations in the functional connectivity of the PCC in HTN group relative to non-HTN group. A temporal correlation method was used to build PCC connectivity maps. Voxel-based morphometry analysis was also applied to adjust the confounding effect of GM atrophy.
Results: We detected a decreased connectivity to the PCC in the regions of subgenual anterior cingulated cortex (ACC) in HTN group relative to non-HTN group. However,
2
we observed a pattern of increased connectivity between the PCC and the left inferior parietal cortex (IPC) in HTN group. After correction for GM atrophy, all detected regions still remained significant.
Conclusion: The decreased subgenual ACC and increased left IPC connectivity to the PCC seen in AD patients with HTN suggests the possibility that HTN impairs resting-state functional connectivity of the AD brain, inducing a compensational process outside the impaired networks. This finding may account for an additional contribution of HTN to the pathophysiology of AD.
---
Key words : Alzheimer’s disease, hypertension, resting-state functional
MRI, functional connectivity
3
Effect of hypertension on the resting-state functional connectivity
in patients with Alzheimer’s disease
Sang Joon Son
Department of Medicine
The Graduate School, Yonsei University
(Directed by Professor Byoung Hoon Oh)
I. INTRODUCTION
Although hypertension (HTN) is well known to be a risk factor for vascular dementia,1-2 recent findings have highlighted the role of HTN in the pathogenesis of Alzheimer’s disease (AD).3-4 The most common explanation is that HTN may increase the risk of AD possibly through small vessel disease, ischemia, oxidative stress, and inflammation.2,4 However, the effects of HTN on the brain structure and function, and especially alterations in the resting-state functional connectivity, in AD patients are currently not well understood.
Resting-state functional magnetic resonance imaging (fMRI) assessment has focused primarily on a characteristic set of brain regions, including the posterior cingulate cortex (PCC)/precuneus, lateral temporal and parietal cortex, and the hippocampus and medial prefrontal cortex (MPFC), which is deactivated during a broad range of cognitive tasks and is believed to support a default mode activity of the human brain (i.e., default mode network, DMN).5 In several resting-state fMRI studies of AD patients, dissociation of the resting-state functional connectivity associated with the PCC were reported.6-8 It is believed that the PCC serves a critical role in resting-state functional connectivity,6 and decreased PCC activity in AD patients reflects decreased connectivity with other DMN structures, such as the hippocampus, the MPFC and the precuneus,
4
which are the regions targeted by AD pathology.9-10 These AD-associated changes suggest a potential role for resting-state fMRI as a noninvasive tool to detect biomarkers of AD.6-8
On the basis of the above studies, we hypothesized that the resting-state functional connectivity might be correlated with the presence of HTN in AD patients. Therefore, we investigated alterations in resting-state functional connectivity according to the presence of HTN in AD patients by using a method of correlation analysis based on a seed region in the PCC. We also determined whether differences in resting-state connectivity were associated with gray matter (GM) atrophy by conducting a voxel-based morphometry (VBM) analysis.
II. MATERIALS AND METHOD
1. Subjects
We retrospectively analyzed the data for patients who visited the Dementia Clinic at Severance hospital, Seoul, South Korea, from January 2010 through December 2011. Thirty-seven subjects (18 HTN group and 19 non-HTN group subjects) met the Diagnostic and Statistical Manual of Mental Disorders, 4th Edition (DSM-IV) criteria for dementia of the Alzheimer’s type,11 and the National Institute of Neurological and Communicative Disorders and Stroke/AD and Related Disorders Association (NINCDS-ADRDA) diagnostic criteria for probable AD.12 All subjects were right-handed. AD patients were diagnosed by at least two veteran geropsychiatric doctors. None of the subjects presented with any of the following exclusion criteria: (1) a history of significant hearing or visual impairment that would render participation in the interview difficult; (2) neurological disorders (e.g., territorial infarction,
5
intracranial hemorrhage, brain tumor, and hydrocephalus); (3) psychiatric disorders (e.g., schizophrenia, major depressive disorder, bipolar disorder, or mental retardation,); (4) history of use of psychotropic medications or psychoactive substances other than alcohol; (5) physical illnesses or disorders that could interfere with the clinical study, such as cardiac diseases, respiratory illnesses, uncontrolled diabetes, malignancy, hepatic diseases and renal diseases; or (6) severe white matter changes thought to confound the diagnosis of AD and cause the heterogeneity of the sample.13-14 None of the patients with AD was currently receiving treatment with cholinesterase inhibitors or had ever taken any of these medications. This study was approved by the participating center’s institutional Review Boards.
2. Clinical evaluation
The presence of HTN was defined when a participant had been diagnosed by their physician or had been taking antihypertensive medication(s). All subjects with HTN included in the study were taking antihypertensive medication over at least 1 year and their HTN was considered to be controlled. The patients’ Clinical Dementia Rating (CDR)15 scores ranged between 0.5 and 2, and their Mini Mental State Examination (MMSE)16 scores fell within the range of 12–27 (Table 1).
3. Data acquisition
Functional MR images were acquired on a 3.0-T scanner (Intera Achieva; Philips Medical Systems, Best, The Netherlands) with an eight-channel sensitivity encoding (SENSE) head coil. The data were collected using the following gradient echo echo planar imaging (EPI) sequence: repetition time (TR) = 2000 ms; echo time (TE) = 30 ms; flip angle = 90°; field of view (FOV)
6
= 22 cm; 80 x 80 matrix with 2.75 x 2.75 x 3 mm spatial resolution, 31 axial slices and slice thickness = 3 mm. High-resolution anatomical datasets were obtained using a 3D T1-turbo field echo (TFE) (TR = 9.9 ms; TE = 4.6 ms; flip angle = 8°; FOV = 22 cm; 224 x 224 matrix with 0.98 x 0.98 x 1 mm spatial resolution; 220 coronal slices and slice thickness = 1 mm).
4. Data analysis
Functional MRI data were preprocessed using the Analysis of Functional Neuroimage (AFNI) program.17 The first three time points in all time series data were discarded to allow for T1 equilibrium effects. The rest of the data were obtained with slice-timing correction, motion correction of all slices within a volume, and mean-based intensity normalization in order to convert the data from arbitrary intensity units to units of percent signal modulation. Further processing included spatial smoothing (Gaussian filter with 8 mm full-width at half-maximum). Spatial normalization was performed to transform into Talairach space using the Montreal Neurological Institute (MNI) N27 template provided in AFNI (bilinear interpolation, spatial resolution: 2 mm × 2 mm × 2 mm).
The assessment of cortical networks was performed using a seed-based correlation approach. Preprocessed fMRI data were temporally band-pass filtered (0.01–0.08 Hz) to reduce low frequency fluctuation in the BOLD signal for functional connectivity analysis.18 Reference time series were extracted by averaging time series from voxels in the subject-specific regions of interests (ROIs) within the bilateral PCC. Functional connectivity maps of the region were obtained by correlation analysis conducted using reference time series and time series from the whole brain using a voxel-wise approach. Correlation coefficients were then converted to Z-values, using Fisher’s Z transformation. Z scores represent the functional connectivity strength at the seed region.
7
Group-level differences in connectivity maps were also analyzed using the t-test and the threshold for the interpretation was a two-tailed threshold of p<0.001, with false discovery rate correction.
Structural data were analyzed with FMRIB's software library (FSL)-VBM, which allows for voxel-based morphometry style analysis.19-20 Structural images were brain-extracted using BET21 and tissue-type segmentation was conducted using FAST4.22 The resulting grey-matter partial volume images were then aligned to MNI 152 standard space using the affine registration tool FLIRT,23-24 followed by nonlinear registration using FNIRT,25-26 which uses a B-spline representation of the registration warp field.27 The resulting images were averaged to create a study-specific template, to which the native gray matter images were then non-linearly re-registered. The registered partial volume images were then modulated (to correct for local expansion or contraction) by dividing by the Jacobian of the warp field. The modulated segmented images were then smoothed with an isotropic Gaussian kernel with a sigma of 3 mm. Finally, the group analysis results were obtained and a statistical significance threshold of p<0.025 with false discovery rate correction was defined. In the voxel-based analysis, between group differences in resting-state fMRI were tested by entering the GM maps as voxel-wise covariates using biological parametric mapping.28 Significance was set at p<0.001 with false discovery rate correction. The effect of GM atrophy on between group differences in mean connectivity values was tested by repeating the analysis after controlling for total GM volume.
III. RESULTS
8
Demographic and clinical characteristics are described in Table 1. No significant differences in gender, CDR, age, educational level, or MMSE score were noted between the HTN and non-HTN groups (categorical variables: Chi-square test; continuous variables: Mann-Whitney U test; statistical significance: p<0.05).
Table 1. Demographic and clinical characteristicsa
AD w/o HTN (n=18)
AD w/ HTN (n=19) Median age in years (min, max) 74.0 (66.0, 84.0) 72.0 (66.0, 85.0) Male/female (n) 10/8 8/11
Median education in years (min,
max) 6.0 (0, 16.0) 6.0 (0, 16.0) Median MMSE (min, max) 21.5 (12.0, 26.0) 20.0 (12.0, 27.0) CDR (n)
0.5 5 5
1 11 11
2 2 3
a
No significant between-group differences in gender, age and educational level, MMSE score, and CDR (statistical significance: P<0.05) Abbreviations: AD w/ HTN=Alzheimer’s disease with hypertension; AD w/o HTN=Alzheimer’s disease without hypertension; MMSE=Mini Mental Status Examination; CDR=Clinical Dementia Rating.
2. PCC connectivity: within group analyses
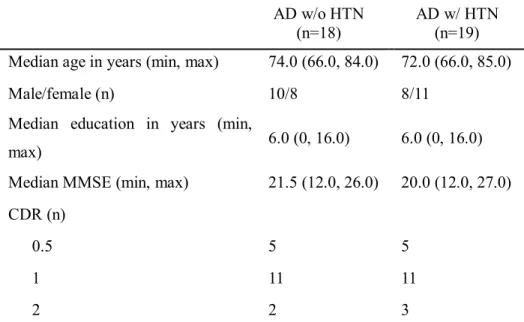
Within-group analysis revealed regions with connectivity to the PCC in each of groups, and these two intragroup maps appeared to be similar (Fig. 1). Primary
9
regions involved in the network in both groups include the ventral MPFC, the bilateral hippocampus, the inferior temporal cortex, the cuneus/precuneus, and the inferior parietal cortex. These regions coincide with regions underlying the known default mode network.29-31
Figure 1. Intragroup maps of the resting-state connectivity based on the seed of the PCC in A) AD patients without HTN group, and B) AD patients with HTN group. Regions of significant connectivity were imposed using the Montreal Neurological Institute template (p<0.001, false discovery rate correction). Orange indicates increased connectivity to the PCC and blue color indicates decreased connectivity to the PCC. Abbreviations: PCC=posterior cingulate cortex; AD=Alzheimer’s disease; HTN= hypertension.
3. PCC connectivity: between group analyses
Between-group analyses revealed the between-group difference in PCC connectivity. Decreased connectivity to the PCC was detected in the regions of left subgenual anterior cingulate cortex (ACC) in HTN group relative to
10
non-HTN group. Conversely, a pattern of increased connectivity to the PCC in the left inferior parietal cortex (IPC) was observed in HTN group (Table 2).
Table 2. Main regions with significantly altered connectivity to the PCC in AD
patients with HTNa
Between-group comparison and region Talairach coordinate Peak t score No. of cluster voxels x y z Increased connectivity to PCC
Left inferior parietal cortex -57 -49 34 4.52 496
Decreased connectivity to PCC Left subgenual anterior cingulate
cortex -3 17 -2 4.16 152
a
Thresholds were set at p<0.001, false discovery rate corrected. Abbreviations: PCC=posterior cingulated cortex; AD=Alzheimer’s disease; HTN= hypertension.
4. GM atrophy and resting-state connectivity alteration after GM atrophy correction
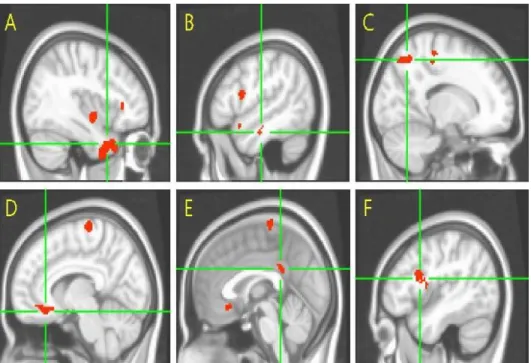
Compared to AD patients without HTN, AD patients with HTN were found to have broader areas showing significant GM loss in the PCC/precuneus, the ACC, the left inferior frontal gyrus, the right temporal pole, and the left middle temporal gyrus (Fig. 2).
11
Figure 2. Gray matter atrophy analysis through voxel-based morphometry (VBM) in AD patients with HTN compared to AD patients without HTN. VBM results are shown at the statistical threshold of p<0.025 with false discovery rate correction. Results are shown using the Montreal Neurological Institute template in neurological convention. A) right temporal pole; B) left middle temporal gyrus; C) precuneus; D) right anterior cingulate cortex; E) left posterior cingulate cortex; F) left inferior frontal gyrus. Abbreviations: AD=Alzheimer’s disease; HTN= hypertension.
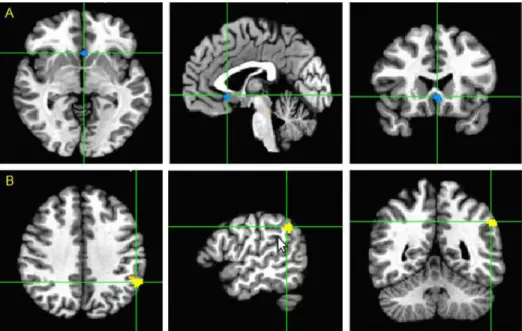
We adjusted GM atrophy for the between-group analysis of resting-state network comparisons and found that the regions showing significant differences before the adjustment still remained significant in AD patients with HTN versus without HTN, suggesting that alterations in resting-state network were not solely accounted for the more brain atrophy seen in HTN group (Fig. 3).
12
Figure 3. Location of regions demonstrating decreased A) left subgenual anterior cingulate cortex and increased B) left inferior parietal cortex resting-state connectivity to the PCC in AD patients with HTN. Clusters with significant differences are overlapped in the Montreal Neurological Institute template (p<0.001, false discovery rate correction) and adjusted by gray matter atrophy in AD patients with HTN compared to AD patienst without HTN. Abbreviations: PCC=posterior cingulated cortex; AD=Alzheimer’s disease; HTN= hypertension.
IV. DISCUSSION
We investigated the functional connectivity of the major anterior and posterior brain resting-state networks in AD patients according to the presence of HTN. Our findings show that: (1) HTN in AD patients was associated with opposing connectivity effects in the subgenual cingulate cortex (decreased) and the inferior parietal cortex (enhanced) for resting-state PCC connectivity; and (2) GM volume loss might accentuate resting-state fMRI differences between AD patients with HTN and those without HTN, but could not solely account for the differences. With these results together with previous literature on the topic, we
13
propose a framework where the limited functional resource of anterior resting-state connectivity in AD patients with HTN may be paralleled by increased—albeit finally ineffective—posterior resting-state connectivity, which might have an adaptive role in that it limited the clinical consequences of tissue damage associated with pathological contribution of HTN.
The ACC is known as an important hub between health-relevant psychological constructs and cardiovascular-autonomic reactions to stress.32 Especially, the subgenual ACC is the the most active region associated with emotional valence status (i.e. pleasant and unpleasant mood).33-34 Related evidence indicates that the subgenual ACC is activated when healthy volunteers rest passively,5 a behavioral state during which individuals focus frequently on autobiographical thoughts and memories.35 Conversely, accumulating evidence suggests that the subgenual ACC is deactivated during the performance of demanding cognitive tasks that require an external focus of attention.36-37 Such deactivation may be an indicator of the degree to which affective processing is inhibited.29 In reference to this, some studies have suggested that subgenual ACC dysfunction might disturb stress-related neuroendocrine responses and reward-related mesolimbic dopamine function.38 Disordered interactions between the subgenual ACC and other brain structures could potentially result in the impairment of affective processing that was seen in mood disorders.39-40 In light of this evidence, our findings suggest that AD patients with HTN may lack the ability to cope with emotional stress and may be more susceptible to affective symptoms. Indeed, HTN has been reported as a contributable risk factor for depression among the elderly, irrespective of other medical conditions.41 However, relatively little is known about the relationship between affective symptom and HTN in AD patients. Therefore, additional studies that explore the differences in symptomatic phenotypes among AD patients, according to the presence of HTN in AD, will be necessary to confirm our finding and their implications.
14
On the other hand, we found that, while deficits in connectivity might be extended with dementia progression, enhanced connectivity to the PCC occurred simultaneously in AD patients with HTN, mainly in the left IPC. The enhanced spatiotemporal interaction with the PCC may be thought of as compensation for the disrupted resting-state connectivity with the anterior portion. In several AD studies, increased PCC functional connections were also reported to be primarily in the left frontal-parietal cortices.6-7,42 These regions, supposed to be impaired later, may be recruited preferentially to compensate for damage incurred earlier. Another interpretation is that the brain, which demonstrates plasticity after damage to the original neural networks, is remolding. Previous investigators reported that earlier changes predominantly lateralized to the left hemisphere in AD patients, both metabolically and structurally.6,43-46 We might therefore predict that the connectivity for remolding began from the left side and extended dynamically along with the advance of AD.
Another intriguing finding of this study is that functional connectivity altrations in AD patients with HTN are independent of GM atrophy in these patients. Volumetric MRI studies have shown that elevated systolic pressures in untreated hypertensive and cognitively normal elderly patients correlated with decreased gray matter volumes in the superior frontal, anterior cingulate, and temporal gyri associated with memory and executive function.47 Consistently, we found that greater atrophy occurred in the temporal, frontal and cingulate lobes in AD patients with HTN relative to those without HTN. These results suggest that HTN may alter brain structure that are critical for higher cognitive functions and which are targeted by AD pathology.42,48 Moreover, we found decreased subgenaul cingulate and increased parietal connectivities to the PCC in AD patients with HTN. This result remained significant even after controlling for GM volumes. Together with the results of previous PET49 and fMRI50 studies that showed excessive hypometabolism or a more altered functional
15
connectivity relative to atrophy, our result suggests that there exists a certain mechanism underlying a genuine functional perturbation above neuronal loss. Previous work has found that reginal cerabral blood flow was decreaed in cognitively normal elderly subjects with HTN in the ACC, the left PCC, the left IPC, the left hippocampus, and the left superior temporal cortices.4 This means that HTN is associated with the functional vulnerability for the development of AD.
The main limitation of this study is the relatively small. Further studies with higher number of participants are needed to covariate additional factors which potentially confound the relationship between the brain function and HTN, such as other vascular risk factors. Future studies should also investigate the cognitive phenotypes and other biomarkers (i.e. CSF biomarkers) that are associated with resting-state fMRI alterations in AD patients. Another limitation of this study pertains to the discordant exposure to hypertensive medications in AD patients with HTN. We cannot completely eliminate the potential confounding factors of medication exposure and differential effects across classes of the drugs. However, it might be a relative strength of our study that all of subjects were anti-dementia medication-naive. There were also limitations in methods. When we extracted frequency fluctuations with a band of 0.01–0.08 Hz, the cardiac and respiratory fluctuation effects were not completely eliminated from the low frequency fluctuations.18,51-52 These aliasing effects might have reduced the specificity of the connectivity effects. However, it must be noted that previous results from Cordes et al.53 indicated that physiological noise sources, such as respiratory or cardiac pulsations, had little effect on the cross-correlation coefficients in defining functional connectivity maps.
16
Despite a few limitations, this study shows that the presence of HTN in AD patients is associated with alterations in resting-state functional brain networks, which is not solely explained by more GM atrophy seen in the HTN group. The decreased subgenual ACC and increased left IPC connectivity to the PCC that we observed in hypertensive AD patients may suggest the possibility of symptomatic differences according to the presence of HTN and the existence of compensational process for the disrupted connectivity in the presence of structural injury.
17 REFERNCES
1. Wolf-Maier K, Cooper RS, Kramer H, Banegas JR, Giampaoli S, Joffres MR, et al. Hypertension treatment and control in five European countries, Canada, and the United States. Hypertension 2004;43:10-7.
2. Nagai M, Hoshide S, Kario K. Hypertension and dementia. Am J Hypertens 2010;23:116-24.
3. Kivipelto M, Helkala EL, Laakso MP, Hanninen T, Hallikainen M, Alhainen K, et al. Midlife vascular risk factors and Alzheimer's disease in later life: longitudinal, population based study. BMJ 2001;322:1447-51. 4. Dai W, Lopez OL, Carmichael OT, Becker JT, Kuller LH, Gach HM.
Abnormal regional cerebral blood flow in cognitively normal elderly subjects with hypertension. Stroke 2008;39:349-54.
5. Raichle ME, MacLeod AM, Snyder AZ, Powers WJ, Gusnard DA, Shulman GL. A default mode of brain function. Proc Natl Acad Sci USA 2001;98:676-82.
6. Zhang HY, Wang SJ, Liu B, Ma ZL, Yang M, Zhang ZJ, et al. Resting brain connectivity: changes during the progress of Alzheimer disease. Radiology 2010;256:598-606.
7. Zhang HY, Wang SJ, Xing J, Liu B, Ma ZL, Yang M, et al. Detection of PCC functional connectivity characteristics in resting-state fMRI in mild Alzheimer's disease. Behav Brain Res 2009;197:103-8.
8. Greicius MD, Srivastava G, Reiss AL, Menon V. Default-mode network activity distinguishes Alzheimer's disease from healthy aging: evidence from functional MRI. Proc Natl Acad Sci USA 2004;101:4637-42.
9. Aupee AM, Desgranges B, Eustache F, Lalevee C, de la Sayette V, Viader F, et al. Voxel-based mapping of brain hypometabolism in permanent amnesia with PET. Neuroimage 2001;13:1164-73.
18
10. Della-Maggiore V, Sekuler AB, Grady CL, Bennett PJ, Sekuler R, McIntosh AR. Corticolimbic interactions associated with performance on a short-term memory task are modified by age. J Neurosci 2000;20:8410-6. 11. American Psychiatric Association. Diagnostic and Statistical Manual of
Mental Disorders. Fourth ed, Text Revision. Washinton, D.C.: American Psychiatric Association; 2000.
12. McKhann G, Drachman D, Folstein M, Katzman R, Price D, Stadlan EM. Clinical diagnosis of Alzheimer's disease: report of the NINCDS-ADRDA Work Group under the auspices of Department of Health and Human Services Task Force on Alzheimer's Disease. Neurology 1984;34:939-44. 13. Dubois B, Feldman HH, Jacova C, Dekosky ST, Barberger-Gateau P,
Cummings J, et al. Research criteria for the diagnosis of Alzheimer's disease: revising the NINCDS-ADRDA criteria. Lancet Neurol 2007;6:734-46.
14. Fazekas F, Chawluk JB, Alavi A, Hurtig HI, Zimmerman RA. MR signal abnormalities at 1.5 T in Alzheimer's dementia and normal aging. AJR Am J Roentgenol 1987;149:351-6.
15. Morris JC. The Clinical Dementia Rating (CDR): current version and scoring rules. Neurology 1993;43:2412-4.
16. Kang Y, Na DL, Hanhn S. A validity study on the Korean mini-mental state examination (K-MMSE) in dementia patients. J Korean Neurol Assoc 1997;15:300-7.
17. Cox RW. AFNI: software for analysis and visualization of functional magnetic resonance neuroimages. Comput Biomed Res 1996;29:162-73. 18. Biswal B, Yetkin FZ, Haughton VM, Hyde JS. Functional connectivity in
the motor cortex of resting human brain using echo-planar MRI. Magn Reson Med 1995;34:537-41.
19. Ashburner J, Friston KJ. Voxel-based morphometry--the methods. Neuroimage 2000;11:805-21.
19
20. Good CD, Johnsrude IS, Ashburner J, Henson RN, Friston KJ, Frackowiak RS. A voxel-based morphometric study of ageing in 465 normal adult human brains. Neuroimage 2001;14:21-36.
21. Smith SM, Jenkinson M, Woolrich MW, Beckmann CF, Behrens TE, Johansen-Berg H, et al. Advances in functional and structural MR image analysis and implementation as FSL. Neuroimage 2004;23 Suppl 1:S208-19.
22. Zhang Y, Brady M, Smith S. Segmentation of brain MR images through a hidden Markov random field model and the expectation-maximization algorithm. IEEE Trans Med Imaging 2001;20:45-57.
23. Jenkinson M, Smith S. A global optimisation method for robust affine registration of brain images. Med Image Anal 2001;5:143-56.
24. Jenkinson M, Bannister P, Brady M, Smith S. Improved optimization for the robust and accurate linear registration and motion correction of brain images. Neuroimage 2002;17:825-41.
25. Andersson JLR, Jenkinson M, Smith S. Non-linear optimisation. FMRIB technical report TR07JA2 2007.
26. Andersson JLR, Jenkinson M, Smith S. Non-linear registration, aka Spatial normalisation. FMRIB technical report TR07JA2 2007.
27. Rueckert D, Sonoda LI, Hayes C, Hill DL, Leach MO, Hawkes DJ. Nonrigid registration using free-form deformations: application to breast MR images. IEEE Trans Med Imaging 1999;18:712-21.
28. Casanova R, Srikanth R, Baer A, Laurienti PJ, Burdette JH, Hayasaka S, et al. Biological parametric mapping: A statistical toolbox for multimodality brain image analysis. Neuroimage 2007;34:137-43.
29. Gusnard DA, Raichle ME. Searching for a baseline: functional imaging and the resting human brain. Nat Rev Neurosci 2001;2:685-94.
30. Greicius MD, Krasnow B, Reiss AL, Menon V. Functional connectivity in the resting brain: a network analysis of the default mode hypothesis. Proc
20 Natl Acad Sci USA 2003;100:253-8.
31. De Luca M, Beckmann CF, De Stefano N, Matthews PM, Smith SM. fMRI resting state networks define distinct modes of long-distance interactions in the human brain. Neuroimage 2006;29:1359-67.
32. Ryan JP, Sheu LK, Gianaros PJ. Resting state functional connectivity within the cingulate cortex jointly predicts agreeableness and stressor-evoked cardiovascular reactivity. Neuroimage 2011;55:363-70. 33. Maddock RJ, Garrett AS, Buonocore MH. Posterior cingulate cortex
activation by emotional words: fMRI evidence from a valence decision task. Hum Brain Mapp 2003;18:30-41.
34. Greicius MD, Flores BH, Menon V, Glover GH, Solvason HB, Kenna H, et al. Resting-state functional connectivity in major depression: abnormally increased contributions from subgenual cingulate cortex and thalamus. Biol Psychiatry 2007;62:429-37.
35. Mazoyer B, Zago L, Mellet E, Bricogne S, Etard O, Houde O, et al. Cortical networks for working memory and executive functions sustain the conscious resting state in man. Brain Res Bull 2001;54:287-98.
36. Kennedy DP, Redcay E, Courchesne E. Failing to deactivate: resting functional abnormalities in autism. Proc Natl Acad Sci USA 2006;103:8275-80.
37. Marsh R, Zhu H, Schultz RT, Quackenbush G, Royal J, Skudlarski P, et al. A developmental fMRI study of self-regulatory control. Hum Brain Mapp 2006;27:848-63.
38. Drevets WC, Ongur D, Price JL. Neuroimaging abnormalities in the subgenual prefrontal cortex: implications for the pathophysiology of familial mood disorders. Mol Psychiatry 1998;3:220-6, 190-1.
39. Elliott R, Sahakian BJ, Herrod JJ, Robbins TW, Paykel ES. Abnormal response to negative feedback in unipolar depression: evidence for a diagnosis specific impairment. J Neurol Neurosurg Psychiatry
21 1997;63:74-82.
40. Damasio AR. Neuropsychology. Towards a neuropathology of emotion and mood. Nature 1997;386:769-70.
41. Zimmerman JA, Mast BT, Miles T, Markides KS. Vascular risk and depression in the Hispanic Established Population for the Epidemiologic Study of the Elderly (EPESE). Int J Geriatr Psychiatry 2009;24:409-16. 42. Braak H, Braak E. Neuropathological stageing of Alzheimer-related
changes. Acta Neuropathol 1991;82:239-59.
43. Thompson PM, Hayashi KM, de Zubicaray G, Janke AL, Rose SE, Semple J, et al. Dynamics of gray matter loss in Alzheimer's disease. J Neurosci 2003;23:994-1005.
44. Janke AL, de Zubicaray G, Rose SE, Griffin M, Chalk JB, Galloway GJ. 4D deformation modeling of cortical disease progression in Alzheimer's dementia. Magn Reson Med 2001;46:661-6.
45. Johnson KA, Jones K, Holman BL, Becker JA, Spiers PA, Satlin A, et al. Preclinical prediction of Alzheimer's disease using SPECT. Neurology 1998;50:1563-71.
46. Loewenstein DA, Barker WW, Chang JY, Apicella A, Yoshii F, Kothari P, et al. Predominant left hemisphere metabolic dysfunction in dementia. Arch Neurol 1989;46:146-52.
47. Gianaros PJ, Greer PJ, Ryan CM, Jennings JR. Higher blood pressure predicts lower regional grey matter volume: Consequences on short-term information processing. Neuroimage 2006;31:754-65.
48. Glodzik L, Mosconi L, Tsui W, de Santi S, Zinkowski R, Pirraglia E, et al. Alzheimer's disease markers, hypertension, and gray matter damage in normal elderly. Neurobiol Aging 2012;33:1215-27.
49. Chetelat G, Desgranges B, Landeau B, Mezenge F, Poline JB, de la Sayette V, et al. Direct voxel-based comparison between grey matter hypometabolism and atrophy in Alzheimer's disease. Brain
22 2008;131:60-71.
50. Gili T, Cercignani M, Serra L, Perri R, Giove F, Maraviglia B, et al. Regional brain atrophy and functional disconnection across Alzheimer's disease evolution. J Neurol Neurosurg Psychiatry 2011;82:58-66.
51. Cordes D, Haughton VM, Arfanakis K, Wendt GJ, Turski PA, Moritz CH, et al. Mapping functionally related regions of brain with functional connectivity MR imaging. AJNR Am J Neuroradiol 2000;21:1636-44. 52. Thirion B, Dodel S, Poline JB. Detection of signal synchronizations in
resting-state fMRI datasets. Neuroimage 2006;29:321-7.
53. Cordes D, Haughton VM, Arfanakis K, Carew JD, Turski PA, Moritz CH, et al. Frequencies contributing to functional connectivity in the cerebral cortex in "resting-state" data. AJNR Am J Neuroradiol 2001;22:1326-33.
23 ABSTRACT (IN KOREAN)
알츠하이머병 환자에서 고혈압이
휴지기 뇌 기능적 연결성에 미치는 영향
<지도교수 : 오 병 훈>
연세대학교 대학원 의학과
손 상 준
서론 : 고혈압은 알츠하이머병 발병의 위험 요인으로 알려져 있으나, 병태생리학적 역할은 여전히 밝혀지지 않은 부분이 많다. 본 연구에서는 알츠하이머병 환자에서 뇌 영상학적 생체지표로 알려져 있는 후대상피질을 중심으로 한 휴지기 뇌 기능적 연결 이상이 고혈압 유무에 따라 어떠한 차이를 보이는지 살펴 보았다. 아울러 이러한 뇌 기능적 연결성 차이가 뇌 회백질의 위축 여부에 영향을 받는지도 알아 보았다. 재료 및 방법 : 일 대학병원 치매클리닉에 방문한 알츠하이머병 환자 중 37명이 선별되었으며, 그 중 18명은 고혈압군으로 나머지 19명은 비고혈압군으로 분류되었다. 휴지기 뇌 기능적 연결성은 기능적 뇌 자기공명영상을 이용하여 과제 수행없이 후대상피질을 중심으로 측정하였으며, 뇌회백질 위축 정도를 보정하였다. 한편, 뇌 회백질의 위축 정도는 복셀 기반형태 측정법을 통해 살펴보았다. 결과 : 고혈압이 없는 환자에 비해 고혈압을 동반한 알츠하이머병 환자에서 후대상피질을 중심으로 한 대상회슬하피질과의 기능적 연결성 저하가 관찰된 반면, 좌측 하두정엽과의 기능적 연결성은 증가된 소견을 보이고 있었다. 이러한 뇌 기능적 연결성 차이는 회백질 위축을 보정하여서도 통계적으로 유의미하게 관찰되었다. 결론 : 후대상피질을 중심으로 관찰되는 대상회슬하피질과 기능적24 연결성 저하 및 좌측 하두정엽과 기능적 연결성 증가는 고혈압을 동반한 알츠하이머병 환자에서 고혈압이 없는 환자와의 증상적 차이가 있을 가능성과 더불어 뇌 기능적 연결성 저하에 대한 보상 기전이 일어나고 있을 가능성을 시사한다. --- 핵심되는 말 : 알츠하이머병, 고혈압, 휴지기 기능적 뇌 자기공명영상, 기능적 연결성