D I A B E T E S & M E T A B O L I S M J O U R N A L
This is an Open Access article distributed under the terms of the Creative Commons Attribution Non-Commercial License (http://creativecommons.org/licenses/by-nc/4.0/) which permits unrestricted non-commercial use, distribution, and reproduction in any medium, provided the original work is properly cited.
Insulin Resistance and the Risk of Diabetes and Dysglycemia in Korean General Adult Population
Jong Ha Baek1, Hosu Kim1, Kyong Young Kim1, Jaehoon Jung1,2
1Department of Internal Medicine, Gyeongsang National University Changwon Hospital, Gyeongsang National University School of Medicine, Changwon,
2Institute of Health Science, Gyeongsang National University School of Medicine, Jinju, Korea
Background: Insulin resistance is a major pathogenic hallmark of impaired glucose metabolism. We assessed the accuracy of in- sulin resistance and cut-off values using homeostasis model assessment of insulin resistance (HOMA-IR) to classify type 2 diabe- tes mellitus (T2DM) and dysglycemia according to age and sex.
Methods: In this cross-sectional study, we analyzed 4,291 anti-diabetic drug-naïve adults (≥20 years) from the 6th Korea Nation- al Health and Nutrition Examination Survey in 2015. Metabolic syndrome (MetS) was defined by the modified National Choles- terol Education Program III guideline. Diagnosis of dysglycemia and T2DM were based on fasting glucose and glycosylated he- moglobin levels. The receiver operating characteristic curve and optimal cut-off values of HOMA-IR were assessed to identify T2DM/dysglycemia according to sex and were further analyzed by age.
Results: Sex differences were found in the association of MetS and the different MetS components with T2DM/dysglycemia. The overall optimal cut-off value of HOMA-IR for identifying dysglycemia was 1.6 in both sex. The cut-off values for T2DM were 2.87 in men and 2.36 in women. However, there are differences in diagnostic range of HOMA-IR to distinguish T2DM according to sex and age, and the accuracy of HOMA-IR in identifying T2DM gradually decreased with age especially in women.
Conclusion: Insulin resistance is closely associated with the risk for T2DM/dysglycemia. The accuracy of HOMA-IR levels is characterized by sex- and age-specific differences in identifying T2DM. In addition to insulin resistance index, insulin secretory function, and different MetS components should be considered in the detection of early T2DM, especially in elderly.
Keywords: Diabetes mellitus; Hyperglycemia; Insulin resistance; Risk
Corresponding author: Jaehoon Jung https://orcid.org/0000-0002-5444-1229 Department of Internal Medicine, Gyeongsang National University Changwon Hospital, Gyeongsang National University School of Medicine, 11 Samjeongja-ro, Seongsan-gu, Changwon 51472, Korea
E-mail: [email protected]
INTRODUCTION
A progressive decline in insulin sensitivity plays a crucial role in the pathogenesis of metabolic syndrome (MetS). Impaired β-cell compensation in response to increased insulin resistance is a pathophysiological factor associated with poor glucose tol- erance. In addition, prediabetic state, including impaired fast- ing glucose and/or impaired glucose tolerance (IGT) is a path- ological feature of insulin resistance in insulin-sensitive organs [1].
According to data from the National Health Insurance Ser- vice, about 2.7 million Korean (8.0%) aged 30 years or older
had type 2 diabetes mellitus (T2DM) [2] and the prevalence of diabetes or cardiometabolic disease rises with age and shows sex differences [3]. In addition, ethnic differences exist in the stabilization points of insulin resistance and insulin secretory function for maintenance of normal glucose tolerance (NGT) [4]. Asian population is highly vulnerable to increased insulin resistance due to decreased β-cell function in NGT conditions [5]. Homeostasis model assessment of insulin resistance (HOMA-IR) has been used widely in epidemiologic studies to measure insulin sensitivity based on fasting plasma glucose (FPG) and insulin concentrations [6]. HOMA-IR also corre- lates reasonably well with insulin resistance measured by hy- https://doi.org/10.4093/dmj.2017.0106
pISSN 2233-6079 · eISSN 2233-6087
perinsulinemic-euglycemic clamp, which is regarded as the gold standard but is not readily applicable because of complex process [7]. Meanwhile, in addition to sex- and age-specific differences in HOMA-IR range [8], the HOMA-IR value in- creases significantly from 50 years of age in women without di- abetes [9,10].
According to data from the 2013 to 2014 Korea National Health and Nutrition Examination Survey (KNHANES), 29.3% of Korean patients still did not aware of their diabetic condition. The index of insulin resistance represents a screen- ing tool for the identification of subjects who were at increased risk for diabetes or dysglycemia. A previous study showed that increase in HOMA-IR was positively associated with higher risk of T2DM in Japanese population with impaired insulin se- cretion [11]. In a prospective cohort studies, HOMA-IR cut-off values of 1.4 and 2.0 were used to distinguish dysglycemia and T2DM from NGT in Chinese population [12]. Meanwhile, the HOMA-IR cut-off values of 1.85 for women and 2.17 for men were used to distinguish T2DM among Iranian adults [13].
Previous Asian studies also demonstrated that distribution and cut-off values of HOMA-IR for insulin resistance were 2.2 to 2.5 in Korean population [14] and 2.5 in Japanese population [9]. However, age- and sex-specific metabolic risk factors were not considered in previous studies. Insulin secretory function also should be considered in the classification of T2DM or dys- glycemia in the general population. We therefore, conducted this study to evaluate the distribution and optimal HOMA-IR cut-off values according to sex and age to facilitate the detec- tion of insulin resistance associated with early T2DM or dys- glycemia in Korean adult population.
METHODS
Study design and population
This study was performed using data from the 6th KNHANES conducted in 2015 involving 7,380 individuals aged 1 and above. KNHANES is a population-based cross-sectional sur- vey designed to assess the health-related behavior, health con- dition, and nutritional state of Koreans [15]. Each survey was conducted by specially trained interviewers and the data was collected by direct and standardized physical examinations in specially equipped mobile examination centers. A representa- tive sample of non-institutionalized civilians was obtained from all geographic regions in the country; subjects were se- lected using a rolling cluster sampling design, stratified into
multiple stages, and prorated by age. Participants provided written informed consent to participate at the time of enroll- ment, and we received the data in anonymized form. The KNHANES VI study was conducted according to the princi- ples expressed in the Declaration of Helsinki and Ethnics ap- proval was obtained from the Korea Centers for Disease Con- trol and Prevention Institutional Review Board Ethnic com- mittee with informed consents (No. 2015-01-02-6C) [16].
We restricted the analyses to adults aged 20 years and above (n=5,855). Subjects with missing data for variables associated with MetS components (waist circumference [WC], blood pressure [BP], lipid profiles, and fasting glucose levels) or fast- ing insulin and glycosylated hemoglobin (HbA1c) levels were excluded (n=1,081). In addition, those who responded with
‘yes’ to the questionnaire of “Have you ever been diagnosed with diabetes by a doctor and taken anti-diabetic drugs be- fore?” were excluded to rule out the effect of anti-diabetic drugs on insulin sensitivity (n=502). The anti-diabetic drug- naïve adult population was divided into three categories (NGT, prediabetes, and T2DM) according to the American Diabetes Association diagnostic criteria for diabetes [17]. Only FPG and HbA1c levels were used for diagnostic cut-off values because 75-g oral glucose tolerance test was not performed in this sur- vey. Those with FPG less than 100 mg/dL and HbA1c less than 5.7% were defined to have NGT, and those with FPG of 126 mg/dL or more, or HbA1c of 6.5% or greater were diagnosed with T2DM. Meanwhile, those with FPG levels ranging be- tween 100 and 125 mg/dL or HbA1c levels between 5.7% and 6.4% were identified as prediabetes. In our study, dysglycemia referred to pre-diabetes and T2DM, and non-T2DM referred to NGT and pre-diabetes. Plasma glucose and insulin levels under fasting condition were measured to evaluate insulin sen- sitivity using HOMA-IR and insulin secretory function using homeostasis model assessment of β-cell function (HOMA-β) model [6]. HOMA-IR levels were divided into tertiles accord- ing to glycemic state (NGT subgroup, dysglycemia subgroup) to assess the severity of insulin resistance in which the higher tertiles suggested greater insulin resistance.
General characteristics and anthropometric factors
We included sociodemographic characteristics including age, sex, education (high school or less, college or higher), smoking status (current smoker or not), exercise, and alcohol intake. We defined regular aerobic exercise if it involved moderate inten- sity for 2.5 hours or more or intense exercise for 1.25 hours or
more per week. Heavy alcohol intake was defined by the amount and frequency of alcohol for a month. Binge drinking was defined as five or more alcoholic drinks in males or four or more alcoholic drinks in females at least once daily in the past month. WC was measured to the nearest 0.1 cm on a horizon- tal plane at the mid-point between the lower costal margin and the iliac crest. Weight (kg) was divided by height squared (m2) to calculate the body mass index. BP was measured three times at 5-minute intervals using a standard mercury sphygmoma- nometer with the subject seated. The mean of the second and third measurements was calculated and used in the analysis.
Blood samples were collected after the subject had fasted for more than 8 hours. The fasting serum levels of glucose, triglyc- eride (TG), and high density lipoprotein cholesterol (HDL-C) were measured enzymatically using a Hitachi Automatic Ana- lyzer 7600 (Hitachi, Tokyo, Japan).
Definition of MetS
MetS was defined according to the modified criteria proposed by the Adult Treatment Program III of the National Cholester- ol Education Program (NCEP ATP III) [18]. Each MetS com- ponent was evaluated using the following criteria: (1) WC ≥90 cm in men or ≥85 cm in women (for Korean population) [19];
(2) TG ≥150 mg/dL or statin treatment; (3) HDL-C cholester- ol <40 mg/dL in men or <50 mg/dL in women or statin treat- ment; and (4) elevated BP (systolic blood pressure [SBP] ≥130 mm Hg and/or diastolic blood pressure ≥85 mm Hg) or treat- ment with anti-hypertensive medications. Meanwhile, hyper- glycemia was not considered because subjects with a history of anti-diabetic drug regimen were excluded from the study de- sign.
Statistical analysis
Normally distributed data were presented as mean±standard deviation, and non-normally distributed date were presented as median (interquartile range [IQR]). Student t-test or one- way analysis of covariance was used for continuous variables and chi-square tests were used for categorical variables to as- sess the baseline characteristics. The Mann-Whitney U test, Kruskall-Wallis test, and the Jonckheere-Terpstra test (for trend analyses) were used for comparison of quantitative vari- ables. Multivariate logistic regression analyses was conducted to identify the risk of T2DM/dysglycemia associated with the MetS components after adjusting for age and lifestyle compo- nents (regular aerobic exercise, education state, smoking sta-
tus, heavy drinker) and HOMA-IR cut-off value.
To determine the optimal HOMA-IR cut-offs to distinguish dysglycemia from NGT, and T2DM from non-DM according to age group, the point with the maximum Youden index (sensitivity+specificity–1; YI) on the receiver-operating char- acteristic operation (ROC) curve was obtained, and we select- ed the maximum value as the cut-off values. The effect of age groups on total area under the ROC curve (AUROC) differ- ences was analyzed using the independent ROC comparison analysis according to sex. In addition, to assess for linearity of AUROCs by age groups, we conducted the restricted maxi- mum likelihood estimation using area under the curve (AUC) values and standard errors. The total AUROC with 95% confi- dence interval (CI), sensitivity, and specificity of HOMA-IR values were calculated to distinguish dysglycemia from T2DM, respectively. The statistical analyses was performed using SPSS version 21.0 (IBM Co., Armonk, NY, USA), Stata version 14.1 (StatCorp., College Station, TX, USA), and MedCalc version 17.5.5 (MedCalc Software bvba, Ostend, Belgium). All statisti- cal tests were two-tailed, and the significance level was set at P<0.05.
RESULTS
General characteristics
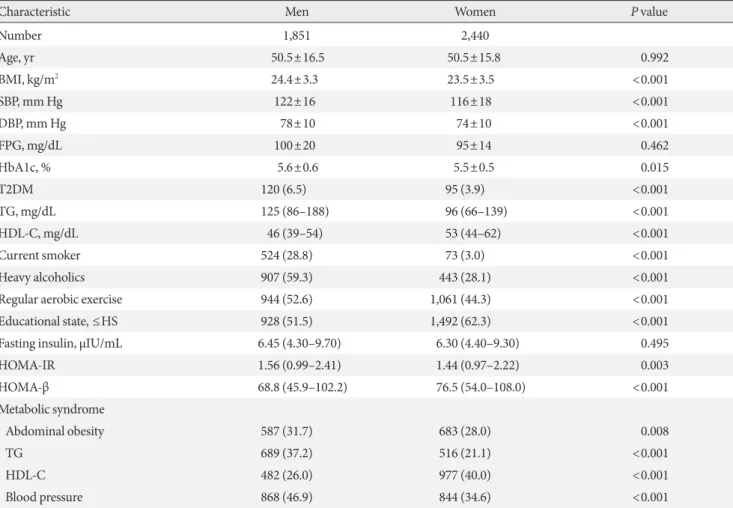
The baseline characteristics of study population are shown in Table 1 and subjects were subdivided into NGT, pre-diabetes, and T2DM according to sex (Supplementary Table 1). In the total study population of 4,291 adults mean age was compara- ble between sex (mean, 50.5 years). Among MetS components, central obesity (31.7% vs. 28.0%), hyperTG (37.2% vs. 21.1%), and higher BP (46.9% vs. 34.6%) were dominant factors in men whereas low HDL-C (26.0% vs. 40.0%) were dominant in women (all P<0.01). Current smoking and binge drinking were more dominant in men whereas less regular exercise and lower educational status were observed in women (all P<
0.001). The overall prevalence of T2DM was 6.5% (n=120) in men and 3.9% (n=95) in women (P<0.001). The overall prev- alence of dysglycemia was 50.7% (n=938) in men and 40.3%
(n=984) in women (P<0.001). Meanwhile, sex differences in prevalence were seen across different age groups. The preva- lence of T2DM was higher in men than in women under 60 years although it was not significant in older ages as the preva- lence in women increased gradually with age. The prevalence of dysglycemia was higher in men aged 40 to 60 years com-
pared with women (Fig. 1). The overall median HOMA-IR levels were 1.56 in men and 1.44 in women (P=0.003). How- ever, the median HOMA-IR values according to glucose toler- ance state (NGT, prediabetes, and T2DM) and age were not significantly different between males and females (data not shown). T2DM was prevalent in older population with having more MetS components, and higher insulin resistance and lower insulin secretory function compared to those with NGT or pre-diabetes, as expected in both men and women (Supple- mentary Table 1).
The risk of T2DM/dysglycemia associated with MetS components according to sex
To evaluate the effects of MetS components on the risk of T2DM/dysglycemia according to sex, multivariate logistic re- Table 1. Baseline clinical and demographic characteristics
Characteristic Men Women P value
Number 1,851 2,440
Age, yr 50.5±16.5 50.5±15.8 0.992
BMI, kg/m2 24.4±3.3 23.5±3.5 <0.001
SBP, mm Hg 122±16 116±18 <0.001
DBP, mm Hg 78±10 74±10 <0.001
FPG, mg/dL 100±20 95±14 0.462
HbA1c, % 5.6±0.6 5.5±0.5 0.015
T2DM 120 (6.5) 95 (3.9) <0.001
TG, mg/dL 125 (86–188) 96 (66–139) <0.001
HDL-C, mg/dL 46 (39–54) 53 (44–62) <0.001
Current smoker 524 (28.8) 73 (3.0) <0.001
Heavy alcoholics 907 (59.3) 443 (28.1) <0.001
Regular aerobic exercise 944 (52.6) 1,061 (44.3) <0.001
Educational state, ≤HS 928 (51.5) 1,492 (62.3) <0.001
Fasting insulin, µIU/mL 6.45 (4.30–9.70) 6.30 (4.40–9.30) 0.495
HOMA-IR 1.56 (0.99–2.41) 1.44 (0.97–2.22) 0.003
HOMA-β 68.8 (45.9–102.2) 76.5 (54.0–108.0) <0.001
Metabolic syndrome
Abdominal obesity 587 (31.7) 683 (28.0) 0.008
TG 689 (37.2) 516 (21.1) <0.001
HDL-C 482 (26.0) 977 (40.0) <0.001
Blood pressure 868 (46.9) 844 (34.6) <0.001
Values are presented as mean±standard deviation, number (%), or median (interquartile range).
BMI, body mass index; SBP, systolic blood pressure; DBP, diastolic blood pressure; FPG, fasting plasma glucose; HbA1c, glycosylated hemoglo- bin; T2DM, type 2 diabetes mellitus; TG, triglyceride; HDL-C, high density lipoprotein cholesterol; HS, high school; HOMA-IR, homeostasis model assessment of insulin resistance; HOMA-β, homeostasis model assessment of β-cell function.
Fig. 1. Prevalence of type 2 diabetes mellitus (T2DM) and dys- glycemia in different age groups and sex. aP<0.05, bP<0.01.
80
60
40
20
0
Prevalence (%)
20−30s 40s 50s 60s 70s Age
a b a
b
b
b
T2DM (men) T2DM (women)
Dysglycemia (men) Dysglycemia (women)
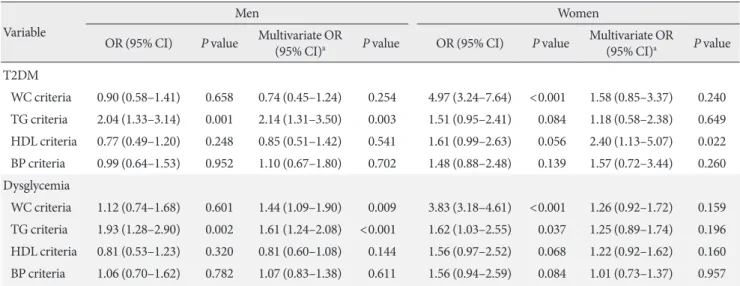
gression analyses was performed adjusting for HOMA-IR cut- off values (YI) and lifestyle factors (regular aerobic exercise, education state, smoking state, and heavy drinking). In men, the presence of hyperTG was associated with increased risk for T2DM (odds ratio [OR], 2.14; 95% CI, 1.31 to 3.50) and dys- glycemia (OR, 1.61; 95% CI, 1.24 to 2.08) after adjusting for confounding factors. Meanwhile, the presence of hypo-HDL cholesterol (OR, 2.40; 95% CI, 1.13 to 5.07) was associated with the risk for T2DM in women (Table 2).
AUROC distribution and cut-off values of HOMA-IR by age, sex, and dysglycemic state
The AUROC curve of HOMA-IR values was used to distin- guish dysglycemia from NGT, and T2DM from non-DM as shown in Table 3. The overall AUROC for T2DM was 0.774
(95% CI, 0.730 to 0.818) for men and 0.837 (95% CI, 0.794 to 0.879) for women, and those for dysglycemia were 0.685 (95%
CI, 0.671 to 0.719) for men and 0.728 (95% CI, 0.708 to 0.748) for women. The optimal cut-off values for dysglycemia were 1.56 (sensitivity 64.3%, specificity 64.5%), and 1.60 (sensitivity 63.3%, specificity 70.0%) in women, without any differences in accuracy of HOMA-IR values according to age in both sex (Fig. 2). Meanwhile, the cut-off point of 1.6 in both sex was strongly associated with each MetS component after adjusting for age and lifestyle factors (alcohol intake, education state, and exercise) (Table 4).
The optimal cut-off values using maximum YI for T2DM were 2.87 in men (sensitivity 56.7%, specificity 85.4%), and 2.36 in women (sensitivity 72.6%, specificity 79.9%). In subgroups according to age and sex (Table 5), significant differences in Table 2. Multivariate OR (95% CI) of T2DM/dysglycemia according to metabolic syndrome components
Variable
Men Women
OR (95% CI) P value Multivariate OR
(95% CI)a P value OR (95% CI) P value Multivariate OR
(95% CI)a P value T2DM
WC criteria 0.90 (0.58–1.41) 0.658 0.74 (0.45–1.24) 0.254 4.97 (3.24–7.64) <0.001 1.58 (0.85–3.37) 0.240 TG criteria 2.04 (1.33–3.14) 0.001 2.14 (1.31–3.50) 0.003 1.51 (0.95–2.41) 0.084 1.18 (0.58–2.38) 0.649 HDL criteria 0.77 (0.49–1.20) 0.248 0.85 (0.51–1.42) 0.541 1.61 (0.99–2.63) 0.056 2.40 (1.13–5.07) 0.022 BP criteria 0.99 (0.64–1.53) 0.952 1.10 (0.67–1.80) 0.702 1.48 (0.88–2.48) 0.139 1.57 (0.72–3.44) 0.260 Dysglycemia
WC criteria 1.12 (0.74–1.68) 0.601 1.44 (1.09–1.90) 0.009 3.83 (3.18–4.61) <0.001 1.26 (0.92–1.72) 0.159 TG criteria 1.93 (1.28–2.90) 0.002 1.61 (1.24–2.08) <0.001 1.62 (1.03–2.55) 0.037 1.25 (0.89–1.74) 0.196 HDL criteria 0.81 (0.53–1.23) 0.320 0.81 (0.60–1.08) 0.144 1.56 (0.97–2.52) 0.068 1.22 (0.92–1.62) 0.160 BP criteria 1.06 (0.70–1.62) 0.782 1.07 (0.83–1.38) 0.611 1.56 (0.94–2.59) 0.084 1.01 (0.73–1.37) 0.957 OR, odds ratio; CI, confidence interval; T2DM, type 2 diabetes mellitus; WC, waist circumference; TG, triglyceride; HDL, high density lipopro- tein; BP, blood pressure.
aAll values were adjusted for age, homeostasis model assessment of insulin resistance, metabolic syndrome components and lifestyle factors (regular aerobic exercise, education, smoking status, and heavy drinking).
Table 3. Assessment of dysglycemia and T2DM based on AUC and optimal cut-off points for HOMA-IR
Men Women
(95% CI) Cut-offAUC Sensitivity,
% Specificity,
% PPV,
% NPV,
% AUC
(95% CI) Cut-off Sensitivity,
% Specificity,
% PPV,
% NPV,
% Dysglycemia 0.685
(0.671–0.719) 1.56 64.3 64.5 65.0 63.6 0.728
(0.708–0.748) 1.60 63.3 70.0 58.6 73.5
T2DM 0.774
(0.730–0.818) 2.87 56.7 85.4 21.2 96.6 0.837
(0.794–0.879) 2.36 72.6 79.9 12.8 98.6 T2DM, type 2 diabetes mellitus; AUC, area under the curve; HOMA-IR, homeostasis model assessment of insulin resistance; CI, confidence in- terval; PPV, positive predictive value; NPV, negative predictive value.
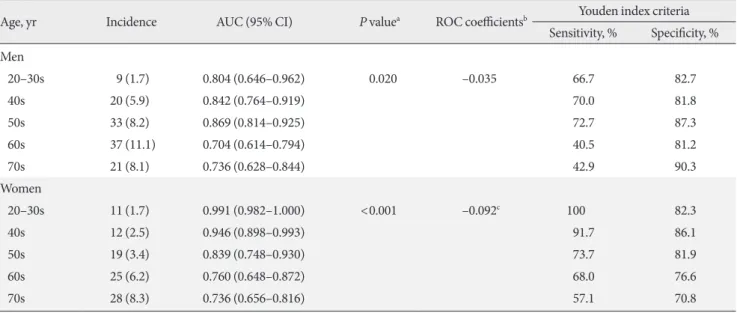
AUROC for T2DM were found across different age groups in both sex, whereas the linear decline with aging was significant only in women (P<0.05). In men in their 60s, the sensitivities
of HOMA-IR cut point for T2DM diagnosis were 40.5% (YI criteria, 2.87) and 43.2% (2.5 criteria), respectively. Among men in their 70s, the sensitivities of HOMA-IR cut point for T2DM were 57.1% (YI index criteria) and 46.4% (2.5 criteria), respectively. When we excluded subjects who were aged 70 years or older, the cut-off value for HOMA-IR was 2.13 (sensi- tivity 85.5%, specificity 69.9%) in men and 2.50 in women (sensitivity 85.7%, specificity 74.4%) (data not shown).
Meanwhile, among subjects with dysglycemic state (n=
1,922), an overall defect in insulin secretory function (HOMA- β) in older subjects aged above 50s was observed only in mid- dle (median [IQR], 60.0 [45.9 to 70.0] vs. 51.4 [41.3 to 62.7], P=0.012) to high tertiles (median [IQR], 101.2 [75.8 to 150.5]
vs. 85.2 [66.6 to 121.0], P=0.003) of HOMA-IR in men, and high tertiles of HOMA-IR in women (median [IQR], 109.5 [80.4 to 146.1] vs. 99.5 [74.6 to 128.1], P=0.045) compared to those at younger ages (Fig. 3).
Fig. 2. Area under the curve (AUC) (95% confidence interval [CI]) for (A) type 2 diabetes mellitus (T2DM) in men, (B) T2DM in women, (C) dysglycemia in men, and (D) dysglycemia in women in different age groups.
1.0
0.5
0
1.0
0.5
0
1.0
0.5
0
1.0
0.5
0
AUC (95% CI)AUC (95% CI) AUC (95% CI)AUC (95% CI)
20−30s 40s 50s 60s 70s
20−30s 40s 50s 60s 70s
20−30s 40s 50s 60s 70s
20−30s 40s 50s 60s 70s Age
Age
Age
Age A
C
B
D
Table 4. Association between metabolic syndrome compo- nents and the cut-off point of HOMA-IR (1.6) for dysglycemia
OR (95% CI)a
Men Women
TG criteria 2.61 (2.09–3.26) 4.03 (3.05–5.33) HDL criteria 2.75 (2.13–3.55) 3.08 (2.46–3.84) BP criteria 2.63 (2.08–3.32) 2.03 (1.56–2.64) WC criteria 7.61 (5.85–9.90) 5.62 (4.31–7.34) HOMA-IR, homeostasis model assessment of insulin resistance; OR, odds ratio; CI, confidence interval; TG, triglyceride; HDL, high den- sity lipoprotein; BP, blood pressure; WC, waist circumference.
aAdjusting for age and lifestyle factors (alcohol intake, education, and exercise).
DISCUSSION
In this large community-based Korean adult population study, differences in MetS expression were found and the different MetS components were independently associated with the risk of T2DM/dysglycemia after adjusting for lifestyle factors and insulin resistance between men and women. The optimal cut- off value of HOMA-IR using maximum YI for dysglycemia was 1.6 in both sex, and this value was independently associat- ed with MetS components. The cut-off values of HOMA-IR for
T2DM were 2.87 in men and 2.36 in women. Meanwhile, the diagnostic ranges of HOMA-IR to discriminate T2DM varied according to sex and age, and the sensitivity of HOMA-IR for T2DM diagnosis progressively decreased with age especially in women. An impaired compensatory insulin secretory function in older subjects with dysglycemic state was predominantly seen under conditions of higher insulin resistance. The find- ings suggest that factors such as age, sex, different MetS com- ponents, and insulin secretory function should be considered to classify people with high-risk T2DM using HOMA-IR cut- Table 5. Sex distribution of HOMA-IR cut-off levels based on sensitivity and specificity for T2DM in different age groups
Age, yr Incidence AUC (95% CI) P valuea ROC coefficientsb Youden index criteria Sensitivity, % Specificity, % Men
20–30s 9 (1.7) 0.804 (0.646–0.962) 0.020 –0.035 66.7 82.7
40s 20 (5.9) 0.842 (0.764–0.919) 70.0 81.8
50s 33 (8.2) 0.869 (0.814–0.925) 72.7 87.3
60s 37 (11.1) 0.704 (0.614–0.794) 40.5 81.2
70s 21 (8.1) 0.736 (0.628–0.844) 42.9 90.3
Women
20–30s 11 (1.7) 0.991 (0.982–1.000) <0.001 –0.092c 100 82.3
40s 12 (2.5) 0.946 (0.898–0.993) 91.7 86.1
50s 19 (3.4) 0.839 (0.748–0.930) 73.7 81.9
60s 25 (6.2) 0.760 (0.648–0.872) 68.0 76.6
70s 28 (8.3) 0.736 (0.656–0.816) 57.1 70.8
Values are presented as number (%).
HOMA-IR, homeostasis model assessment of insulin resistance; T2DM, type 2 diabetes mellitus; AUC, area under the curve; CI, confidence in- terval; ROC, receiver-operating characteristic operation.
aP value for difference of AUC values between age group, bP value for linear trend of AUC values by age group, cP<0.05.
Fig. 3. Comparison of homeostasis model assessment of β-cell function (HOMA-β) according to sex and age group (distin- guished by 50 years) in (A) low tertile of homeostasis model assessment of insulin resistance (HOMA-IR), (B) mid tertile of HOMA-IR, and (C) high tertile of HOMA-IR among those with dysglycemia. White bar, 50 years old or less; gray bar, more than 50 years old. aP<0.05.
60
40
20
0
100 80 60 40 20 0
200 150 100 50 0
HOMA-β HOMA-β HOMA-β
Men Women Men Women Men Women
Low tertile (HOMA-IR) A Mid tertile (HOMA-IR) B High tertile (HOMA-IR) C
a a a
off values, especially in older Koreans.
Sex differences in MetS expression and the association of different MetS components with the risk of T2DM/dysglyce- mia were found. In this study, among the MetS components, central obesity, high TG, and BP were more dominant in men than in women, whereas low HDL-C was predominant in women. In addition, low HDL in women or high TG in men was significantly associated with the risk for dysglycemia/
T2DM after adjusting for the confounding factors such as HOMA-IR and lifestyle factors. A national cross-sectional sur- vey conducted in the United States [20] demonstrated that MetS was a heterogeneous entity associated with age and sex variation in component clusters, and different combinations of MetS components were associated with mortality risk rather than the number of MetS components or the presence of MetS itself. In addition, low-HDL-C increased the risk of T2DM in epidemiologic studies [21,22]. Meanwhile, lifestyle factors in- cluding alcohol consumption [23], exercise [24], and smoking [25] were also closely associated with MetS. As a result, we fur- ther considered these lifestyle confounding factors and found a significant correlation between sex differences in MetS compo- nents and the risk for T2DM/dysglycemia in this study. The finding suggested that the presence of MetS as well as different components related to sex are closely associated with the risk for T2DM or dysglycemia in general population.
HOMA-IR cut-off point for dysglycemia was 1.6 for both sex in our study population. Insulin resistance is a major patho- physiological feature associated with the risk for MetS, T2DM, and overall mortality risk, and is useful as a prognostic indica- tor to facilitate early diagnosis of dysglycemia or T2DM. How- ever, previous studies to identify the association between insu- lin resistance indices with the risk for cardiometabolic disease showed various results. Several cross-sectional large popula- tion studies reported various cut-off values to discriminate MetS (HOMA-IR, 1.7 to 3.8) according to the study popula- tion, sample size, and diagnostic criteria for insulin resistance [26]. HOMA-IR ≥2.5 was also suggested as the cut-off value for insulin resistance by Japan Diabetes Society [27] and the value of 1.7 was suggested as a cut-off for identifying subjects with high risk for MetS in Japanese studies [28]. As a marker of early stage pre-diabetes (FPG >100 mg/dL or HbA1c >5.7%) in our study, the cut-off value of HOMA-IR (1.6) was similar to the value used to distinguish MetS risk in a Japanese study [28]. In addition, the HOMA-IR cut-off in our study for dys- glycemia was also independently associated with each MetS
component (OR, 2.03 to 7.61 according to MetS factors and sex) regardless of age and lifestyle factors. It may suggest that this HOMA-IR cut-off point could be another option for early detection of dysglycemia and risk for accompanying MetS components. Of course, from the perspective of diabetes and MetS prevention, the sensitivity and the specificity of the test were around 60% to 70% and adoption of single HOMA-IR cut-off value of 1.6 was not adequate to completely replace other risk factors. As a result, the cut-off values for HOMA-IR might not be represent stringent guideline for the early detec- tion of IGT. However, they can aid our understanding of the clinical complexity of the patients with the highest risk for de- veloping diabetes or MetS.
In our study, the overall accuracy of HOMA-IR values in identifying T2DM varied between men and women. A signifi- cant effect of age on the diagnostic performance of HOMA-IR was observed as the accuracy of insulin resistance index in T2DM diagnosis progressively decreased with aging especially in women. In addition, sensitivity was lower than 50% in el- derly men (≥60 years) and lower than 60% in elderly women (≥70 years) based on HOMA-IR cut-off value. Meanwhile, among subgroups of dysglycemia (n=1,922) manifesting higher insulin resistance levels than the NGT group, a signifi- cantly lower level of HOMA-β was observed in older subjects (≥50 years) under higher insulin resistance (highest tertiles of HOMA-IR). Previous reports suggested age- and sex-specific differences in HOMA-IR distribution in subjects with non-di- abetic state [8,14], and different AUC and cut-off values of HOMA-IR were observed in identifying MetS according to age and sex, especially in women [10]. Therefore, a single one- point cut-off value is not adequate for early detection of severe cardiometabolic risk. Impairment of compensatory pancreatic β-cell response to insulin resistance results in dysglycemia or overt T2DM and subjects were more vulnerable to insulin re- sistance with increasing age. Previous studies reported a de- crease in fasting insulin with advancing age, which is associat- ed with blunted insulin secretion or limited β-cell function [29,30]. In addition, postmenopausal women tend to be more vulnerable to insulin resistance as estrogen deficiency induces central obesity with changed body composition [31]. Mean- while, in a study of healthy Iranian population, age, WC, and SBP were biological determinants of fasting insulin in both sex and insulin secretion was further modulated by different MetS components according to sex (TG in men and FPG in women) [30]. In addition, the association between increasing HOMA-
IR value over time and the development of T2DM was ob- served in subjects with impaired insulin secretion but not in those with normal secretory function [11]. In addition to insu- lin resistance, pancreatic insulin secretory function should be considered to assess the pathophysiology and risk for T2DM, especially in elderly populations.
There are some limitations in our study. First, HOMA-IR mostly reflects hepatic insulin resistance and did not fully rep- resent insulin resistance unlike the euglycemic clamp [32].
Second, defining dysglycemia or T2DM in our study was as- sessed by FPG or HbA1c levels without considering postpran- dial glucose levels because of the study design. Because of the relative predominance of postprandial glucose excursions in early T2DM [33], there is a possibility that some people with IGT were not included in the dysglycemic group. However, we considered HbA1c levels for diagnosis of T2DM or pre-diabe- tes in which HbA1c was closely associated with postprandial glucose levels rather than FPG [34]. Third, the cross-sectional study design prevented a comprehensive evaluation of the pe- riodic changes in anthropometric and lifestyle factors to deter- mine the causal relationship between insulin resistance and the incidence of dysglycemia or T2DM. Even though we excluded subjects who already took anti-diabetic drugs to minimize confounding effects that affect insulin resistance and secretory function, it could be crucial limitation because this study did not represents the whole Korean population and selection bias could affects the results. However, we tried to determine the cut-off values in healthy Korean population selected from this non-institutionalized population-based study and other life- style factors (smoking, exercise, and education) were also con- sidered to evaluate to relationship between insulin resistance and MetS or impaired glucose metabolism. A future large pro- spective study should be performed to generalize this cut-off values and the risk for impaired glucose metabolism.
In conclusion, a HOMA-IR cut-off value of 1.6 in both sex was significantly associated with the risk for dysglycemia as well as MetS components in Korean population regardless of age. The cut-off values of HOMA-IR for T2DM were 2.87 for men and 2.36 for women. However, the different diagnostic ranges of HOMA-IR were used to distinguish T2DM accord- ing to age and sensitivity progressively decreased with age es- pecially in women. Different MetS components and insulin se- cretory function in old age should also be considered when adopting HOMA-IR cut-off values for T2DM assessment.
CONFLICTS OF INTEREST
No potential conflict of interest relevant to this article was re- ported.
REFERENCES
1. Abdul-Ghani MA, Tripathy D, DeFronzo RA. Contributions of beta-cell dysfunction and insulin resistance to the pathogen- esis of impaired glucose tolerance and impaired fasting glu- cose. Diabetes Care 2006;29:1130-9.
2. Noh J. The diabetes epidemic in Korea. Endocrinol Metab (Seoul) 2016;31:349-53.
3. Danaei G, Finucane MM, Lu Y, Singh GM, Cowan MJ, Pacio- rek CJ, Lin JK, Farzadfar F, Khang YH, Stevens GA, Rao M, Ali MK, Riley LM, Robinson CA, Ezzati M; Global Burden of Metabolic Risk Factors of Chronic Diseases Collaborating Group (Blood Glucose). National, regional, and global trends in fasting plasma glucose and diabetes prevalence since 1980:
systematic analysis of health examination surveys and epide- miological studies with 370 country-years and 2·7 million par- ticipants. Lancet 2011;378:31-40.
4. Kodama K, Tojjar D, Yamada S, Toda K, Patel CJ, Butte AJ. Eth- nic differences in the relationship between insulin sensitivity and insulin response: a systematic review and meta-analysis.
Diabetes Care 2013;36:1789-96.
5. Ohn JH, Kwak SH, Cho YM, Lim S, Jang HC, Park KS, Cho NH. 10-Year trajectory of β-cell function and insulin sensitivity in the development of type 2 diabetes: a community-based prospective cohort study. Lancet Diabetes Endocrinol 2016;4:
27-34.
6. Matthews DR, Hosker JP, Rudenski AS, Naylor BA, Treacher DF, Turner RC. Homeostasis model assessment: insulin resis- tance and beta-cell function from fasting plasma glucose and insulin concentrations in man. Diabetologia 1985;28:412-9.
7. Bonora E, Targher G, Alberiche M, Bonadonna RC, Saggiani F, Zenere MB, Monauni T, Muggeo M. Homeostasis model as- sessment closely mirrors the glucose clamp technique in the assessment of insulin sensitivity: studies in subjects with vari- ous degrees of glucose tolerance and insulin sensitivity. Diabe- tes Care 2000;23:57-63.
8. Gayoso-Diz P, Otero-Gonzalez A, Rodriguez-Alvarez MX, Gude F, Cadarso-Suarez C, Garcia F, De Francisco A. Insulin resistance index (HOMA-IR) levels in a general adult popula- tion: curves percentile by gender and age. The EPIRCE study.
Diabetes Res Clin Pract 2011;94:146-55.
9. Esteghamati A, Ashraf H, Esteghamati AR, Meysamie A, Khalilzadeh O, Nakhjavani M, Abbasi M. Optimal threshold of homeostasis model assessment for insulin resistance in an Ira- nian population: the implication of metabolic syndrome to de- tect insulin resistance. Diabetes Res Clin Pract 2009;84:279-87.
10. Gayoso-Diz P, Otero-Gonzalez A, Rodriguez-Alvarez MX, Gude F, Garcia F, De Francisco A, Quintela AG. Insulin resis- tance (HOMA-IR) cut-off values and the metabolic syndrome in a general adult population: effect of gender and age. EPIRCE cross-sectional study. BMC Endocr Disord 2013;13:47.
11. Morimoto A, Tatsumi Y, Soyano F, Miyamatsu N, Sonoda N, Godai K, Ohno Y, Noda M, Deura K. Increase in homeostasis model assessment of insulin resistance (HOMA-IR) had a strong impact on the development of type 2 diabetes in Japa- nese individuals with impaired insulin secretion: the Saku study. PLoS One 2014;9:e105827.
12. Lee CH, Shih AZ, Woo YC, Fong CH, Leung OY, Janus E, Cheung BM, Lam KS. Optimal cut-offs of homeostasis model assessment of insulin resistance (HOMA-IR) to identify dys- glycemia and type 2 diabetes mellitus: a 15-year prospective study in Chinese. PLoS One 2016;11:e0163424.
13. Ghasemi A, Tohidi M, Derakhshan A, Hasheminia M, Azizi F, Hadaegh F. Cut-off points of homeostasis model assessment of insulin resistance, beta-cell function, and fasting serum insulin to identify future type 2 diabetes: Tehran Lipid and Glucose Study. Acta Diabetol 2015;52:905-15.
14. Yun KJ, Han K, Kim MK, Park YM, Baek KH, Song KH, Kwon HS. Insulin resistance distribution and cut-off value in Koreans from the 2008-2010 Korean National Health and Nutrition Ex- amination Survey. PLoS One 2016;11:e0154593.
15. Korea Centers for Disease Control and Prevention: The Sixth Korea National Health and Nutrition Examination Survey (KNHANES VI). Available from: https://knhanes.cdc.go.kr/
knhanes/intro.html (cited 2018 Mar 23).
16. Kweon S, Kim Y, Jang MJ, Kim Y, Kim K, Choi S, Chun C, Khang YH, Oh K. Data resource profile: the Korea National Health and Nutrition Examination Survey (KNHANES). Int J Epidemiol 2014;43:69-77.
17. American Diabetes Association. 2. Classification and diagnosis of diabetes. Diaetes Care 2016;39 Suppl 1:S13-22.
18. Alberti KG, Eckel RH, Grundy SM, Zimmet PZ, Cleeman JI, Donato KA, Fruchart JC, James WP, Loria CM, Smith SC Jr;
International Diabetes Federation Task Force on Epidemiology and Prevention; Hational Heart, Lung, and Blood Institute;
American Heart Association; World Heart Federation; Inter- national Atherosclerosis Society; International Association for the Study of Obesity. Harmonizing the metabolic syndrome: a joint interim statement of the International Diabetes Federa- tion Task Force on Epidemiology and Prevention; National Heart, Lung, and Blood Institute; American Heart Association;
World Heart Federation; International Atherosclerosis Society;
and International Association for the Study of Obesity. Circu- lation 2009;120:1640-5.
19. Lee SY, Park HS, Kim DJ, Han JH, Kim SM, Cho GJ, Kim DY, Kwon HS, Kim SR, Lee CB, Oh SJ, Park CY, Yoo HJ. Appropri- ate waist circumference cutoff points for central obesity in Ko- rean adults. Diabetes Res Clin Pract 2007;75:72-80.
20. Kuk JL, Ardern CI. Age and sex differences in the clustering of metabolic syndrome factors: association with mortality risk.
Diabetes Care 2010;33:2457-61.
21. Schmidt MI, Duncan BB, Bang H, Pankow JS, Ballantyne CM, Golden SH, Folsom AR, Chambless LE; Atherosclerosis Risk in Communities Investigators. Identifying individuals at high risk for diabetes: the Atherosclerosis Risk in Communities study. Diabetes Care 2005;28:2013-8.
22. Wilson PW, Meigs JB, Sullivan L, Fox CS, Nathan DM, D’Agostino RB Sr. Prediction of incident diabetes mellitus in middle-aged adults: the Framingham Offspring Study. Arch Intern Med 2007;167:1068-74.
23. Freiberg MS, Cabral HJ, Heeren TC, Vasan RS, Curtis Ellison R;
Third National Health and Nutrition Examination Survey. Al- cohol consumption and the prevalence of the metabolic syn- drome in the US: a cross-sectional analysis of data from the Third National Health and Nutrition Examination Survey. Dia- betes Care 2004;27:2954-9.
24. Golbidi S, Mesdaghinia A, Laher I. Exercise in the metabolic syndrome. Oxid Med Cell Longev 2012;2012:349710.
25. Oh SW, Yoon YS, Lee ES, Kim WK, Park C, Lee S, Jeong EK, Yoo T; Korea National Health and Nutrition Examination Sur- vey. Association between cigarette smoking and metabolic syndrome: the Korea National Health and Nutrition Examina- tion Survey. Diabetes Care 2005;28:2064-6.
26. Tang Q, Li X, Song P, Xu L. Optimal cut-off values for the ho- meostasis model assessment of insulin resistance (HOMA-IR) and pre-diabetes screening: developments in research and prospects for the future. Drug Discov Ther 2015;9:380-5.
27. Yamada C, Mitsuhashi T, Hiratsuka N, Inabe F, Araida N, Takahashi E. Optimal reference interval for homeostasis model assessment of insulin resistance in a Japanese population. J Di-
abetes Investig 2011;2:373-6.
28. Yamada C, Moriyama K, Takahashi E. Optimal cut-off point for homeostasis model assessment of insulin resistance to dis- criminate metabolic syndrome in non-diabetic Japanese sub- jects. J Diabetes Investig 2012;3:384-7.
29. Bryhni B, Arnesen E, Jenssen TG. Associations of age with se- rum insulin, proinsulin and the proinsulin-to-insulin ratio: a cross-sectional study. BMC Endocr Disord 2010;10:21.
30. Tohidi M, Ghasemi A, Hadaegh F, Derakhshan A, Chary A, Azizi F. Age- and sex-specific reference values for fasting se- rum insulin levels and insulin resistance/sensitivity indices in healthy Iranian adults: Tehran Lipid and Glucose Study. Clin Biochem 2014;47:432-8.
31. Gupte AA, Pownall HJ, Hamilton DJ. Estrogen: an emerging
regulator of insulin action and mitochondrial function. J Dia- betes Res 2015;2015:916585.
32. Borai A, Livingstone C, Kaddam I, Ferns G. Selection of the appropriate method for the assessment of insulin resistance.
BMC Med Res Methodol 2011;11:158.
33. Monnier L, Lapinski H, Colette C. Contributions of fasting and postprandial plasma glucose increments to the overall diurnal hyperglycemia of type 2 diabetic patients: variations with in- creasing levels of HbA(1c). Diabetes Care 2003;26:881-5.
34. Ketema EB, Kibret KT. Correlation of fasting and postprandial plasma glucose with HbA1c in assessing glycemic control: sys- tematic review and meta-analysis. Arch Public Health 2015;73:
43.
![Fig. 2. Area under the curve (AUC) (95% confidence interval [CI]) for (A) type 2 diabetes mellitus (T2DM) in men, (B) T2DM in women, (C) dysglycemia in men, and (D) dysglycemia in women in different age groups.](https://thumb-ap.123doks.com/thumbv2/123dokinfo/5221408.123567/6.892.84.809.130.651/confidence-interval-diabetes-mellitus-dysglycemia-dysglycemia-different-groups.webp)