I. Introduction
According to recent changes of medical service from treat- ment focus to prevention focus, the dominant market of providing treatment services is being replaced by the market of consumers visiting hospitals to receive prevention services [1]. Also clients now select hospitals more freely by collect- ing information from various sources and therefore, hospi- tals have a higher threat to their business environment due to leaving patients [2].
So far, general companies and hospitals have put in much effort to attract new customers for management improve- ment. Awareness of existing customers was relatively small and as a result the hospitals are experiencing many leaving existing customers [1,3,4]. According to some studies, the expenses for attracting new customers have been about five times as high as the expenses for maintaining existing cus-
Data Mining Application in Customer Relationship Management for Hospital Inpatients
Eun Whan Lee, MPH
Department of Social and Preventive Medicine, Sungkyunkwan University School of Medicine, Suwon, Korea
Objectives: This study aims to discover patients loyal to a hospital and model their medical service usage patterns. Conse- quently, this study proposes a data mining application in customer relationship management (CRM) for hospital inpatients.
Methods: A recency, frequency, monetary (RFM) model has been applied toward 14,072 patients discharged from a university hospital. Cluster analysis was conducted to segment customers, and it modeled the patterns of the loyal customers’ medical services usage via a decision tree. Results: Patients were divided into two groups according to the variables of the RFM model and the group which had significantly high frequency of medical use and expenses was defined as loyal customers, a target market. As a result of the decision tree, the predictable factors of the loyal clients were; length of stay, certainty of selectable treatment, surgery, number of accompanying treatments, kind of patient room, and department from which they were dis- charged. Particularly, this research showed that when a patient within the internal medicine department who did not have surgery stayed for more than 13.5 days, their probability of being a classified as a loyal customer was 70.0%. Conclusions: To dis- cover a hospital's loyal patients and model their medical usage patterns, the application of data-mining has been suggested.
This paper suggests practical use of combining segmentation, targeting, positioning (STP) strategy and the RFM model with data-mining in CRM.
Keywords: Hospital-Patient Relations, Patient-Centered Care, Patient Satisfaction, Data Mining, Decision Tree
Healthc Inform Res. 2012 September;18(3):178-185.
http://dx.doi.org/10.4258/hir.2012.18.3.178 pISSN 2093-3681 • eISSN 2093-369X
Submitted: July 9, 2012 Revised: August 18, 2012 Accepted: September 5, 2012 Corresponding Author Eun Whan Lee, MPH
Department of Social and Preventive Medicine, Sungkyunkwan University School of Medicine, 2066 Seobu-ro, Jangan-gu, Suwon 440-746, Korea. Tel: +82-31-299-6296, Fax: +82-31-299-6029, E- mail: [email protected]
This is an Open Access article distributed under the terms of the Creative Com- mons Attribution Non-Commercial License (http://creativecommons.org/licenses/by- nc/3.0/) which permits unrestricted non-commercial use, distribution, and reproduc- tion in any medium, provided the original work is properly cited.
ⓒ 2012 The Korean Society of Medical Informatics
tomers [5], and a 5% reduction of customer defection rate of regular customers has effected the increasing company net profit by 25-85% [6]. In this view, it appears that maintaining existing customers is favorable than creating new custom- ers in terms of a strategic hospital management. As a result, rather than using a customer acquisition strategy towards unspecified individuals, now hospitals select loyal custom- ers by analyzing accumulated information with those who have maintained a relationship for a long period of time and are introducing customer relationship management (CRM) marketing regarding them [7,8]. In other words, for management deterioration due to customers leaving and op- portunity costs, CRM is becoming an important issue to the hospitals management.
CRM is a process of marketing by segmenting customers to better understand them and for the purpose of improving long-term relationships with valuable customers [8]. That is, a most distinct feature of CRM is not a traditional method of collecting the most number of customers but, CRM is a customer centered marketing which provides a service that meets individuals based on their characteristics and consum- ing patterns [6]. This technique of marketing arose from the segmentation, targeting, positioning (STP) strategy which can be seen as the core of marketing and STP separates a market of large-scale customers (segmentation) and selects the target market (targeting) and then positioning a service or product into their minds for recognition (positioning).
In other words, segmentation, targeting, and positioning together comprise a three stage process; first, determining which kinds of customers exist, second, selecting which ones corporations are best off trying to serve and, finally, imple- menting their segmentation by optimizing their products/
services for that segment [9]. Therefore, in order to perform CRM, it is extremely important to select targets that the hos- pitals can provide intensive services, discover high fidelity customers with an accurate understanding their characteris- tics, and further, predicting fidelity customers is necessary.
This study was performed to suggest a practical method of data-mining in CRM of hospitals. A detailed research aims are discovering loyal customers from a large scale database of discharged patients by combining data-mining with STP strategy and recency, frequency, monetary (RFM) model that are being used as marketing strategies among general companies. RFM model is used for customer value analysis and applied for market segmentation. It is a behavior-based model to analyze the customers’ purchasing patterns by us- ing customers’ information in large scale database. RFM model is composed of three measures, namely recency, fre- quency, and monetary [10-12].
II. Methods
This study used a database of discharged patients from a uni- versity hospital in Seoul between January 1st and December 31st 2009. Among a total of 16,346 discharged patients, we excluded unsuitable patients for this study purpose (younger than 19, foreigners, and patients who were participating clinical trials), and 14,072 patients were selected as final sub- jects.
In this study, STP strategy and RFM model are combined with data-mining in order to perform CRM of hospitals. In order to discover fidelity customers, segmentation and tar- geting was performed by applying a core marketing strategy, i.e., STP strategy [9] and while using this, variables of RFM model were used, which has been used for the criteria of seg- mentation in marketing. It is also being used as an extremely important method when commencing marketing activity or assessing customers' values [10,11]. And more recently, this is being used as a classification method of fidelity customers to perform CRM in hospitals [12]. In this study, the variables representing consuming frequency was the number of ad- mission and visiting out-patient department (OPD) prior to one year of index admission and the variables representing monetary were expenses for being discharged from the hos- pital and the expenses per visit for out-patient care.
Independent variables consisted of the factors associated with loyal customers revealed in previous study [1,12]. And it can be classified into three characteristics: demographic characteristics, medical service use characteristics and dis- ease group characteristics. First, the variables of demograph- ic characteristics are gender, age, place of residence, and insurance, and the variables of medical service use charac- teristics are a department (internal/surgical affiliation), kind of patient room, route of admission, surgery certainty, re- admission certainty, length of stay (LOS), and a number of accompanying treatments. Also, International Classification of Diseases (ICD)-10 code of main diagnostic criteria at the time of discharge was used for disease group characteristics.
The analyzing method for market segmentation and target market selection, k-means algorithm cluster analysis was performed by applying RFM variables and comparing the groups’ differences through a t-test. Furthermore, to com- pare target market of fidelity customers and general custom- ers' demographic characteristics, medical service use charac- teristics, disease group characteristics, t-test and chi-square test were performed. Lastly, the medical use pattern model- ing was performed by applying a decision tree. During this process, the full analysis of the data was segmented to 70%
of training data and 30% of validation data. This study relied
on the training data to create a model; it applied the created model to the validation data [13-15].
To assess the decision tree, it has been compared with a logistic regression by using root asymptotic standard error (ASE), misclassification rate and receiver operating charac- teristic (ROC) curve which are the most fundamentally used for comparing the predictive power of models.
For data analysis, t-test and chi-square tests were performed using the statistical package SAS ver. 9.1 (SAS Institute Inc., Cary, NC, USA) and the cluster analysis and decision tree used the Enterprise Miner ver. 4.0 (SAS Institute Inc.).
III. Results
1. Classification of Fidelity Patients
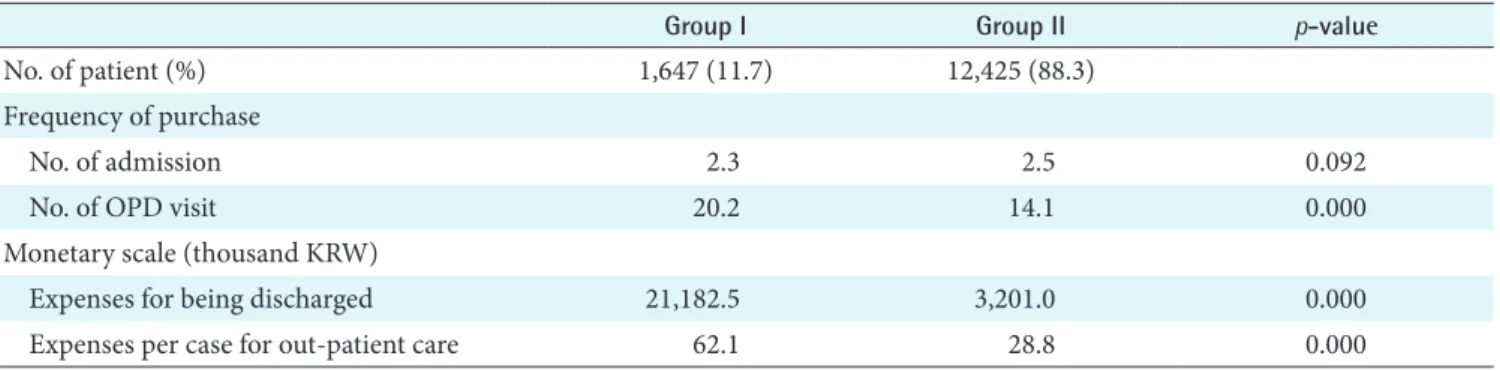
For market segmentation and target market selection, the customers were classified into two groups on the basis of RFM standards and the differences of the two groups are as follows (Table 1).
First, among the variables that represent customers' hos- pital use frequency, the number of admission within 1 year prior to discharge showed no statistical significant difference (p = 0.092). It showed an average of 2.3 times in group I and an average of 2.5 times in group II. But in the case of the number of visiting OPD, statistically, group I showed an av- erage of 20.2 times which is significantly higher than the av- erage of 14.1 times of the group II (p = 0.000). For expenses for being discharged from the hospital among the variables that represent customers' consumption scale, the group I shows 21,182.5 thousand KRW and is significantly higher than 3,201.0 thousand KRW in the group II statistically (p = 0.000). For expenses per one visit OPD, group I was signifi- cantly higher with 62.1 thousand KRW, while group II was 28.8 thousand KRW (p = 0.000).
After comparing differences between the two groups, group I that had significantly higher in hospital use frequency and
consumption scale were defined as loyal customers in the target market and group II was defined as ordinary custom- ers.
2. Comparison of Characteristics between Loyal Customers and Ordinary Customers
After comparing the demographic characteristics of gen- eral customers with loyal customers who had been selected through market segmentation, in gender of fidelity custom- ers, men were 58.2% and were higher than women, 52.9%
(p = 0.000). In a case of age, those aged 65 years old above (40.7%) were most common in loyal customers but ordinary customers were mostly aged between 50-64 years old as 33.5% (p = 0.000) (Table 2).
When examining characteristics of medical use, surgical department in loyal customers was 65.6% and this was rela- tively higher than 58.3% of ordinary customers (p = 0.000).
The percentage of private room use in loyal customers was 28.2% and this was approximately three times higher than 10.1% of ordinary customers (p = 0.000). Furthermore, ad- missions through the emergency room in loyal customers was 47.6% and ordinary customers was 25.3% (p = 0.000). In the case of surgery, loyal customers was 48.5% and ordinary customers 39.8% (p = 0.000). LOS was significantly longer in loyal customers (28.0 ± 21.3 days) than ordinary custom- ers (6.2 ± 5.6 days; p = 0.000), and accompanying treatments also showed a greater number in loyal customers (6.4 ± 6.6) than general customers (0.9 ± 1.7; p = 0.000) (Table 3).
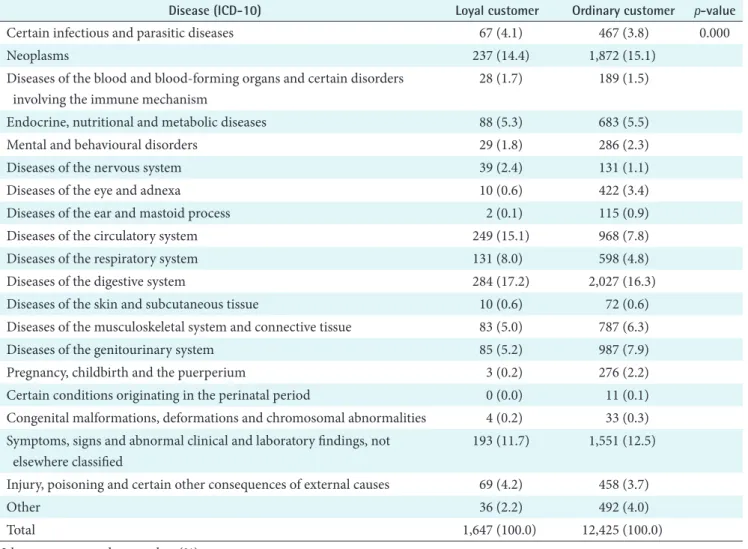
When disease group characteristics are compared of ordi- nary customers with loyal customers, through ICD-10 code at the time of discharge, the percentages of diseases of the di- gestive system and neoplasm were high in both groups. The diseases of the circulatory system was the second-highest in the case of loyal customers; but in the case of ordinary pa- tients, symptoms, signs and abnormal clinical and laboratory findings, not elsewhere classified was the second-highest.
Table 1. Patient segmentation by variables of recency, frequency, and monetary
Group I Group II p-value
No. of patient (%) 1,647 (11.7) 12,425 (88.3)
Frequency of purchase
No. of admission 2.3 2.5 0.092
No. of OPD visit 20.2 14.1 0.000
Monetary scale (thousand KRW)
Expenses for being discharged 21,182.5 3,201.0 0.000
Expenses per case for out-patient care 62.1 28.8 0.000
OPD: out-patient department.
Table 2. Demographic characteristics of subjects
Characteristic Loyal customer Ordinary customer p-value
Gender 0.000
Male 959 (58.2) 5,857 (47.1)
Female 688 (41.8) 6,568 (52.9)
Age 0.000
20-34 142 (8.6) 1,822 (14.7)
35-49 305 (18.5) 2,891 (23.3)
50-64 529 (32.1) 4,161 (33.5)
65+ 671 (40.7) 3,551 (28.6)
Residential regions 0.093
Seoul 885 (53.7) 6,986 (56.2)
Gyeonggi/Incheon 422 (25.6) 2,905 (23.4)
Others 340 (20.6) 2,534 (20.4)
Insurance 0.000
National health insurance 1,523 (92.5) 11,580 (93.2)
Medical aid 62 (3.8) 570 (4.6)
Others 62 (3.8) 275 (2.2)
Total 1,647 (100.0) 12,425 (100.0)
Values are presented as number (%).
Table 3. Health care utilization characteristics of subjects
Characteristic Loyal customer Ordinary customer p-value
Department 0.000
Internal 566 (34.4) 5,176 (41.7)
Surgical 1,081 (65.6) 7,249 (58.3)
Patient room 0.000
Private room 465 (28.2) 1,256 (10.1)
Two beds 131 (8.0) 1,411 (11.4)
Three beds over 1,051 (63.8) 9,758 (78.5)
Route of admission 0.000
Out-patient department 863 (52.4) 9,284 (74.7)
Emergency room 784 (47.6) 3,141 (25.3)
Surgery 0.000
Yes 798 (48.5) 4,941 (39.8)
No 849 (51.5) 7,484 (60.2)
Readmission 0.001
Yes 399 (24.2) 3,509 (28.2)
No 1,248 (75.8) 8,916 (71.8)
Length of stay (day) 28.0 ± 21.3 6.2 ± 5.6 0.000
No. of accompanying treatment 6.4 ± 6.6 0.9 ± 1.7 0.000
Total 1,647 (100.0) 12,425 (100.0)
Values are presented as number (%) or mean ± standard deviation.
Moreover, loyal customers (2.4%) were roughly double the amount than ordinary customers (1.1%) in diseases of the nervous system and in pregnancy, childbirth and the puer- perium case, loyal customers were 0.2% but ordinary cus- tomers were relatively high, 2.2% (p = 0.000) (Table 4).
3. Model of the Loyal Customers’ Patterns of Medical Service Use
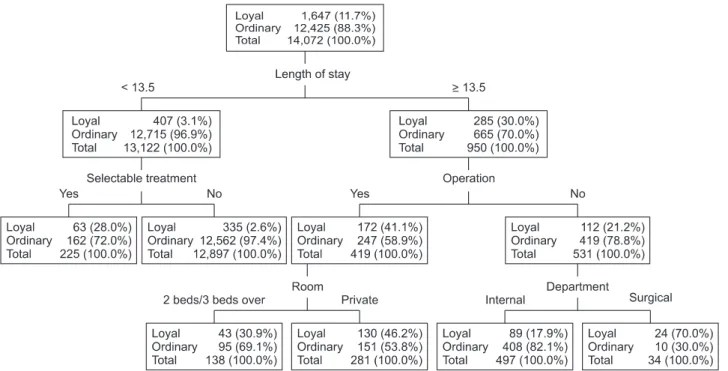
After analyzing the medical use patterns of loyal customers by applying the decision tree, factors that classify into loyal and ordinary customers were LOS, certainty of selectable treatment, surgery, number of accompanying treatments, kind of patient room, and department from which they were discharged (Figure 1).
The most important variable in classifying into loyal cus- tomers and ordinary customers was the LOS. While if a patient was in the hospital shorter than 13.5 days, the prob- ability of being classified into a loyal customer was 3.1%, if a
patient was in the hospital 13.5 days or longer, the probabil- ity was 30.0%.
In case of patients who were in the hospital longer than 13.5 days, factor that classify into loyal and ordinary custom- ers was whether or not they had surgery. As for the patients who had surgery, the probability of being classified into loyal customers was 41.1%; as for the patients who did not, it was 21.2%. The factor in classifying patients who were in the hospital 13.5 days or longer and had surgery was what kind of patient room they stayed in. As for patients who stayed in a one-patient room, the probability of being loyal customers was 46.2%. And as for patients who stayed in the others, it was 30.9%. In contrast, the factor in classifying patients who stayed 13.5 days or longer but did not have surgery was the department from which they were discharged. As for the patients who stayed in the department of internal medicine, the probability was 70.0%; as for the patients who stayed in the department of surgery, it was 17.9%.
Table 4. Disease group characteristics of subjects (ICD-10 code)
Disease (ICD-10) Loyal customer Ordinary customer p-value
Certain infectious and parasitic diseases 67 (4.1) 467 (3.8) 0.000
Neoplasms 237 (14.4) 1,872 (15.1)
Diseases of the blood and blood-forming organs and certain disorders involving the immune mechanism
28 (1.7) 189 (1.5)
Endocrine, nutritional and metabolic diseases 88 (5.3) 683 (5.5)
Mental and behavioural disorders 29 (1.8) 286 (2.3)
Diseases of the nervous system 39 (2.4) 131 (1.1)
Diseases of the eye and adnexa 10 (0.6) 422 (3.4)
Diseases of the ear and mastoid process 2 (0.1) 115 (0.9)
Diseases of the circulatory system 249 (15.1) 968 (7.8)
Diseases of the respiratory system 131 (8.0) 598 (4.8)
Diseases of the digestive system 284 (17.2) 2,027 (16.3)
Diseases of the skin and subcutaneous tissue 10 (0.6) 72 (0.6)
Diseases of the musculoskeletal system and connective tissue 83 (5.0) 787 (6.3)
Diseases of the genitourinary system 85 (5.2) 987 (7.9)
Pregnancy, childbirth and the puerperium 3 (0.2) 276 (2.2)
Certain conditions originating in the perinatal period 0 (0.0) 11 (0.1)
Congenital malformations, deformations and chromosomal abnormalities 4 (0.2) 33 (0.3) Symptoms, signs and abnormal clinical and laboratory findings, not
elsewhere classified
193 (11.7) 1,551 (12.5)
Injury, poisoning and certain other consequences of external causes 69 (4.2) 458 (3.7)
Other 36 (2.2) 492 (4.0)
Total 1,647 (100.0) 12,425 (100.0)
Values are presented as number (%).
ICD: International Classification of Diseases.
In the case where LOS was shorter than 13.5 days, the fac- tor of classifying loyal customers were shown by certainty of selectable treatments and when the patients selected treat- ments then the probability of being loyal customers was 28.0% but the probability dropped to 2.6% when treatments were not chosen.
4. Evaluation of the Model
In order to evaluate the model, this study compared the de- cision tree with the logistic regression. As for the root ASE, the decision tree was 0.230 and the logistic data was 0.244, in the training data, and that the decision tree was 0.228 and the logistic regression was 0.243, in the validation data, indi- cating that the decision tree was a little more excellent than the logistic regression. And, the result of misclassification rate showed that the decision tree was 0.065 and the logistic regression was 0.075 in the training data and that the deci- sion tree was 0.061 and the logistic regression was 0.077 in
the validation data, indicating the model of decision tree was relatively excellent (Table 5). And according to the compari- son of the ROC curves of the two models, it was judged that the model of decision tree was relatively excellent (Figure 2).
In summary of above contents, the decision tree model used in this study as a whole, judged to appropriate.
IV. Discussion
For selected loyal customers through market segmenta- tion, a medical use pattern model of loyal customers was established by using a decision tree which is one of the data- mining methods. A decision tree is a set rule that predicts Figure 1. Model of patterns of loyal customers' medical service use.
Figure 2. Comparison between decision tree and logistic regres- sion by receiver operating characteristic curve.
Table 5. Comparison between decision tree and logistic regression Decision
tree
Logistic regression
Root ASE Training data 0.230 0.244
Validation data 0.228 0.243 Misclassification rate Training data 0.065 0.075 Validation data 0.061 0.077 ASE: asymptotic standard error.
target variables and creating the classification trees by re- peatedly dividing the data. During this process, a tree branch is made and every branch decides the classification criteria of the dividing data. Therefore, it explores the set of data and determines the variable that is predicted as the most signifi- cant of the predictor variable. Structure of the decision tree provides good visualization, and helps understand and ex- plain the process with ease, but its weakness is that when the sample size is small there are a large number of end branches formed [13,14,16]. In this study, by applying the data 70% of training and 30% of validation, a model overfitting that can be occur during estimating the model was solved [13,15].
And to evaluate decision tree model, it was compared with the logistic regression model, which is fundamentally used when the dependent variable is binomial.
The decision tree showed that the most important factor of classifying loyal customers is LOS and when they were rela- tively higher than the criteria based on 13.5 days, there was a higher probability of being loyal customers. A study on the model of predicting expenses of patients who were admit- ted in the hospital showed that the most important factor in predicting expenses was the LOS (by standards of 14.5 days). This is because hospitalized treatments expenses were included mostly with patients' rooms fees and this increases with the prolongation of hospitalized days [17,18]. Even in this report, longer LOS increased profitability of patients due to their hospitalized treatments fees and implying that they have a higher probability of being selected as loyal customers.
In case of the LOS was 13.5 days or longer, a factor that classifies the loyal customer was certainty of surgery, when one had a surgical operation, the probability of being a loyal customer was 41.1%. In previous study, the number of op- erations was shown as a factor of affecting increase in treat- ments fees and this is because the increase in profitability in respect to increase in treatments fees of patients due to surgical operation [17]. In a case of 13.5 days or longer LOS with a surgery, the factor of classifying into loyal customers was kind of the patient's room and when patient stayed in the private room, the probability of being loyal customers was high (46.2%). Room type is an important factor of af- fecting expenses for inpatient like LOS because treatment fees increase with using higher class rooms [18]. In the case of patients whose LOS were 13.5 days or longer and has not been operated on, then the loyal customer classifying factor was department from which they were discharged. When a patient was treated in an internal medicine department, the probability of being a loyal customer was high (70.0%).
Patients from the internal medicine department is generally higher due to the relatively high proportion of patients with
chronic disease and complications, hence it was reported that they have higher frequency of medical use [19].
In the case where LOS was shorter than 13.5 days, the fac- tor of classifying loyal customers was certainty of selectable treatments and the customers who had selected treatments had higher chance of being loyal customers (28.0%). In pre- vious study, the loyalty of customers was shown as being af- fected by selectable treatments [1]. In selectable treatments, patients choose doctors who they want to receive treatments from and are based on the relationship of the doctor and patient. Moreover, the relationship with doctors positively affects the hospital’s impression on customers. So customers who choose treatments than those who choose not to receive them have a higher credibility regarding the hospital and doctors also increasing their loyalty.
The limitation of this research is first, subjects are limited to only one hospital so the results cannot be generalized. Sec- ondly, a variable that represents a degree of severity of pa- tients was not included. In order to compromise this, surgery certainty and the number of accompanying treatments were used as independent variables yet it is hard to determine the severity of the disease directly. Thirdly, the proportion of unpaid treatment fees was a variable that represented the loyalty of customers in the previous study [1] but this study was unable to confirm unpaid treatment fees.
Despite the above limitations, the significance of this study is that is suggested an application method of data-mining for a hospital's CRM. To distinguish loyal customer and by mod- eling their medical use pattern, classification and prediction which are data-mining’s important functions were applied to a hospital’s marketing. A successful marketer must identify the needs of customers in different segments [12]. This study used RFM model and STP strategy, which are generally used in marketing, to classify patients and target loyal customers.
This paper suggests practical use of combining STP strategy and the RFM model with data-mining in CRM. And medical use patterns of loyal customers were established in modeling by applying a decision tree so, it assisted in not just find- ing factors associated with loyal customers but also to find increase loyal customers’ predictable probability in steps ac- cording to each factors.
Through the hospital CRM that was introduced in this study along with the uses of the data-mining method, we look for- ward to helping hospitals that are faced with recently increas- ing competitions improve their management activities.
Conflict of Interest
No potential conflict of interest relevant to this article was
reported.
References
1. Hwang SW, Lee HJ. Development of a revisit prediction model for the outpatient in a hospital. J Korean Soc Med Inform 2008;14(2):137-45.
2. Powell J, Clarke A. The WWW of the World Wide Web:
who, what, and why? J Med Internet Res 2002;4(1):e4.
3. Coile RC Jr. Competing in a "consumer choice" market.
J Healthc Manag 2001;46(5):297-300.
4. Scott G. Customer satisfaction: six strategies for continu- ous improvement. J Healthc Manag 2001;46(2):82-5.
5. Tiwana A. The essential guide to knowledge manage- ment: e-business and CRM applications. Upper Saddle River: Prentice Hall; 2001. p. 23-30.
6. Reichheld FF, Sasser WE Jr. Zero defections: quality comes to services. Harv Bus Rev 1990;68(5):105-11.
7. Young T. Hospital CRM: unexplored frontier of revenue growth? Healthc Financ Manag 2007;61(10):86-90.
8. Bose R. Customer relationship management: key com- ponents for IT success. Ind Manag Data Syst 2002;102(2):
89-97.
9. Kotler P, Keller KL. Marketing management. Harlow, UK: Pearson Education; 2011.
10. Weber A. A simple way to use RFM. Targ Mark 1997;
20(3):72-5.
11. Chen YL, Kuo MH, Wu SY, Tang K. Discovering recen- cy, frequency, and monetary (RFM) sequential patterns from customers’ purchasing data. Electron Commer Res Appl 2009;8(5):241-51.
12. Wei JT, Lin SY, Weng CC, Wu HH. A case study of ap- plying LRFM model in market segmentation of a chil- dren’s dental clinic. Expert Syst Appl 2012;39(5):5529- 33.
13. Han J, Kamber M. Data mining: concepts and tech- niques. 2nd ed. Amsterdam: Morgan Kaufmann; 2006.
14. Giudici P, Figini S. Applied data mining for business and industry. 2nd ed. Chichester, UK: Wiley; 2009.
15. Bellazzi R, Zupan B. Predictive data mining in clinical medicine: current issues and guidelines. Int J Med In- form 2008;77(2):81-97.
16. Steyerberg EW, Borsboom GJ, van Houwelingen HC, Eijkemans MJ, Habbema JD. Validation and updating of predictive logistic regression models: a study on sample size and shrinkage. Stat Med 2004;23(16):2567-86.
17. Kang JO, Chung SH, Suh YM. Prediction of hospital charges for the cancer patients with data mining tech- niques. J Korean Soc Med Inform 2009;15(1):13-23.
18. Kim ON, Kim YH, Kang SH, Kim SH. A study on effects of critical pathway practices by using BSC and datamin- ing method. J Korean Soc Med Inform 2002;8(2):51-68.
19. Lee EW. Selecting the best prediction model for read- mission. J Prev Med Public Health 2012;45(4):259-66.