Differentiation of True Recurrence from Delayed Radiation Therapy-related Changes in Primary Brain Tumors Using Diffusion-weighted Imaging, Dynamic Susceptibility Contrast Perfusion Imaging, and
Susceptibility-weighted Imaging
Dong Hyeon Kim1, Seung Hong Choi1, 2, Inseon Ryoo1, Tae Jin Yoon1, Tae Min Kim3, Se-Hoon Lee3, Chul-Kee Park4, Ji-Hoon Kim1, Chul-Ho Sohn1, Sung-Hye Park5, Il Han Kim6
1Department of Radiology, Seoul National University College of Medicine, Seoul, Korea
2Center for Nanoparticle Research, Institute for Basic Science, and School of Chemical and Biological Engineering, Seoul National University, Seoul, Korea
3Department of Internal Medicine, Cancer Research Institute, Seoul National University College of Medicine, Seoul, Korea
4Department of Neurosurgery, Seoul National University College of Medicine, Seoul, Korea
5Department of Pathology, Seoul National University College of Medicine, Seoul, Korea
6Department of Radiation Oncology, Cancer Research Institute, Seoul National University College of Medicine, Seoul, Korea
Purpose : To compare dynamic susceptibility contrast imaging, diffusion-weighted imaging, and susceptibility-weighted imaging (SWI) for the differentiation of tumor recurrence and delayed radiation therapy (RT)-related changes in patients treated with RT for primary brain tumors.
Materials and Methods: We enrolled 24 patients treated with RT for various primary brain tumors, who showed newly appearing enhancing lesions more than one year after completion of RT on follow-up MRI. The enhancing-lesions were confirmed as recurrences (n=14) or RT-changes (n=10). We calculated the mean values of normalized cerebral blood vol- ume (nCBV), apparent diffusion coefficient (ADC), and proportion of dark signal intensity on SWI (proSWI) for the enhancing-lesions. All the values between the two groups were compared using t-test. A multivariable logistic regression model was used to determine the best predictor of differential diagnosis. The cutoff value of the best predictor obtained from receiver-operating characteristic curve analysis was applied to calculate the sensitivity, specificity, and accuracy for the diagnosis.
Results: The mean nCBV value was significantly higher in the recurrence group than in the RT-change group (P=.004), and the mean proSWI was significantly lower in the recurrence group (P<.001). However, no significant difference was
Original Article
�Received; May 10, 2014�Revised; June 17, 2014
�Accepted; June 18, 2014
This study was supported by a grant from the National R&D Program for Cancer Control, Ministry of Health & Welfare, Republic of Korea (1120300), the Korea Healthcare technology R&D Projects, Ministry for Health, Welfare & Family Affairs (A112028 and HI13C0015), and the Research Center Program of IBS (Institute for Basic Science) in Korea.
Corresponding author : Seung Hong Choi, M.D., Ph.D.
Department of Radiology, Seoul National University College of Medicine, 28, Yongon-dong, Chongno-gu, Seoul 110-744, Korea.
Center for Nanoparticle Research, Institute for Basic Science, and School of Chemical and Biological Engineering, Seoul National University, Seoul 151- 742, Korea.
Tel. 82-2-2072-2861, Fax. 82-2-743-6385, E-mail : [email protected]
This is an Open Access article distributed under the terms of the Creative Commons Attribution Non-Commercial License (http://creativecommons.org/licenses/by-nc/3.0/) which permits unrestricted non-commercial use, distribution, and reproduction in any medium, provided the original work is properly cited.
Radiation therapy (RT) plays an important role in the treatment of various primary brain tumors from benign to malignant. Despite the advances in the delivery of radiation doses to tumors, radiation- induced brain injury or changes have been recognized through follow-up magnetic resonance imaging (MRI) after the completion of radiation treatment (1-3).
MRI provides a noninvasive method for identifying radiation-induced injury (4). Several characteristic imaging features of radiation changes on MRI have been discovered, including diffuse white matter edema-like changes, contrast-enhancing lesions and cysts (5-7). Among these changes, newly appearing contrast-enhancing lesions often receive the attention of both clinicians and neuroradiologists because these MRI lesions can mimic the recurrence of tumors.
There have been many efforts to distinguish radiation- related changes from true recurrence using various advanced imaging modalities, including diffusion- weighted imaging (DWI), dynamic susceptibility contrast (DSC) perfusion-weighted imaging (PWI), MR spectroscopy and even with PET scan (8).
DWI is based on the detection of a change in the random motion of protons in water, and it enables the characterization of tissues and the assessment of tumor cellularity (9, 10). The apparent diffusion coefficient (ADC) value from DWI has been believed to be helpful in distinguishing tumor recurrence from radiation- related changes in previous studies (11, 12). DSC PWI has been used to obtain measurements of tumor vascular physiology and hemodynamics. Normalized relative cerebral blood volume (nCBV) measurements of enhancing lesions reflect an assessment of perfusion,
and these measurements have been correlated with vascularity, which tends to be higher in recurrent tumors than in radiation-related changes (13-15).
An additional advanced MR sequence, susceptibility- weighted imaging (SWI), exploits the susceptibility differences between tissues to provide contrast for different regions of the brain, such as deoxygenated hemoglobin of veins and hemosiderin of hemorrhage, allowing for much better visualization of blood and microvessels (16). According to preliminary reports, post-radiation changes in the brain have been related with histopathologic vascular injury or cavernous hemangioma formation (17-20), and SWI could thus provide additional information for the differentiation of true recurrence from RT-related changes.
To our knowledge, there have been no previous studies that have compared the diagnostic value of aforementioned advanced MR sequences, including DWI, DSC PWI and SWI. Thus, the purpose of our study was to compare PWI, DWI and SWI for the differentiation of tumor recurrence and delayed RT- related changes in patients treated with RT for primary brain tumors.
This retrospective study was approved by the institu- tional review board of Seoul National University Hospital, and informed consent was waived.
Patient Selection
Sixty-nine patients with various primary brain tumors, who previously underwent brain RT and had undergone serial follow-up imaging studies with 3 T brain MRI in our institution between July 2010 and
MATERIALS AND METHODS INTRODUCTION
observed in the mean ADC values between the two groups. A multivariable logistic regression analysis showed that proSWI was the only independent variable for the differentiation; the sensitivity, specificity, and accuracy were 78.6% (11 of 14), 100% (10 of 10), and 87.5% (21 of 24), respectively.
Conclusion: The proSWI was the most promising parameter for the differentiation of newly developed enhancing-lesions more than one year after RT completion in brain tumor patients.
Index words : Tumor recurrence∙Radiation therapy-related change∙Diffusion-weighted imaging∙Perfusion imaging Susceptibility-weighted imaging
September 2012, were selected from our radiology report database. The inclusion criteria were as follows:
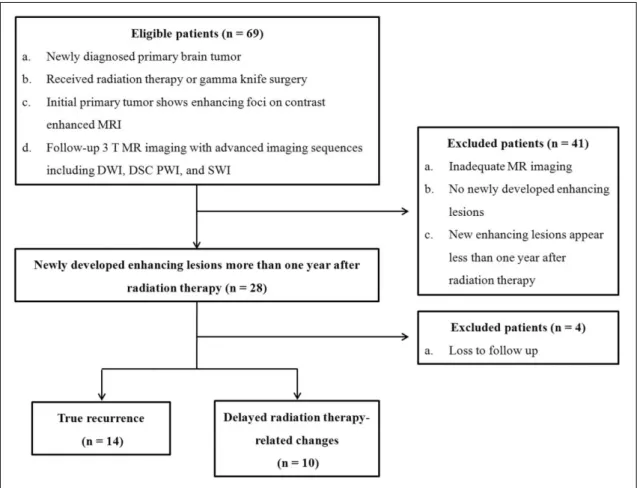
(a) the MRI images of the primary brain tumors had enhancing foci after a contrast media injection; (b) the patient underwent RT or gamma knife surgery for the primary brain tumor; (c) follow-up imaging was performed with contrast enhancement 3 T brain MRI, including advanced MRI sequences, such as DWI, DSC PWI, and SWI; and (d) follow-up MRI showed newly developed enhancing lesions inside the radiation field after intravenous injection of gadolinium-based contrast media, and the post-irradiation period was more than one year to meet the criteria of the delayed RT-induced changes from Sheline’s report (21).
We excluded 45 patients for the following reasons:
(a) inadequate MR imaging; (b) no newly appearing lesions on follow-up MR images; (c) newly developed lesions less than one year after the completion of RT;
and (d) loss to follow-up. As a result, a total of 24 patients (15 men, 9 women; mean age, 46.3 years old;
range, 26-66 years), consisting of 10 patients with glioblastoma, 4 patients with anaplastic astrocytoma, 3 patients with anaplastic oligodendroglioma, 2 patients with anaplastic oligoastrocytoma, and 5 other patients with miscellaneous tumors, including gliosarcoma (n = 1), primitive neuroectodermal tumor (n = 1), oligoden- droglioma (n = 1), pilocytic astrocytoma (n = 1), and ependymoma (n = 1), were included and identified to have true recurrence (n = 14) or delayed RT-related changes (n = 10) by either radiologic conclusion or histological confirmation after the surgery (Fig. 1).
Image Acquisition
In all the patients, follow up MRI studies were performed with one of two 3 T MR imaging scanners (n = 2 [true recurrence = 1 and RT-related changes = 1]; Signa Excite; GE Medical Systems, Milwaukee, WI, USA; and n = 22 [true recurrence = 13 and RT-related changes = 9]; Verio; Siemens MedicalSolutions, Erlangen, Germany) with an eight-channel head coil.
Fig. 1. Flow diagram of patient selection with inclusion and exclusion criteria. Note.─ DWI = diffusion-weighted imaging, DSC PWI = dynamic susceptibility contrast perfusion-weighted imaging, SWI = susceptibility-weighted imaging
The imaging protocol included spin-echo (SE) T1- weighted images (T1WI), fast SE (FSE) T2-weighted images (T2WI), fluid-attenuated inversion recovery (FLAIR) images, echo-planar DWI, SWI, DSC PWI with gadobutrol (Gadovist, Bayer Schering Pharma, Berlin, Germany), and subsequent contrast-enhanced (CE) SE T1WI. The MRI parameters were as follows-:
558-650/8-20 ms/70-90�/384 × 192-212 (TR/TE/
FA/matrix) for SE T1WI; 4500-5160/91-106.3 ms/
90-130�/448-640 × 220 for FSE T2WI; 9000-9900/
97-162.9 ms/90-130�/199-220 × 220 for FLAIR images; and 28/20 ms/15�/448 × 255 for SWI. The other parameters were the following: section thickness, 5 mm with a 1 mm gap; and field of view (FOV), 240 × 240 mm.
DWI was performed with a single-shot spin-echo echo-planar imaging sequence on the axial plane before the injection of contrast material with a TR/TE of 6900-10000/55-70 ms at b = 0 and 1000 sec/mm2, 35-38 sections, a 3-mm section thickness, a 1-mm intersection gap, an FOV of 240 × 240 mm, a matrix of 160 × 160, three signal averages, and a voxel resolution of 1.5 × 1.5 × 3 mm. DWI data were acquired in three orthogonal directions. Using these data, the averaged ADC maps from the three orthogo- nal directions were calculated on a voxel-by-voxel basis, using the software incorporated into the MR imaging unit.
DSC PWI was performed with a single-shot gradient-echo echo-planar imaging sequence during the intravenous injection of the contrast agent. The imaging parameters of DSC PWI were as follows:
TR/TE, 1500/30-40 ms; FA, 35-90�; FOV, 240 × 240 mm; 15-20 sections; matrix, 128 × 128; section thickness, 5 mm; intersection gap, 1 mm; and voxel resolution of 1.86 × 1.86 × 5 mm. For each section, 60 images were obtained at intervals equal to the repetition time. After four to five time points, a bolus of gadobutrol, at a dose of 0.1 mmol/kg of body weight and a rate of 4 mL/sec, was injected with an MR-compatible power injector (Spectris; Medrad, Pittsburgh, PA, USA). A bolus of the contrast material was followed by a 30 mL bolus of saline, which was administered at the same injection rate.
Determination of lesions
The two possible methods to determine the lesions
were as follows: radiologic conclusion; and histologic confirmation. For radiologic determination, two neuroradiologists (S.H.C. and J.H.K., with 8 and 10 years of brain MRI experience, respectively) indepen- dently reviewed the contrast-enhanced T1-weighted images, along with the conventional MR images. If the newly enhancing lesion persisted and even increased in extent on serial follow-up MR images, they regarded the lesion as true recurrence; in contrast, if the new lesion disappeared or spontaneously regressed without any treatment, it was regarded as an RT- related change. For cases in which the two radiologists’
findings were discrepant, a consensus extent was allocated. In cases of patients who underwent re- operation for the new lesions, histologic confirmation was available with postoperative specimens.
Quantitative Image Analysis
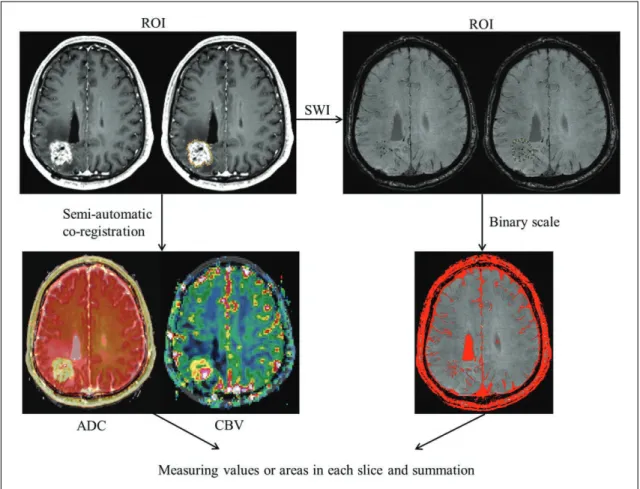
The MRI data for the conventional MR images, the ADC maps and the DSC PWI were digitally transferred from the Picture Archiving and Communication System (PACS) workstation to a personal computer for further analyses. Relative CBVs (rCBVs) were obtained by using a dedicated software package (nordicICE; NordicImagingLab, Bergen, Norway), with an established tracer kinetic model applied to the first-pass data (22, 23). First, realign- ment was performed to minimize patient motion during the dynamic scans. Gamma-variate function, which is an approximation of the first-pass response as it would appear in the absence of recirculation, was used to fit the 1/T2* curves to reduce the effects of recirculation. To reduce contrast agent leakage effects, the dynamic curves were mathematically corrected (24). After the elimination of recirculation and of the leakage of contrast agent, the rCBV was computed by means of numeric integration of the curve. To minimize variances in the rCBV value in an individual patient, the pixel-based rCBV maps were normalized by dividing every rCBV value in a specific section by the rCBV value in the unaffected white matter, as defined by a neuroradiologist (S.H.C.) (25). Co- registrations between the CE T1W images and the normalized CBV (nCBV) maps and between the CE T1W images and the ADC maps were performed based on geometric information stored in the respec- tive data sets, by using a dedicated software package
(nordicICE; NordicImagingLab, Bergen, Norway). The differences in slice thickness between images were corrected automatically by the re-slicing and co- registration method, which was based on underlying images and structural images. The nCBV maps and ADC maps were displayed as color overlays on the CE T1W images (Fig. 2).
The readers determined the ROIs by drawing the connecting dotted lines with nordicICE software in consensus that contained the entire enhancing lesion of contrast-enhanced T1W image on every continuous sections of the co-registered images. Any areas of gross hemorrhage, small vessels, and necrosis were identified and carefully excluded from the ROIs.
Regarding SW images, data from PACS were processed with professional imaging software (ImageJ, Wayne Rasband, National Institute of Health,
Bethesda, MD, USA). By setting the threshold that effectively marks only the dark signal intensity on SW images using a binary scale, the summation of the each section of dark signal areas produced the volumetric data of the SW images (Fig. 2). Then, the volume of dark signal intensity portions of the ROIs were divided by the total volume of the enhancing lesion, which was derived from the summation of ROIs on CE T1W image, to calculate ultimately the proportion of dark signal intensity of the lesions on SW images (proSWI).
Statistical Analysis
Clinical characteristics were compared between the true recurrence and RT-related change groups using Student’s unpaired t-test. To compare the values of ADC, nCBV, and proSWI between the true recurrence and RT-related change groups, Student’s unpaired t-
Fig. 2. Flow chart of quantitative image analysis. Region of interest (ROI) was manually selected in each section of the enhancing lesions, and was semi-automatically co-registered with the apparent diffusion coefficient and relative cerebral blood volume maps.
Volume of interest was determined by the summation of each slice, and final ADC and normalized CBV values were obtained. In cases of susceptibility-weighted imaging, the binary scale was adjusted to measure the area of dark signal intensity (SI) in the ROI (red spots show transformed dark SI). All the areas from each slice were also totaled for volumetric data. Note.─ ROI = region of interest, SWI = susceptibility-weighted imaging, ADC = apparent diffusion coefficient, CBV = cerebral blood volume
test was applied. A multivariable stepwise logistic regression model was used to determine the best predictors of differential diagnosis between the true recurrence and RT-related changes (26). With these data, we determined the diagnostic performance of the best predictor for differentiating true recurrence from RT-related changes. The cutoff value obtained from receiver-operating characteristic (ROC) curve analysis was also applied for the differentiation of true recurrence from RT-related changes, and the sensitiv- ity, specificity, and accuracy for the diagnosis of true recurrence were calculated for the parameter.
Accuracy was calculated using the sensitivity and specificity values. The leave-one-out cross-validation (LOOCV) test was also performed to evaluate the accuracy of proSWI in predicting true recurrence.
All the statistical analyses were performed with MedCalc software (Version 12.1.0 for Microsoft Windows 2000/XP/Vista/7, MedCalc Software, Mariakerke, Belgium). Results with P values less than
.05 were considered statistically significant.
Among the 24 patients enrolled in the study, 14 patients were finally concluded to have true recurrences (histologic confirmation = 11, radiologic conclusion = 3), and 10 patients were concluded to have RT-related changes (histologic confirmation = 2, radiologic conclusion = 8). The mean time from the completion of RT to new enhancing lesions on MRI was 1216.58 (range: 372-4423) days, and the mean radiation dose of all the enrolled patients was 73.74 (range: 33.6-129.6) Gy. Table 1 shows several clinical characteristics of the enrolled patients, and we found significant differences in none of the clinical parame- ters, including age, radiation dose, and the time after the completion of RT, between the true recurrence and RT-related change groups.
RESULTS
Table 1. Clinical Characteristics of the Patients
Total True recurrence RT-related changes P value
Total number of patients n = 24 n = 14 n = 10
Age, years 46.29 (±10.85) 45.07 (±12.13) 48 (±9.09) .527*
Sex
Male 15 12 3
Female 9 2 7
Confirmation
Histologic 13 11 2
Clinical 11 3 8
Radiation dose, Gy 73.74 (±18.14) 79.25 (±20.14) 66.02 (±11.9) .077*
Time after RT, days 1216.58 (±1097.26) 1036.57 (±1058.74) 1468.6 (±1156.17) .353*
Note.─ Data in parentheses are standard deviations. RT = radiation therapy
* The difference between the two groups was evaluated by using Student’s unpaired t-test.
Table 2. Comparison of Parameters in the True Recurrence Group and the RT-related Changes Group
True recurrence (n = 14) RT-related changes (n = 10) P value�
ADC1000(× 10-6mm2/sec) 1273 ± 203 1178 ± 113 .419
nCBV 2.64 ± 1.37 1.06 ± 0.84 .004*
proSWI (%) 4.37 ± 8.86 43.92 ± 35.87 < .001*
Note.─ Data are means ± standard deviations. ADC = apparent diffusion coefficient, nCBV = normalized relative cerebral blood volume, proSWI = proportion of dark signal intensity on susceptibility-weighted imaging
* Significant difference between the two groups (P < .05)
�The difference between the two groups was evaluated by using Student’s unpaired t-test.
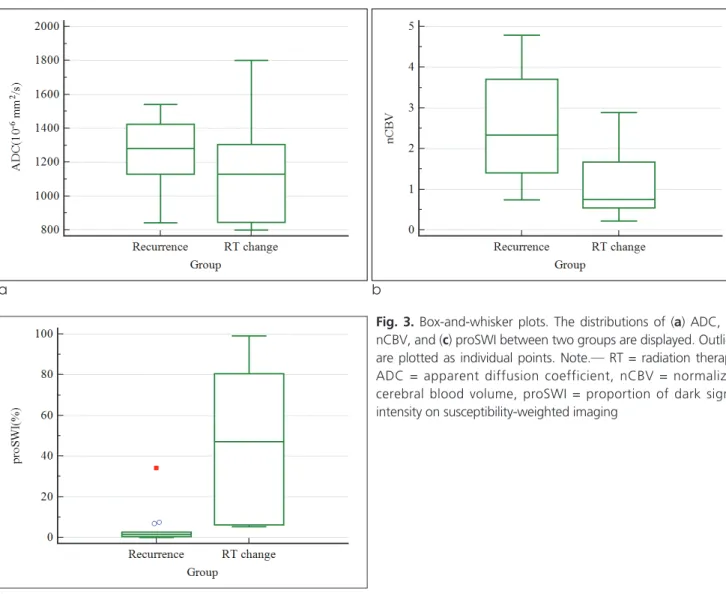
The mean nCBV value was higher in the true recurrence group than in the RT-related change group, and the difference was statistically significant (2.64 vs.
1.06; P = .004). The RT-related change group showed a higher mean proSWI than the recurrence group (43.92 vs. 4.37; P < .001). There was no significant difference in the mean ADC values between the two groups (P = .419); rather, there was a tendency toward a slightly lower ADC value in the RT-related change group (1270 × 10-6mm2/s and 1179 × 10-6mm2/s in the true recurrence and RT-related change group, respec- tively) (Table 2).
Results of multivariable stepwise logistic regression analysis showed that the proSWI was the only variable that could be used to differentiate independently the true recurrence from RT-related changes (P = .001). In ROC analysis using the mean proSWI, the cutoff value
that provided a balance between sensitivity and specificity for the diagnosis of true recurrence from RT- related changes was 2.64%. True recurrences were diagnosed for newly appearing enhancing lesions inside the radiation field more than one year after the comple- tion of RT, measuring less than the proSWI of 2.64%, and the sensitivity, specificity, and accuracy were 78.6%
(11 of 14), 100% (10 of 10), and 87.5% (21 of 24), respectively; a proSWI value less than the threshold was more frequently observed in the true recurrence group than in the RT-related change group (P < .0001). With the LOOCV test, the accuracy of proSWI in predicting true recurrence was 79.2% (19/24).
Fig. 3 demonstrates the distributions of variables as box-and-whisker plot. Figs. 4 and 5 show representa- tive MR images from the true recurrence and RT- related change groups, respectively.
a b
c
Fig. 3. Box-and-whisker plots. The distributions of (a) ADC, (b) nCBV, and (c) proSWI between two groups are displayed. Outliers are plotted as individual points. Note.─ RT = radiation therapy, ADC = apparent diffusion coefficient, nCBV = normalized cerebral blood volume, proSWI = proportion of dark signal intensity on susceptibility-weighted imaging
In this study, we compared the diagnostic value of three different MRI parameters for the differentiation of newly appearing enhancing lesions in patients who had RT for their primary brain tumors. We found
nCBV to be significantly higher and proSWI to be significantly lower within contrast-enhanced regions of true recurrence compared with these parameters in patients with RT-related changes. In addition, there was no significant difference in ADC values between the two groups.
It is often difficult to distinguish true recurrence DISCUSSION
a b c
d e f
Fig. 4. True recurrence. A 57-year-old woman who underwent gross total resection and concomitant chemoradiotherapy (CCRT) with temozolomide for glioblastoma in the left parietal lobe.
(a) Contrast-enhanced T1-weighted (CET1) magnetic resonance (MR) image obtained 11 months after CCRT completion shows no abnormal enhancing lesion in the left parietal surgical bed. (b) 4 months follow-up CET1 MR image demonstrates newly developed enhancing lesion (arrow) in the left parietal tumor resection site. (c) Serial follow-up MR image obtained one month later shows an increase in the enhancement extent (arrow). (d) The mean apparent diffusion coefficient (ADC) value of the enhancing lesion from ADC map was 1130 × 10-6 mm2/s (b = 1000 sec/mm2) (arrow). (e) Relative cerebral blood volume (CBV) map from dynamic susceptibility contrast perfusion-weighted imaging shows increased blood flow in the corresponding enhancing lesion (normalized relative CBV = 3.7). (f) Susceptibility-weighted imaging demonstrates nearly no dark spot in the enhancing lesion, and the proportion of dark signal intensity was 0.44%.
from RT-related changes, and there have been many efforts in attempts to distinguish them from each other (11-15). In particular, if an enhancing lesion is newly noted more than several months after the completion of RT, it is challenging for both radiologists and clinicians, who must decide on the appropriate further
treatment plan for their patients. This difficulty is why we recruited patients whose post-RT periods were more than one year.
The role of perfusion MRI in distinguishing recurrent tumors from treatment-related changes has been studied extensively. DSC PWI estimates tissue
a b c
d e f
Fig. 5. Radiation therapy (RT)-related change. A 44-year-old woman who underwent gross total resection and concomitant chemoradiotherapy (CCRT) for anaplastic oligoastrocytoma in bilateral frontal lobes.
(a) Contrast-enhanced T1-weighted (CET1) magnetic resonance (MR) image obtained 15 months after CCRT completion shows postoperative surgical bed enhancements (arrows) in the bilateral frontal areas without evidence of tumor recurrence. 90 months after CCRT follow-up (b) precontrast T1-weighted image and (c) CET1 image demonstrate a newly noted large hemorrhagic mass (arrow), with peripheral enhancement in the right frontal lobe. After the surgical resection, pathology revealed this lesion to be an RT-related change. (d) The mean apparent diffusion coefficient (ADC) value of the enhancing lesion from ADC map was 1230 × 10-6mm2/s (b = 1000 sec/mm2) (arrow). (e) Relative cerebral blood volume map (CBV) from dynamic susceptibility contrast perfusion-weighted imaging shows nearly an absence of blood flow (arrow) in the corresponding enhancing area (normalized relative CBV = 0.3). (f) Susceptibility-weighted imaging demonstrates significant dark spots in the inner hemorrhage (asterisk) and peripheral enhancing portion (arrowheads) of the mass; the calculated proportion of dark signal intensity (proSWI) was 80.53%.
microvascular density by measuring relative cerebral blood volume (rCBV) (27), and it is believed to have the potential to differentiate tumor growth from treatment-related changes, because the blood volume in tumor recurrence increases as a result of neocapil- lary formation and the dilatation of existing vasculature (28). Recent studies have supported this phenomenon;
Barajas et al. (29) found the mean and maximum rCBV to be significantly higher in the recurrent metastatic tumor group than in the radiation necrosis group, and Hu et al. (30) proposed a threshold nCBV value of 0.71 for the optimized differentiation of predominant tumor progression from treatment-related changes with sensitivity of 91.7% and specificity of 100%. Gasparetto et al. (31) also reported that calcula- tion of the nCBV profile was useful for the objective evaluation of recurrence vs. treatment-related changes, with accuracy of 97% for differentiating recurrent contrast-enhanced lesions with more than 20%
malignant histologic features from lesions with 20% or less malignant histologic features.
Our results are consistent with those of previous studies, which have suggested that tumor recurrences have higher nCBV values than treatment-related changes, although we included various primary brain tumors in our study group. However, in the multivari- ate logistic regression analysis, the proSWI was the only significant variable. The difference of the proSWI between two groups was considerable enough to make no significant statistical difference of the nCBV in multivariate analysis (Fig. 3).
DWI allows for the evaluation of the rate of microscopic diffusion of free water molecules within tissues. Increased cellularity in tumor recurrence causes the tumor cells to be densely packed, which can inhibit the effective motion of water molecules, thereby producing restricted diffusion, which is manifested as increased signal intensity on DWI and reduced signal intensity on the corresponding ADC images (32-34). Several studies have shown recurrent tumors to have lower ADC values than radiation necrosis. Asao et al. (12) found that the maximal ADC values were significantly smaller for the recurrence group than for the necrosis group, but there was no statistically significant difference in the mean ADC values. According to another retrospective study by Hein et al (11), the ADC ratio, which represents the
mean ADC value of the enhancing region divided by that of the contralateral hemisphere, in the tumor recurrence group was significantly lower than that in the non-recurrence group, and Matsusue et al. (35) supported this finding. However, the result in our study was not consistent with those of the previous studies. The mean ADC values of the true recurrence and RT-related change groups showed no significant difference with a tendency toward being slightly lower in the RT-related changes group. A few cases of radiation necrosis with increased signal intensity on DWI and low ADC values have been reported in earlier studies (36-38). The authors have suggested that this low ADC was caused by the development of intracellular edema in the viable tumor cells during the transition to complete necrosis with liquefaction.
Additionally, the low ADC values in radiation necrosis might reflect abundant polymorphonuclear leukocytes, as in purulent fluid, because the high viscosity and inflammatory cellular composition could restrict water diffusion. Another possible explanation is a hemorrhage in the radiation necrosis. Histopathologi- cal analysis of radiation necrosis frequently includes blood products (12, 39). We can assume that the hemorrhagic component might lower the ADC values of RT-related changes (40), which is supported by the higher proSWI in RT-related changes.
There have been a few reports about the detection with MR imaging of hemorrhage in radiation-injured regions of the brain (25, 41, 42). Chan et al. (4) reported hemosiderin deposition in late radiation injury of the temporal lobes, using gradient-recalled echo (GRE). With this sequence, hypointense foci were detected in 53% (30/57) of the radiation-injured regions. As in our study, Zeng et al. (42) described with SWI hemorrhagic hypointense foci in the previously irradiated brain regions in glioma patients, and they measured the number of foci for the quanti- tative study. Intralesional hypointense foci were detected in 12 of 15 cases (12/15, 80%). These hemorrhages were believed to be associated with radiation-induced vasculopathy - either a primary change in the vessel walls, such as acute fibrinoid necrosis, or capillary telangiectasia, which manifests as ectatic, thin-walled vessels surrounded by hemosiderin and gliosis (41, 43-45).
SWI is well known for its great sensitivity to
hemorrhage, and to our knowledge, its feasibility in differentiating tumor recurrence from RT-related changes has not been described or reported elsewhere in previous studies. We found that the proSWI from the calculation of SWI quantitative data was the most promising parameter for differentiating the tumor recurrence from delayed RT-related changes. With ROC analysis, the sensitivity, specificity, and accuracy for the detection of tumor recurrence with the proSWI were 78.6% (11 of 14), 100% (10 of 10), and 87.5%
(21 of 24), respectively. Regardless of the pathologic types of primary brain tumors, RT-related change lesions showed significantly larger amount of hemorrhagic foci on SWI, compared to tumor recurrence and the most powerful method for the detection of hemorrhage was SWI. The results of our study on SWI are consistent with those of previous studies that we mentioned above. Unlike other parameters, such as nCBV or ADC values, in our study, SWI can be visually assessed by intuition. This advantage can help not only the neuroradiologists, but also the physicians to recognize and interpret MR lesions by themselves in the clinic.
Previous comparative studies regarding post-RT changes vs. tumor recurrences have usually not set the post-irradiation time criteria for their patient recruit- ments, or the time has varied, ranging from 6 to 120 months (12), 3 to 254 months (35) or 3 to 109 months (31). We recruited our study population, and the subjects’ post-irradiation time was at least one year, which we believe is one of the clinical settings that can confuse the differential diagnosis of the newly appear- ing enhancing lesions.
In addition to the intrinsic limitations of any retrospective study, there were some noteworthy limitations of our study. First, this study included a small number of patients. However, the two groups from our study population were statistically well balanced in terms of patient numbers, sex ratio, radiation dose, and post-irradiation time (Table 1). We were able to determine the most powerful predictor for differentiation among three parameters with this small number of patients. We postulate that further study with more patients might strengthen our findings.
Second, we recruited our study population of heteroge- neous primary brain tumors. Third, we used two 3 T MR imaging scanners from different companies, of
which the scan parameters were slightly different.
However, we made every effort to optimize the sequences to decrease the image quality differences between the two scanners. We believe that there might have been slight bias in terms of ADC map image analysis; the true recurrence and RT-related change groups equally underwent MR imaging with the two scanners. Fourth, there was a lack of histologic confir- mation in some cases in our study. Only 13 of 24 patients had histologic confirmation after surgery.
Although histologic confirmation in all patients might be desirable, it is not always clinically available. In an approach similar to that of other published studies (7, 12, 35), we used the clinical course and follow-up imaging studies as a surrogate indicators of histology.
In conclusion, we found that the true recurrence group showed higher nCBV values and significantly lower proSWI values than the RT-related change group. The results of our study suggest that the proSWI is the most promising parameter for the differ- entiation of the newly developed enhancing lesions more than one year after RT completion in primary brain tumor patients. With SWI, we can make earlier decisions for newly enhancing lesions after brain RT and provide the suitable treatment plans to related clinicians, thus improving patients’ overall prognoses and quality of life.
References
1. Wang YX, King AD, Zhou H, et al. Evolution of radiation- induced brain injury: MR imaging-based study. Radiology 2010;254:210-218
2. Mullins ME, Barest GD, Schaefer PW, Hochberg FH, Gonzalez RG, Lev MH. Radiation necrosis versus glioma recurrence:
conventional MR imaging clues to diagnosis. AJNR Am J Neuroradiol 2005;26:1967-1972
3. Kim HS, Kim JH, Kim SH, Cho KG, Kim SY. Posttreatment high-grade glioma: usefulness of peak height position with semiquantitative MR perfusion histogram analysis in an entire contrast-enhanced lesion for predicting volume fraction of recurrence. Radiology 2010;256: 906-915
4. Chan YL, Leung SF, King AD, Choi PH, Metreweli C. Late radiation injury to the temporal lobes: morphologic evaluation at MR imaging. Radiology 1999;213:800-807
5. Valk PE, Dillon WP. Radiation injury of the brain. AJNR Am J Neuroradiol 1991;12:45-62
6. Dooms GC, Hecht S, Brant-Zawadzki M, Berthiaume Y, Norman D, Newton TH. Brain radiation lesions: MR imaging.
Radiology 1986;158:149-155
7. Curran WJ, Hecht-Leavitt C, Schut L, Zimmerman RA, Nelson
DF. Magnetic resonance imaging of cranial radiation lesions. Int J Radiat Oncol Biol Phys 1987;13:1093-1098
8. Kim YH, Oh SW, Lim YJ, et al. Differentiating radiation necrosis from tumor recurrence in highgrade gliomas: assessing the efficacy of 18F-FDG PET, 11C-methionine PET and perfusion MRI. Clin Neurol Neurosurg 2010;112:758-765 9. Castillo M, Smith JK, Kwock L, Wilber K. Apparent diffusion
coefficients in the evaluation of high-grade gliomas. AJNR Am J Neuroradiol 2001;22:60-64
10. Sugahara T, Korogi Y, Kochi M, et al. Usefulness of diffusion weighted MRI with echo-planar technique in the evaluation of cellularity in gliomas. J Magn Reson Imaging 1999;9:53-60 11. Hein PA, Eskey CJ, Dunn JF, Hug EB. Diffusion-weighted
imaging in the follow-up of treated high-grade gliomas: tumor recurrence versus radiation injury. AJNR Am J Neuroradiol 2004;25:201-209
12. Asao C, Korogi Y, Kitajima M, et al. Diffusion-weighted imaging of radiation-induced brain injury for differentiation from tumor recurrence. AJNR Am J Neuroradiol 2005;26:1455-1460 13. Larsen VA, Simonsen HJ, Law I, Larsson HB, Hansen AE.
Evaluation of dynamic contrast-enhanced T1-weighted perfusion MRI in the differentiation of tumor recurrence from radiation necrosis. Neuroradiology 2013;55:361-369
14. Sugahara T, Korogi Y, Tomiguchi S, et al. Posttherapeutic intraaxial brain tumor: the value of perfusion-sensitive contrast- enhanced MR imaging for differentiating tumor recurrence from nonneoplastic contrast-enhancing tissue. AJNR Am J Neuroradiol 2000;21:901-909
15. Covarrubias DJ, Rosen BR, Lev MH. Dynamic magnetic resonance perfusion imaging of brain tumors. Oncologist 2004;9:528-537
16. Thomas B, Somasundaram S, Thamburaj K, et al. Clinical applications of susceptibility weighted MR imaging of the brain - a pictorial review. Neuroradiology 2008;50:105-116
17. Crossen JR, Garwood D, Glatstein E, Neuwelt EA.
Neurobehavioral sequelae of cranial irradiation in adults: a review of radiation-induced encephalopathy. J Clin Oncol 1994;12:627-642
18. Giglio P, Gilbert MR. Cerebral radiation necrosis. Neurologist 2003;9:180-188
19. Heckl S, Aschoff A, Kunze S. Radiation-induced cavernous hemangiomas of the brain: a late effect predominantly in children. Cancer 2002;94:3285-3291
20. Burn S, Gunny R, Phipps K, Gaze M, Hayward R. Incidence of cavernoma development in children after radiotherapy for brain tumors. J Neurosurg 2007;106:379-383
21. Sheline GE. Radiation therapy of brain tumors. Cancer 1977;39:873-881
22. Rosen BR, Belliveau JW, Vevea JM, Brady TJ. Perfusion imaging with NMR contrast agents. Magn Reson Med 1990;14:249-265
23. Ostergaard L, Weisskoff RM, Chesler DA, Gyldensted C, Rosen BR. High resolution measurement of cerebral blood flow using intravascular tracer bolus passages. Part I: mathematical approach and statistical analysis. Magn Reson Med 1996;36:715-725
24. Boxerman JL, Schmainda KM, Weisskoff RM. Relative cerebral blood volume maps corrected for contrast agent extravasation significantly correlate with glioma tumor grade, whereas uncorrected maps do not. AJNR Am J Neuroradiol
2006;27:859-867
25. Wetzel SG, Cha S, Johnson G, et al. Relative cerebral blood volume measurements in intracranial mass lesions: interobserver and intraobserver reproducibility study. Radiology 2002;224:
797-803
26. Hauck WW, Miike R. A proposal for examining and reporting stepwise regressions. Stat Med 1991;10:711-715
27. Rosen BR, Belliveau JW, Vevea JM, Brady TJ. Perfusion imaging with NMR contrast agents. Magn Reson Med 1990;14:
249-265
28. Hoefnagels FW, Lagerwaard FJ, Sanchez E, et al. Radiological progression of cerebral metastases after radiosurgery: assess- ment of perfusion MRI for differentiating between necrosis and recurrence. J Neurol 2009;256:878-887
29. Barajas RF, Chang JS, Sneed PK, Segal MR, McDermott MW, Cha S. Distinguishing recurrent intra-axial metastatic tumor from radiation necrosis following gamma knife radiosurgery using dynamic susceptibility-weighted contrast-enhanced perfusion MR imaging. AJNR Am J Neuroradiol 2009;30:367- 372
30. Hu LS, Baxter LC, Smith KA, et al. Relative cerebral blood volume values to differentiate high-grade glioma recurrence from posttreatment radiation effect: direct correlation between image-guided tissue histopathology and localized dynamic susceptibility-weighted contrast-enhanced perfusion MR imaging measurements. AJNR Am J Neuroradiol 2009;30:552-558 31. Gasparetto EL, Pawlak MA, Patel SH, et al. Posttreatment
recurrence of malignant brain neoplasm: accuracy of relative cerebral blood volume fraction in discriminating low from high malignant histologic volume fraction. Radiology 2009;250:887- 896
32. Stadnik TW, Chaskis C, Michotte A, et al. Diffusion-weighted MR imaging of intracerebral masses: comparison with conven- tional MR imaging and histologic findings. AJNR Am J Neuroradiol 2001;22:969-976.
33. Schaefer PW, Ozsunar Y, He J, et al. Assessing tissue viability with MR diffusion and perfusion imaging. AJNR Am J Neuroradiol 2003;24:436-443
34. Guo AC, Cummings TJ, Dash RC, Provenzale JM. Lymphomas and high-grade astrocytomas: comparison of water diffusibility and histologic characteristics. Radiology 2002;224:177-183 35. Matsusue E, Fink JR, Rockhill JK, Ogawa T, Maravilla KR.
Distinction between glioma progression and post-radiation change by combined physiologic MRimaging. Neuroradiology 2010;52:297-306
36. Tung GA, Evangelista P, Rogg JM, Duncan JA. Diffusion- weighted MR imaging of rim-enhancing brain masses: is markedly decreased water diffusion specific for brain abscess?
AJR Am J Roentgenol 2001;177:709-712
37. Holtas S, Geijer B, Stromblad LG, Mary-Sundgren P, Burtscher IM. A ring-enhancing metastasis with central high signal on diffusion-weighted Imaging and low apparent diffusion coeffi- cients. Neuroradiology 2000;42:824-827
38. Biousse V, Newman NJ, Hunter SB, Hudgins PA. Diffusion weighted imaging in radiation necrosis. J Neurol Neurosurg Psychiatry 2003;74:382-384
39. Burger PC, Boyko OB. The pathology of central nervous system radiation injury. In Gutin PH, Leibel SA, Sheline GE, eds.
Radiation Injury to the Central Nervous System. New York, NY: Raven, 1991: 191-208
40. Silvera S, Oppenheim C, Touze′E, et al. Spontaneous intracere- bral hematoma on diffusion-weighted images: influence of T2- shine-through and T2-blackout effects. AJNR Am J Neuroradiol 2005;26:236-241
41. Gaensler EH, Dillon WP, Edwards MS, Larson DA, Rosenau W, Wilson CB. Radiation-induced telangiectasia in the brain simulates cryptic vascular malformations at MR imaging.
Radiology 1994;193:629-636
42. Zeng QS, Kang XS, Li CF, Zhou GY. Detection of hemorrhagic hypointense foci in radiation injury region using susceptibility- weighted imaging. Acta Radiol 2011;52:115-119
43. Poussaint TY, Siffert J, Barnes PD, et al. Hemorrhagic
vasculopathy after treatment of central nervous system neopla- sia in childhood: diagnosis and follow-up. AJNR Am J Neuroradiol 1995;16:693-699
44. Llena JF, Cespedes G, Hirano A, Zimmerman HM, Feiring EH, Fine D. Vascular alterations in delayed radiation necrosis of the brain. An electron microscopical study. Arch Pathol Lab Med 1976;100:531-534
45. Okeda R, Shibata T. Radiation encephalopathy: an autopsy case and some comments on the pathogenesis of delayed radionecro- sis of the central nervous system. Acta Pathol Jpn 1973;23:867- 883
통신저자 : 최승홍, (110-744) 서울시 종로구 연건동 28, 서울대학교 의과대학 서울대학교병원 영상의학과 Tel. (02) 2072-2861 Fax. (02) 743-6385 E-mail: [email protected]
확산강조영상, 역동적조영관류영상, 자화율강조영상을 이용한 원발성 뇌종양환자에서의 종양재발과 지연성 방사선치료연관변화의 감별
1서울대학교 의과대학 서울대학교병원 영상의학과
2서울대학교 화학생물공학부 기초과학연구원 나노입자연구소
3서울대학교 의과대학 서울대학교병원 내과
4서울대학교 의과대학 서울대학교병원 신경외과
5서울대학교 의과대학 서울대학교병원 병리과
6서울대학교 의과대학 서울대학교병원 방사선종양학과
김동현1∙최승홍1, 2∙유인선1∙윤태진1∙김태민3∙이세훈3∙박철기4 김지훈1∙손철호1∙박성혜5∙김일한6
목적: 원발성 뇌종양환자에서 방사선 치료 후 추적 자기공명영상에서 새로 생긴 조영증강 뇌병변에 대해 종양재발과 지연성 방사선치료연관변화의 감별에 있어서 확산강조영상 (DWI), 역동적조영관류영상 (DSC PWI), 자화율강조영 상 (SWI)의 진단적 가치를 서로 비교하고자 한다.
대상과 방법: 원발성 뇌종양으로 이전에 방사선치료를 받았던 환자 중, 방사선치료 종료 최소 1년 이후에 추적 자기 공명영상에서 새롭게 조영증강 되는 병변을 가진 24명의 환자를 대상으로 연구하였다. 새롭게 조영증강 되는 병변은 14명의 종양재발과 10명의 방사선치료연관변화로 확인되었다. 종양재발과 방사선치료연관변화 두 환자 군의 여러 변수들은 비대응표본 t 검정을 실시하여 비교 분석하였다. 다중변수 로지스틱 회귀 분석을 이용하여 DWI, DSC PWI, SWI 각 영상의 정량 분석을 통해 얻은 apparent diffusion coefficient (ADC), normalized cerebral blood volume (nCBV), proportion of dark signal intensity (proSWI) 값 중 두 군을 감별해 내는 최상의 예 측 변수 (best predictor)를 정하였다. 이후 수신자 조작 특성 (Receiver operating characteristics, ROC) 분 석을 통하여 best predictor의 정확도, 민감도, 특이도를 평가하였다.
결과: 방사선치료연관변화 군과 비교하여 종양재발 군에서 평균 nCBV 값이 유의하게 높았고 (P=.004), 평균 proSWI 값은 유의하게 낮았다 (P<.001). 반면, 평균 ADC 값은 두 군간에 유의한 차이를 보이지 않았다. 다중변수 로지스틱 회귀 분석 결과 proSWI 값만이 통계적으로 유의한, 감별 가능한 독립변수였으며, 민감도, 특이도, 정확도 는 각각 78.6% (11 of 14), 100% (10 of 10), 87.5% (21 of 24) 였다.
결론: 뇌종양 환자에서 방사선치료 종료 최소 1년 이후에 새로 보이는 조영증강 병변의 감별에 있어 proSWI 값이 가 장 중요한 변수인 것으로 나타났다.
대한자기공명의과학회지 18:120-132(2014)