Intra-Rater and Inter-Rater Reliability of Brain Surface Intensity Model
(BSIM)-Based Cortical Thickness Analysis Using 3T MRI
This is an Open Access article distributed under the terms of the Creative Commons Attribution Non-Commercial License (http://creativecommons.org/licenses/
by-nc/3.0/) which permits unrestricted non-commercial use, distribution, and reproduction in any medium, provided the original work is properly cited.
Received: August 25, 2015 Revised: September 22, 2015 Accepted: September 24, 2015 Correspondence to:
Won-Jin Moon, M.D., Ph.D.
Department of Radiology, Konkuk University Medical Center, 120-1, Neungdong-ro, Gwangjin- gu, Seoul 143-729, Korea.
Tel. +82-2-2030-5544 Fax. +82-2-2030-5549 Email: [email protected] or [email protected]
Copyright © 2015 Korean Society of Magnetic Resonance in Medicine (KSMRM)
Original Article
Purpose: Brain surface intensity model (BSIM)-based cortical thickness analysis does not require complicated 3D segmentation of brain gray/white matters. Instead, this technique uses the local intensity profile to compute cortical thickness. The aim of the present study was to evaluate intra-rater and inter-rater reliability of BSIM- based cortical thickness analysis using images from elderly participants.Materials and Methods: Fifteen healthy elderly participants (ages, 55-84 years) were included in this study. High-resolution 3D T1-spoiled gradient recalled-echo (SPGR) images were obtained using 3T MRI. BSIM-based processing steps included an inhomogeneity correction, intensity normalization, skull stripping, atlas registration, extraction of intensity profiles, and calculation of cortical thickness. Processing steps were automatic, with the exception of semiautomatic skull stripping. Individual cortical thicknesses were compared to a database indicating mean cortical thickness of healthy adults, in order to produce Z-score thinning maps. Intra-class correlation coefficients (ICCs) were calculated in order to evaluate inter-rater and intra-rater reliabilities.
Results: ICCs for intra-rater reliability were excellent, ranging from 0.751-0.940 in brain regions except the right occipital, left anterior cingulate, and left and right cerebellum (ICCs = 0.65-0.741). Although ICCs for inter-rater reliability were fair to excellent in most regions, poor inter-rater correlations were observed for the cingulate and occipital regions. Processing time, including manual skull stripping, was 17.07 ± 3.43 min. Z-score maps for all participants indicated that cortical thicknesses were not significantly different from those in the comparison databases of healthy adults.
Conclusion: BSIM-based cortical thickness measurements provide acceptable intra- rater and inter-rater reliability. We therefore suggest BSIM-based cortical thickness analysis as an adjunct clinical tool to detect cortical atrophy.
Keywords: Volumetry; Cortical thickness; Magnetic resonance (MR); Alzheimer’s disease (AD)
Ji Young Jeon1,2, Won-Jin Moon1, Yeon-Sil Moon3, Seol-Heui Han3
1Department of Radiology, Konkuk University School of Medicine, Seoul, Korea
2Department of Radiology, Asan Medical Center, Seoul, Korea
3Department of Neurology, Konkuk University School of Medicine, Seoul, Korea
INTRODUCTION
An aging global population has resulted in increased prevalence of neurodegenerative diseases, including dementia. The most common form of dementia is Alzheimer’s disease (AD), followed by vascular dementia, Lewy body dementia, Parkinson’s disease dementia, frontotemporal lobar degeneration, and other dementias (1). Regardless of the differing pathology and underlying proteinopathies, most neurodegenerative dementias result in progressive neuronal cell loss, which is strongly correlated with cognitive decline. Therefore, numerous approaches have been developed to detect decreases in cortical volume and increased cortical atrophy, including manual segmentation (2, 3), voxel-based morphometry (4) and cortical thickness analyses (5, 6). Using the Freesurfer software, developed by Fischl et al. (7), has become the most widely used approach for measuring cortical thickness in various brain regions. Freesurfer does not have a cost for use and is compatible with most hardware and software platforms. However, because it was originally developed for research purposes, Freesurfer does require a high performance computer workstation and has long processing durations (8).
Recently, Lin et al. (8) introduced a new method of cortical thickness analysis, which they termed the brain surface intensity model (BSIM). The BSIM extracts a one- dimensional intensity profile perpendicular to the gray matter iso-intensity layer (GMIIL) at each surface point.
Cortical thickness is then calculated at each surface point using the surface intensity model fit (8). Unlike Freesurfer, the BSIM-based method does not segment gray matter from white matter, but instead computes cortical thickness using the local intensity profile. This model of fit reduces the effects of partial volume and image noise, thereby achieving sub-millimeter resolution (8, 9).
With BSIM, however, use of deformed brain mesh and subsequent semi-automatic skull stripping increases susceptibility to measurement variability (8). In addition, BSIM-based cortical thickness measurements have only been tested using the Alzheimer’s Disease Neuroimaging Initiative (ADNI) and Australian Imaging Biomarkers and Lifestyle Study of Ageing (AIBL) databases, which contain 1.5T images. This method has not previously been evaluated in an elderly Asian population using 3T images. There are ethnic differences in brain morphology (10, 11) and cortical thickness, so use of BSIM-based cortical thickness measurements in other populations must be evaluated (12).
We aimed to evaluate intra-rater and inter-rater reliability of BSIM-based cortical thickness analysis, for use of adjunct clinical tool to detect cortical atrophy, in cognitively healthy elderly Asian participants. In addition, we compared cortical thickness measurements from our participants to findings of previous research.
MATERIALS AND METHODS
ParticipantsThis retrospective study enrolled 15 healthy elderly participants between 55 and 84 years of age (M:F = 5:10;
mean, 73.9 ± 8.2 years), recruited from patients referred for the MR imaging protocol using 3D T1-volumetric imaging.
Referrals resulted from routine medical exams between June 2006 and August 2010 at our university-affiliated hospital.
Participants were included if they showed no clinical evidence of neuropsychiatric disorders and no apparent abnormal findings on the MR study. We excluded patients with a history of neurological disease, malignancy, stroke, or brain surgery. Indications for MRI included headaches (n
= 1), dizziness or vertigo (n = 2), and health screening (n = 12). Mini-mental status examination (MMSE) score for the subjects was 26.3 ± 3.78.
Our Institutional Review Board approved the study, and written informed consent was waived.
MR Imaging Protocol
All participants underwent MR imaging using a 3T unit (Signa HDx, GE Healthcare, Milwaukee, WI, USA) with an 8-channel head coil. The routine MR imaging protocol included the following sequences: 1) axial and sagittal T1- weighted inversion-recovery (repetition time [TR]/ echo time [TE]/ inversion time [TI], 2468/12/920 ms; section thickness, 5 mm; matrix, 512 × 224); 2) axial T2-weighted fast spin- echo (FSE) (TR/effective TE, 4000/106 ms; section thickness, 5 mm; matrix, 384 × 384); 3) axial fluid-attenuated inversion-recovery (TR/TE/TI, 11,000/105/2600 ms; section thickness, 5 mm; matrix 384 × 224); 4) axial T2-weighted gradient-echo (GRE) (TR/TE, 550/17 ms; section thickness, 5 mm; matrix, 384 × 224; flip angle, 15°); and 5) T1-weighted volumetric spoiled gradient recalled-echo (SPGR) (TR/TE, 7.3/2.7 ms; section thickness, 1.5 mm; matrix, 256 × 256;
flip angle, 13°). The field of view was 230 × 230 mm.
MR Imaging Analyses
One neuroradiologist with 12 years of experience in
neuroimaging, 1 general radiologist (1 year experience in neuroimaging), and 1 radiology technician with 5 years of experience in brain MR imaging independently performed the analyses. Training sessions were conducted for the BSIM-based cortical thickness analysis, for a total of 12 h (3 h each day for 4 d) per rater. In order to evaluate intra-rater variability, 1 rater (rater 1) repeated all analyses 1 month following the initial measurements.
BSIM-based cortical thickness analyses were performed using CorThick software (GE Healthcare) on an AW workstation (GE Healthcare). Corrections for inhomogeneity and intensity normalization were first performed. Next, semi-automatic skull stripping was performed; Brain mesh from 10,242 vertices inside the brain was automatically deformed to the brain edge in order to segment brain tissue from non-brain tissue. Then, some remaining non- brain tissue within the brain mesh was manually deleted (8). Skull stripped brains were registered to a Talairach atlas and 15,964 brain surface reference points were defined
around the brain surface. A direction perpendicular to the gray matter iso-intensity layer was calculated from each point and MR intensities along the direction were sampled to create MR intensity profiles across the brain surface.
This local intensity profile was then fitted using the BSIM to determine the boundary between cerebral spinal fluid and gray matter, and the boundary between gray and white matters. Cortical thickness was then defined as the distance between these two points, without segmentation. Cortical thicknesses calculated at 15,964 points were color coded, and superimposed on individual brain surfaces (8, 9).
Cortical thickness was measured in the following 12 brain regions using pre-defined regional templates that were already implemented within the CorThick software:
the parietal, temporal, frontal, occipital, posterior cingulate, anterior cingulate, medial frontal, medial parietal, somatomotor, visual, cerebellum, and “other” regions. The
“other” region was comprised of the remaining cortex aside from the 11 functional regions. Individual cortical
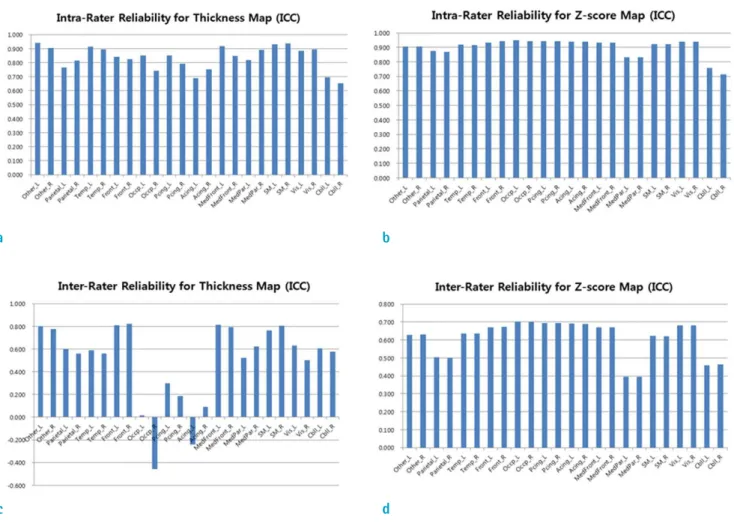
Fig. 1. Comparison of intra- and inter-rater reliability for cortical thickness and Z-scores in different brain regions.
c d
a b
thicknesses were compared to mean cortical thicknesses from the normative databases within the CorThick software to compute the Z-score thinning maps. Twenty-nine cognitively healthy participants between 70 and 80 years of age were included in computations of the mean and standard deviations of cortical thickness that were used as a normative database of the CorThick software to calculate the individual Z-score values (8).
The duration of processing time required to measure cortical thickness was recorded only for rater 1 and rater 2, for each participant. The duration of processing time was not able to be evaluated for rater 3 due to lack of the data.
Statistical Analyses
Statistical analyses were performed using the Statistical Package for the Social Sciences (Version 17.0 for Windows;
SPSS, Chicago, IL, USA) and MedCalc (Version 15.2.2, Mariakerke, Belgium). Values were considered statistically significant when P < 0.05. The intra-class correlation coefficient (ICC) was calculated in order to determine intra-rater (mixed-effect model) and inter-rater reliability (random-effect model) for regional cortical thickness measurements (13, 14). Fleiss (15) and Cicchetti et al. (16), have recommended for the interpretation of ICC values as following: ICC > 0.75 represents excellent reliability; 0.60- 0.74, good reliability; 0.41-0.59, fair reliability; < 0.40, poor
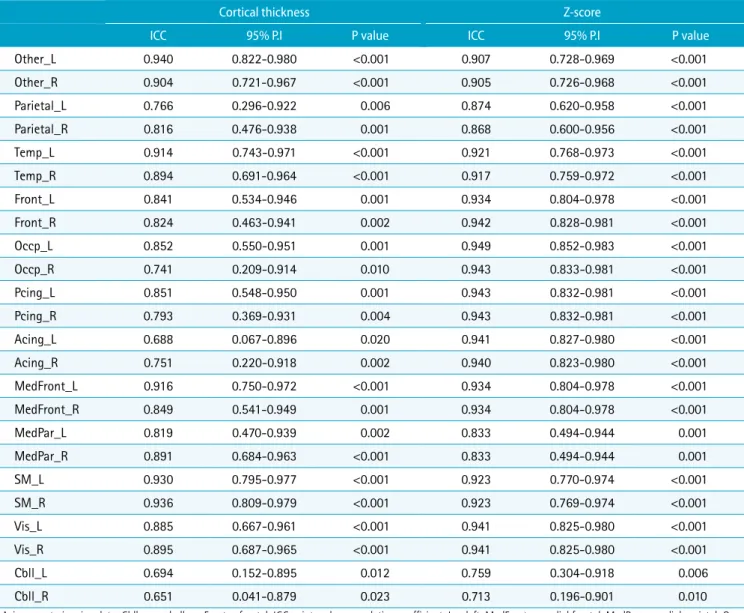
Table 1. Intra-Rater Reliability for Cortical Thickness Measurements (rater 1)
Cortical thickness Z-score
ICC 95% P.I P value ICC 95% P.I P value
Other_L 0.940 0.822-0.980 <0.001 0.907 0.728-0.969 <0.001
Other_R 0.904 0.721-0.967 <0.001 0.905 0.726-0.968 <0.001
Parietal_L 0.766 0.296-0.922 0.006 0.874 0.620-0.958 <0.001
Parietal_R 0.816 0.476-0.938 0.001 0.868 0.600-0.956 <0.001
Temp_L 0.914 0.743-0.971 <0.001 0.921 0.768-0.973 <0.001
Temp_R 0.894 0.691-0.964 <0.001 0.917 0.759-0.972 <0.001
Front_L 0.841 0.534-0.946 0.001 0.934 0.804-0.978 <0.001
Front_R 0.824 0.463-0.941 0.002 0.942 0.828-0.981 <0.001
Occp_L 0.852 0.550-0.951 0.001 0.949 0.852-0.983 <0.001
Occp_R 0.741 0.209-0.914 0.010 0.943 0.833-0.981 <0.001
Pcing_L 0.851 0.548-0.950 0.001 0.943 0.832-0.981 <0.001
Pcing_R 0.793 0.369-0.931 0.004 0.943 0.832-0.981 <0.001
Acing_L 0.688 0.067-0.896 0.020 0.941 0.827-0.980 <0.001
Acing_R 0.751 0.220-0.918 0.002 0.940 0.823-0.980 <0.001
MedFront_L 0.916 0.750-0.972 <0.001 0.934 0.804-0.978 <0.001
MedFront_R 0.849 0.541-0.949 0.001 0.934 0.804-0.978 <0.001
MedPar_L 0.819 0.470-0.939 0.002 0.833 0.494-0.944 0.001
MedPar_R 0.891 0.684-0.963 <0.001 0.833 0.494-0.944 0.001
SM_L 0.930 0.795-0.977 <0.001 0.923 0.770-0.974 <0.001
SM_R 0.936 0.809-0.979 <0.001 0.923 0.769-0.974 <0.001
Vis_L 0.885 0.667-0.961 <0.001 0.941 0.825-0.980 <0.001
Vis_R 0.895 0.687-0.965 <0.001 0.941 0.825-0.980 <0.001
Cbll_L 0.694 0.152-0.895 0.012 0.759 0.304-0.918 0.006
Cbll_R 0.651 0.041-0.879 0.023 0.713 0.196-0.901 0.010
Acing = anterior cingulate; Cbll = cerebellum; Front = frontal; ICC = intra-class correlation coefficient; L = left; MedFront = medial frontal; MedPar = medial parietal; Occp
= occipital; Pcing = posterior cingulate; P.I = prediction interval; R = right; SM = sensorimotor; Temp = temporal; Vis = visual
reliability. Mean values of the two measurements of rater 1 were used as the final cortical thickness values for the 12 brain regions. The difference in processing time between rater 1 and rater 2 was evaluated with a paired t-test.
RESULTS
Overall, intra-rater reliability of the cortical thickness measurements was high. Good reliability was observed for measurements from the right occipital, left anterior cingulate, and both cerebellar regions (ICCs = 0.651-0.741), whereas the remaining regions had excellent reliability
(ICCs = 0.751-0.940). The Z-score maps of cortical thickness demonstrated that measurements from all regions except for the right cerebellum (ICC = 0.713) had excellent intra- rater reliability (ICCs = 0.759-0.949) (Table 1).
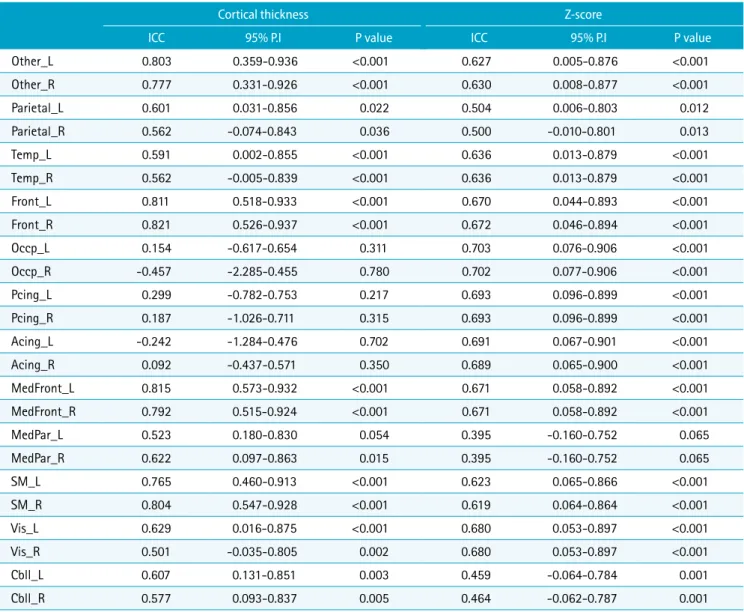
Conversely, inter-rater reliability was not consistent across brain regions, ranging from -0.457-0.815. Measurements from the frontal, medial frontal, sensorimotor, and other regions had excellent reliability (ICCs = 0.765-0.821).
Measurements from the temporal, medial parietal, parietal, visual, and cerebellar regions had fair reliability (ICCs = 0.501-0.629). However, measurements from the anterior cingulate, posterior cingulate, and occipital regions resulted in poor or even negative correlations (ICCs = -0.457-0.299).
Inter-rater agreement of Z-score map values was poor for
Table 2. Inter-Rater Reliability for Cortical Thickness Measurements (raters 1, 2, and 3)
Cortical thickness Z-score
ICC 95% P.I P value ICC 95% P.I P value
Other_L 0.803 0.359-0.936 <0.001 0.627 0.005-0.876 <0.001
Other_R 0.777 0.331-0.926 <0.001 0.630 0.008-0.877 <0.001
Parietal_L 0.601 0.031-0.856 0.022 0.504 0.006-0.803 0.012
Parietal_R 0.562 -0.074-0.843 0.036 0.500 -0.010-0.801 0.013
Temp_L 0.591 0.002-0.855 <0.001 0.636 0.013-0.879 <0.001
Temp_R 0.562 -0.005-0.839 <0.001 0.636 0.013-0.879 <0.001
Front_L 0.811 0.518-0.933 <0.001 0.670 0.044-0.893 <0.001
Front_R 0.821 0.526-0.937 <0.001 0.672 0.046-0.894 <0.001
Occp_L 0.154 -0.617-0.654 0.311 0.703 0.076-0.906 <0.001
Occp_R -0.457 -2.285-0.455 0.780 0.702 0.077-0.906 <0.001
Pcing_L 0.299 -0.782-0.753 0.217 0.693 0.096-0.899 <0.001
Pcing_R 0.187 -1.026-0.711 0.315 0.693 0.096-0.899 <0.001
Acing_L -0.242 -1.284-0.476 0.702 0.691 0.067-0.901 <0.001
Acing_R 0.092 -0.437-0.571 0.350 0.689 0.065-0.900 <0.001
MedFront_L 0.815 0.573-0.932 <0.001 0.671 0.058-0.892 <0.001
MedFront_R 0.792 0.515-0.924 <0.001 0.671 0.058-0.892 <0.001
MedPar_L 0.523 0.180-0.830 0.054 0.395 -0.160-0.752 0.065
MedPar_R 0.622 0.097-0.863 0.015 0.395 -0.160-0.752 0.065
SM_L 0.765 0.460-0.913 <0.001 0.623 0.065-0.866 <0.001
SM_R 0.804 0.547-0.928 <0.001 0.619 0.064-0.864 <0.001
Vis_L 0.629 0.016-0.875 <0.001 0.680 0.053-0.897 <0.001
Vis_R 0.501 -0.035-0.805 0.002 0.680 0.053-0.897 <0.001
Cbll_L 0.607 0.131-0.851 0.003 0.459 -0.064-0.784 0.001
Cbll_R 0.577 0.093-0.837 0.005 0.464 -0.062-0.787 0.001
Acing = anterior cingulate; Cbll = cerebellum; Front = frontal; ICC = intra-class correlation coefficient; L = left; MedFront = medial frontal; MedPar = medial parietal; Occp
= occipital; Pcing = posterior cingulate; P.I = prediction interval; R = right; SM = sensorimotor; Temp = temporal; Vis = visual
the medial parietal region (ICC = 0.395) and fair for the parietal and cerebellar regions (ICCs = 0.459-0.504). All other regions had good reliability (ICCs = 0.619-0.703) (Table 2).
Cortical thickness measurements from all participants ranged from 2.03 ± 0.21 mm in the cerebellum to 2.57 ± 0.24 mm in the posterior cingulate region (Table 3). Z-score maps indicated that cortical thicknesses of participants in our study were not significantly different from those of
participants in the databases, with the exception of the cerebellum (Zs = 1.80-3.21) for all participants, and the temporal region in 1 participant (z = 1.82). The participant with decreased cortical thickness in the temporal lobe was an 80-year-old female.
Processing time duration, including manual skull stripping, was 17.07 ± 3.43 min for rater 1 and 17.73 ± 2.76 min for rater 2. There was no significant difference in processing time (P = 0.403, paired t-test) between raters.
DISCUSSION
We observed good to excellent intra-rater reliability for BSIM-based cortical thickness measurements in all brain regions, and fair to excellent inter-rater reliability in most brain regions, except for the anterior cingulate, posterior cingulate, and occipital regions. We also found that cortical thicknesses of our healthy participants varied from 2.03
± 0.21 mm in the cerebellum to 2.57 ± 0.24 mm in the posterior cingulate.
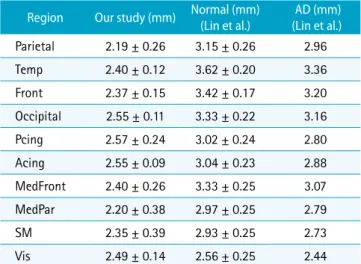
Methods of analyzing cortical thickness vary from manual segmentation to extensive software based measurements using programs such as Freesurfer (7). Gray matter versus white matter histological differences are easily differentiated using MR imaging. Gray matter, which has higher water concentration, yields relatively low signal intensity. White matter, which has lower water concentration and higher Table 3. Comparison of Cortical Thickness Measurements
between the Present Study and the Study of Lin et al. (8) Region Our study (mm) Normal (mm)
(Lin et al.) AD (mm) (Lin et al.)
Parietal 2.19 ± 0.26 3.15 ± 0.26 2.96
Temp 2.40 ± 0.12 3.62 ± 0.20 3.36
Front 2.37 ± 0.15 3.42 ± 0.17 3.20
Occipital 2.55 ± 0.11 3.33 ± 0.22 3.16
Pcing 2.57 ± 0.24 3.02 ± 0.24 2.80
Acing 2.55 ± 0.09 3.04 ± 0.23 2.88
MedFront 2.40 ± 0.26 3.33 ± 0.25 3.07
MedPar 2.20 ± 0.38 2.97 ± 0.25 2.79
SM 2.35 ± 0.39 2.93 ± 0.25 2.73
Vis 2.49 ± 0.14 2.56 ± 0.25 2.44
Acing = anterior cingulate; AD = Alzheimer’s disease; Cbll = cerebellum; Front = frontal; MedFront = medial frontal; MedPar = medial parietal; Pcing = posterior cingulate; SM = sensorimotor; Temp = temporal; Vis = visual
Fig. 2. Scatter plots of cortical thickness measurements using CorThick analysis software. (a) Comparison of 2 sessions by rater 1 (R = 0.817, P < 0.01). (b) Comparison between rater 1 and rater 2 (R = 0.562, P < 0.001). The 3 outliers represent measurements from occipital regions.
a b
myelin concentration, is indicated by relatively high signal intensity on T1-weighted images (17). Regional cortical thinning has been extensively studied using cortical thickness analysis, and is a valuable imaging marker for AD, frontotemporal lobar degeneration, Lewy body disease, and other neurodegenerative diseases (7, 18-24).
Longitudinal evaluation of cortical thinning is a potential tool for treatment response evaluation and for monitoring clinical progression of AD (25, 26). Nevertheless, cortical thickness analysis methods have not been incorporated
into radiological practice, primarily because the research- oriented Freesurfer method is time consuming and may need manual editing despite its fully automatic nature (7, 8).
Therefore, there is an increasing need to develop software for cortical thickness analyses that can be widely used in radiological practice.
ICCs for cortical thickness measurements and Z-score values indicated excellent reliability (0.751 - 0.940) in most brain regions. This is the first study to evaluate the intra- rater and inter-rater reliability of BSIM-based cortical
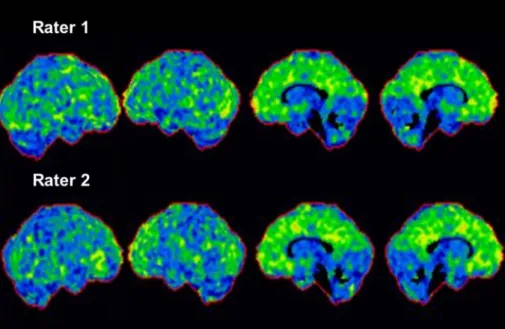
Fig. 3. Cortical thickness map (a) and Z-score map (b) using CorThick analysis software, with comparison between rater 1 and rater 2. Right lateral, left lateral, right medial, and left medial surfaces are shown (left to right).
a
b
thickness analyses. Test-retest reliability of Freesurfer reportedly ranged from 0.77 to 0.81 (27). Freesurfer and other segmentation-based methods require 3D surface measurements obtained by segmentation of gray matter from white matter in order to calculate cortical thicknesses (28). The cortical surface is then reconstructed as vertices on top of the segmented white matter, followed by definition of cortical thickness based on the distance between the white matter surface and the cortical surface (7). Accordingly, small errors in segmentation can lead to large errors in cortical thickness measurements. Factors affecting the segmentation quality include low image resolution, partial volume effects, image noise, image inhomogeneity, and highly convoluted 3D structures (8). In comparison with Freesurfer, BSIM-based cortical thickness analysis does not include volumetric segmentation of brain gray matter, but instead uses the local intensity profile to extract cortical thickness data (8). According to Lin et al. (8), the use of local intensity profiles is less sensitive to image inhomogeneity. The model fit also mitigates partial volume effects and image noise, while providing better resolution (sub-millimeter).
Despite regional variability between the 2 raters, overall inter-rater agreement was fair to excellent. The findings that ICCs ranged from -0.457-0.815 may be due to the semiautomatic skull stripping process or structural issues concerning the meninges. In particular, the anterior cingulate, posterior cingulate, and occipital regions did not have significant inter-rater correlations. Poor correlations for cortical thickness in the occipital region may reflect incomplete skull stripping, as partial removal of the cortex during the skull stripping process may change the intensity profile and result in erroneously decreased cortical thickness measurements. However, the skull stripping process is not a likely cause of the reduced accuracy in measuring cortical thicknesses in the anterior cingulate and posterior cingulate regions. A more plausible explanation is that the midline location of the anterior and posterior cingulate regions, as well as their close proximity to the falx cerebri (thick meninges), may contribute to incorrect local intensity profiles, thereby leading to poor correlations between the 3 raters.
In contrast, the Z-scores for cortical thickness indicated good inter-rater reliability, which is particularly meaningful because the Z-score map indicates no significant differences in cortical thicknesses between our sample and participants in the database samples. Poor inter-rater reliability for the Z-scores in the medial parietal region might also be due
to poor skull stripping in the midline area or due to the overlying falx cerebri. The modest inter-rater reliability of Z-scores in the parietal and cerebellar regions may be due to either poor skull stripping or deformed mesh processing (8).
BSIM-based cortical thickness measurement is acceptable for use in clinical practice because it takes less than 20 min per patient. Compared to use of the research oriented Freesurfer method, BSIM-based cortical thickness measurement enables faster processing. Moreover, the training sessions in our study were only 12 h per rater. Our results demonstrate that BSIM-based cortical thickness analysis can be an efficient alternative tool to Freesurfer for cortical thickness analyses.
Our cortical thickness analyses indicated a thinner cortex compared to data from CorThick software analyses. The age range of our participants was 55-84, which did not differ from the comparison data. The present study indicated thinner cortices in the entire brain, compared to previously published histological data (8), which may have been induced by use of higher strength MR, a different type of T1 volumetric sequence (SPGR instead of magnetization prepared rapid acquisition gradient echo [MPRAGE]) (29, 30), and ethnic or cultural differences in cortical thickness (10-12). Recruitment of participants from our dementia clinic, which is a university-affiliated hospital, may have resulted in selection bias. In the present study, Z-score maps for all participants were within normal ranges, except for 1 participant who had decreased temporal cortical thickness.
However, it is possible that the participant could be in a pre-clinical stage of dementia without clinically detectable symptoms.
As demonstrated by our intra-rater and inter-rater reliability analyses, there were no significant differences between Z-score cortical thickness maps or cortical thickness measurements in most regions when raters were an experienced radiologist, a novice general radiologist, and a radiology technician. Ease of use and acceptable reliability are therefore strengths of the BSIM-based cortical thickness analysis method. Thus, BSIM-based cortical thickness analysis can be a valuable adjunct to clinical diagnosis of dementia because it enables rapid analysis of cortical atrophy.
There were some limitations to our study. First, we studied only 15 healthy aged participants. Second, semi-automatic skull stripping is an inherent constraint on accurate measurements. Differences in the skull stripping process may produce variation in cortical thickness calculations.
However, this variability can be minimized by increased training and continually developing improved skull stripping methods. Finally, we cannot exclude possible effects of the source data quality in some brain regions. Although we used an optimized T1-weighted 3D SPGR sequence, this may not be the optimized sequence for cortical thickness analysis by BSIM. Furthermore, the ADNI study recommended a MPRAGE sequence for their multicenter study, due to segmentation power (29, 30). Specifically, the ADNI study suggested use of inversion recovery-prepared fast SPGR or MPRAGE sequences for assessing cortical thicknesses (30).
A study with a larger sample size and using various 3D T1 volumetric sequences with patients who are diagnosed with various types of dementia is needed to further validate the BSIM-based method.
In conclusion, although some inter-rater variability was observed in the cingulate, occipital, and cerebellar regions, BSIM-based cortical thickness measurement provides acceptable intra-rater and inter-rater reliability. We therefore suggest BSIM-based cortical thickness analysis as an adjunct tool to detect cortical atrophy in clinical settings.
Acknowledgments
This study was supported by a grant from the Korean Health Technology R&D Project, Ministry of Health &
Welfare, Republic of Korea (HI12C0713). The authors would like to thank Dr. Moon Jung Hwang and GE Healthcare, who contributed to this research by providing CorThick Software.
REFERENCES
1. Jack CR Jr. Alzheimer disease: new concepts on its neurobiology and the clinical role imaging will play.
Radiology 2012;263:344-361
2. Jack CR Jr, Petersen RC, O'Brien PC, Tangalos EG. MR-based hippocampal volumetry in the diagnosis of Alzheimer's disease. Neurology 1992;42:183-188
3. Vermersch P, Leys D, Scheltens P, Barkhof F. Visual rating of hippocampal atrophy: correlation with volumetry. J Neurol Neurosurg Psychiatry 1994;57:1015
4. Ashburner J, Friston KJ. Voxel-based morphometry--the methods. Neuroimage 2000;11:805-821
5. Fischl B, Dale AM. Measuring the thickness of the human cerebral cortex from magnetic resonance images. Proc Natl Acad Sci U S A 2000;97:11050-11055
6. MacDonald D, Kabani N, Avis D, Evans AC. Automated 3-D extraction of inner and outer surfaces of cerebral cortex
from MRI. Neuroimage 2000;12:340-356
7. Fischl B. FreeSurfer. Neuroimage 2012;62:774-781
8. Lin Z, Avinash G, McMillan K, Yan L, Sirohey S, Minoshima S. Quantitative measurement of MR cortical atrophy:
MR brain surface intensity model (BSIM) and group and individual cortical thinning studies. Proc SPIE 8672, Medical Imaging 2013: Biomedical applications in molecular, structural and functional imaging, 86720E.
March 29, 2013
9. Lin ZS, Avinash G, Yan L, McMillan K. Cortical thinning in cognitively normal elderly cohort of 60 to 89 year old from AIBL database and vulnerable brain areas. Proc SPIE 9038, Medical Imaging 2014: Biomedical applications in molecular, structural and functional imaging, 90381P.
March 13, 2014
10. Lee JS, Lee DS, Kim J, et al. Development of Korean standard brain templates. J Korean Med Sci 2005;20:483- 488
11. Tang Y, Hojatkashani C, Dinov ID, et al. The construction of a Chinese MRI brain atlas: a morphometric comparison study between Chinese and Caucasian cohorts. Neuroimage 2010;51:33-41
12. Chee MW, Zheng H, Goh JO, Park D, Sutton BP. Brain structure in young and old East Asians and Westerners:
comparisons of structural volume and cortical thickness. J Cogn Neurosci 2011;23:1065-1079
13. McGraw KO WS. Forming inferences about some intraclass correlation coefficients. Psychological Methods 1996;1:30- 46
14. Shrout PE, Fleiss JL. Intraclass correlations: uses in assessing rater reliability. Psychol Bull 1979;86:420-428 15. Fleiss JL. Statistical Methods for Rates and Proportions.
2nd ed. Wiley, John and Sons, Incorporated, New York, NY, 1981
16. Cicchetti DV, Sparrow SA. Developing criteria for establishing interrater reliability of specific items:
applications to assessment of adaptive behavior. Am J Ment Defic 1981;86:127-137
17. Maezawa M, Seki T, Imura S, Akiyama K, Takikawa I, Yuasa Y. Magnetic resonance signal intensity ratio of gray/white matter in children. Quantitative assessment in developing brain. Brain Dev 1993;15:198-204
18. Narr KL, Bilder RM, Toga AW, et al. Mapping cortical thickness and gray matter concentration in first episode schizophrenia. Cereb Cortex 2005;15:708-719
19. Lerch JP, Pruessner J, Zijdenbos AP, et al. Automated cortical thickness measurements from MRI can accurately separate Alzheimer's patients from normal elderly controls.
Neurobiol Aging 2008;29:23-30
20. Du AT, Schuff N, Kramer JH, et al. Different regional
patterns of cortical thinning in Alzheimer's disease and frontotemporal dementia. Brain 2007;130:1159-1166 21. Hartikainen P, Rasanen J, Julkunen V, et al. Cortical
thickness in frontotemporal dementia, mild cognitive impairment, and Alzheimer's disease. J Alzheimers Dis 2012;30:857-874
22. Lehmann M, Rohrer JD, Clarkson MJ, et al. Reduced cortical thickness in the posterior cingulate gyrus is characteristic of both typical and atypical Alzheimer's disease. J Alzheimers Dis 2010;20:587-598
23. Ballmaier M, O'Brien JT, Burton EJ, et al. Comparing gray matter loss profiles between dementia with Lewy bodies and Alzheimer's disease using cortical pattern matching:
diagnosis and gender effects. Neuroimage 2004;23:325- 335
24. Jubault T, Gagnon JF, Karama S, et al. Patterns of cortical thickness and surface area in early Parkinson's disease.
Neuroimage 2011;55:462-467
25. Li Y, Wang Y, Wu G, et al. Discriminant analysis of
longitudinal cortical thickness changes in Alzheimer's disease using dynamic and network features. Neurobiol Aging 2012;33:427 e415-430
26. Thompson PM, Hayashi KM, Dutton RA, et al. Tracking Alzheimer's disease. Ann N Y Acad Sci 2007;1097:183-214 27. Iscan Z, Jin TB, Kendrick A, et al. Test-retest reliability of
freesurfer measurements within and between sites: Effects of visual approval process. Hum Brain Mapp 2015;36:3472- 3485
28. Clarkson MJ, Cardoso MJ, Ridgway GR, et al. A comparison of voxel and surface based cortical thickness estimation methods. Neuroimage 2011;57:856-865
29. Wyman BT, Harvey DJ, Crawford K, et al. Standardization of analysis sets for reporting results from ADNI MRI data.
Alzheimers Dement 2013;9:332-337
30. Jack CR Jr, Bernstein MA, Fox NC, et al. The Alzheimer's Disease Neuroimaging Initiative (ADNI): MRI methods. J Magn Reson Imaging 2008;27:685-691