Journal of the Korean Chemical Society 2021, Vol. 65, No. 3
Printed in the Republic of Korea
SUPPORTING INFORMATION
Synthesis, Characterization and in vitro Antibacterial Studies on Mixed Ligand Complexes of Iron(III) Based on 1,10-phenanthroline
Getinet Tamiru Tigineh*, Getu Sitotaw, Amogne Workie†, and Atakilt Abebe Bahir Dar University, Science College, Chemistry Department, P.O. Box; 79, Bahir Dar, Ethiopia.
*E-mail: [email protected]; [email protected]
†Institute of Chemistry, Academia Sinica, 128, Sec. Academia Rd., Nangang, Taipei 115, Taiwan.
(Received February 7, 2021; Accepted March 3, 2021)
Experimental
Chemicals
1,10-phenanthroline monohydrate (>99%, BDH Chem- ical Ltd., Poole, England), guanine (99%, ACROS), FeCl3 (>97%), silver nitrate (>99%), sodium hydroxide (>97%), acetone (>98%), chloroform (>99%), sulfuric acid (>95%)]
(Sigma Aldrich), methanol (Absolut) (Hi Media Labora- tories Ltd., India), KBr (for IR spectroscopy Uvasol®), dichloromethane (>99.5%), Mueller Hinton agar, and barium chloride (BLULUX Laboratories Ltd., India), and nitric acid (T.V. Industrial Estate, India) were used.
Instruments and Methods
Melting points were determined using STONE, STAF- FORDSHIRE, ST15 OSA, UK, digital melting point appa- ratus. Molar conductivities of 10-4 M solutions of the solid complex in double distilled water were measured using Jenway 4200 conductivity meter. Elemental analyses were performed using a PERKIN ELMER 2400 CHN elemental analyzer. The electronic absorption spectra in the (200- 800 nm) range were obtained in double distilled water on a Shimadzu UV-1700 UV-Visible spectrophotometer. FT-
IR spectra were recorded on a Perkin-Elmer frontier pro- motion cod ILC38B6PD7 spectrometer (4000-450 cm-1) in KBr pellets. HR-ESI spectra was conducted on dual ionization ESCi® (ESI/APCi) source options Waters LCT Premier XE (Waters Corp., Manchester, UK) at Academia Sinica, Institute of Chemistry, Taiwan. Iron content was determined by PerkinElmer, Optima 7300V HF Version ICP-OES spectrometer, digesting 1.6 mg of each complex in concentrated nitric acid and diluting them using double distilled water. The current-voltage measurements were performed using CHI 760d Electrochemical Workstation (Texas, USA) connected to a personal computer with a conventional three-electrode system. Carbon paste electrode (CPE) as a working electrode, platinum coil as a counter electrode, and Ag/AgCl (3 M KCl) as a reference electrode were used. Cyclic voltammograms of 2.0 mM aqueous solution of the complexes at the carbon paste electrode (CPE) were recorded within the potential window of 0.2 to 1.1 V.
Chloride ions were determined thermo-gravimetrically using the AgCl precipitate obtained from the mixture of 10 mL solution of 11 mg of each complex in distilled water with excess AgNO3 solution.
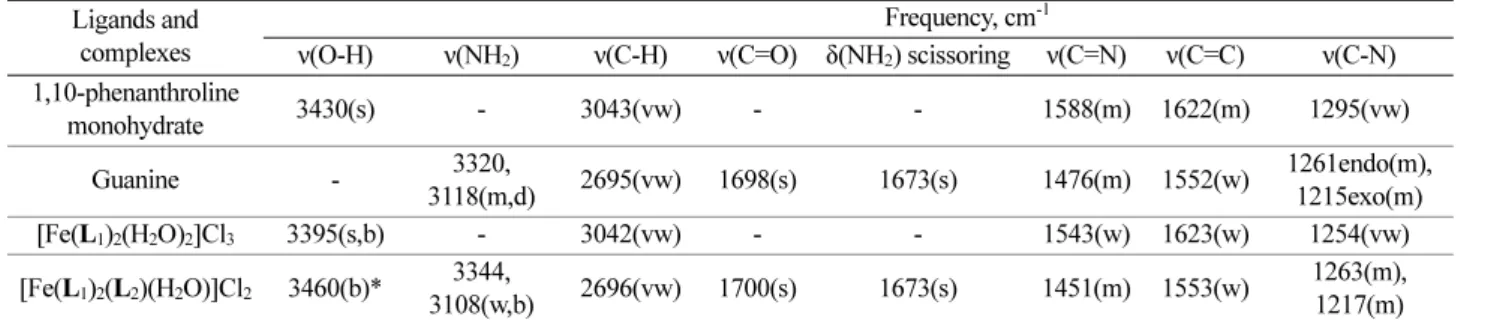
Table S1. IR spectra data of ligands and complexes Ligands and
complexes
Frequency, cm-1
ν(O-H) ν(NH2) ν(C-H) ν(C=O) δ(NH2) scissoring ν(C=N) ν(C=C) ν(C-N) 1,10-phenanthroline
monohydrate 3430(s) - 3043(vw) - - 1588(m) 1622(m) 1295(vw)
Guanine - 3320,
3118(m,d) 2695(vw) 1698(s) 1673(s) 1476(m) 1552(w) 1261endo(m), 1215exo(m) [Fe(L1)2(H2O)2]Cl3 3395(s,b) - 3042(vw) - - 1543(w) 1623(w) 1254(vw) [Fe(L1)2(L2)(H2O)]Cl2 3460(b)* 3344,
3108(w,b) 2696(vw) 1700(s) 1673(s) 1451(m) 1553(w) 1263(m), 1217(m) Key: s = strong; m = medium; w = weak; vw = very weak; d=doublet; b = broad, *overlap with the ν(NH2)
2 Getinet Tamiru Tigineh, Getu Sitotaw, Amogne Workie, and Atakilt Abebe
Figure S1. FTIR spectra of ligands and complex.
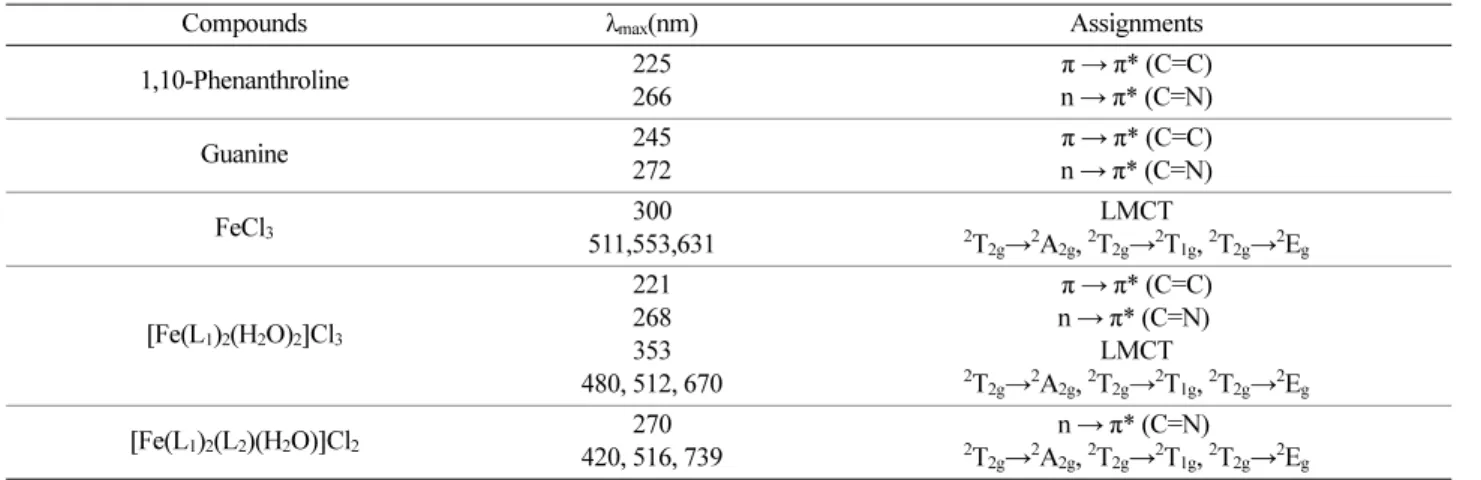
Table S2. Electronic spectral data of the salt, ligands, and complexes
Compounds λmax(nm) Assignments
1,10-Phenanthroline 225
266
π → π* (C=C) n → π* (C=N)
Guanine 245
272
π → π* (C=C) n → π* (C=N)
FeCl3 300
511,553,631
2T2g→2A2g, 2TLMCT2g→2T1g, 2T2g→2Eg
[Fe(L1)2(H2O)2]Cl3
221 268 353 480, 512, 670
π → π* (C=C) n → π* (C=N) 2T2g→2A2g, 2TLMCT2g→2T1g, 2T2g→2Eg
[Fe(L1)2(L2)(H2O)]Cl2 270 420, 516, 739
n → π* (C=N) 2T2g→2A2g, 2T2g→2T1g, 2T2g→2Eg
Synthesis, Characterization and in vitro Antibacterial Studies on Mixed Ligand Complexes of Iron(III) Based on 1,10-phenanthroline 3
Figure S2. UV-Vis spectra of metal salt, ligands, and complexes.
4 Getinet Tamiru Tigineh, Getu Sitotaw, Amogne Workie, and Atakilt Abebe
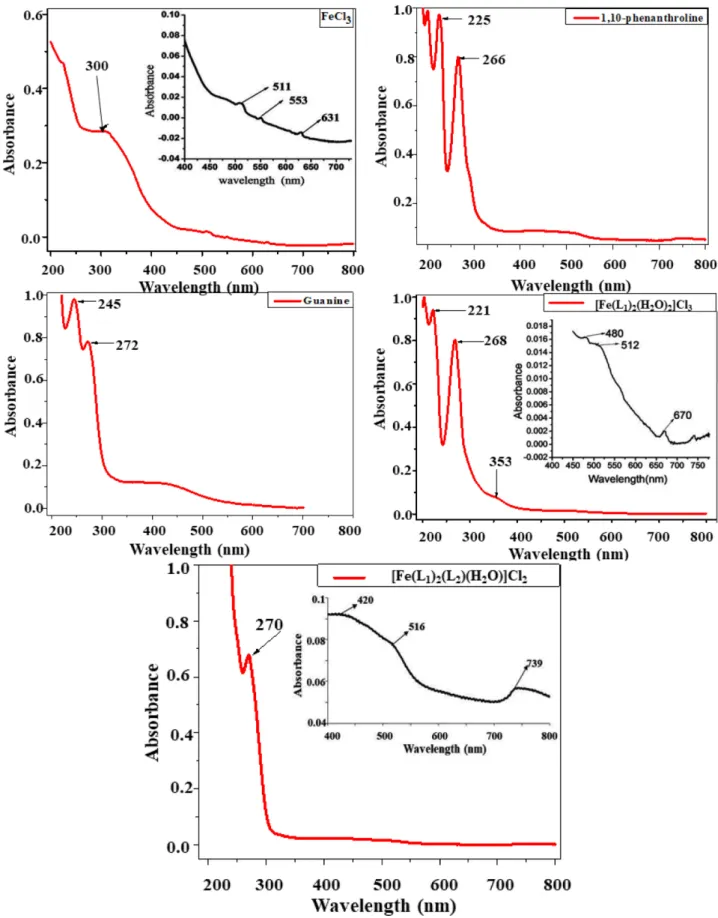
Figure S3. ESI-Mass spectra of complexes.
Synthesis, Characterization and in vitro Antibacterial Studies on Mixed Ligand Complexes of Iron(III) Based on 1,10-phenanthroline 5
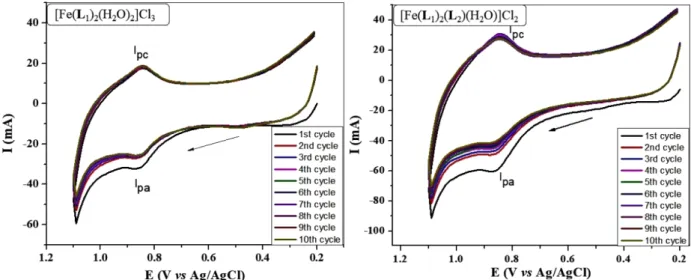
Figure S4. Cyclic voltammogram of 2.0 mM solution of Fe(III) complexes with 1.0 M KCl supporting electrolyte at a scan rate of 100 mVs-1.
Table S3. Antibacterial activities of the metal salt, complexes, and commercially available antibiotic
Compound
Inhibition zone (mm)
Gram-positive Gram-negative
S.aures S.epi E.coli K.pne
FeCl3 0.00±00 4.60±0.01 3.30±0.11 0.00±00
[Fe(L1)2(H2O)2]Cl3 26.86±0.23 29.70±0.10 12.30±0.40 8.90±0.11
[Fe(L1)2(L2)(H2O)]Cl2 13.17±0.30 14.22±0.21 30.99±0.01 25.20±0.30
Erythromycin 28.70±0.58 29.97±0.50 10.90±0.11 7.30±0.38
Table S4. MIC assay of [Fe(L1)2(L2)(H2O)]Cl2 against four bacterial pathogens
Microorganism Minimum concentration of microorganism growth (in µg/mL)
75 150 300 500 600
Staphylococcus aureus + + + − −
Staphylococcus epidermidis + + + − −
Escherichia coli + − − − −
Klebsiella Pneumonia + − − − −
Note: +: bacteria growth and −: no bacteria growth.