Association between Body Fat and Diabetic Peripheral Neuropathy in Middle-Aged Adults with Type 2
Diabetes Mellitus: A Preliminary Report
Tae Jung Oh*, Jie-Eun Lee, Sung Hee Choi, Hak Chul Jang
Department of Internal Medicine, Seoul National University College of Medicine, Seoul; Department of Internal Medicine, Seoul National University Bundang Hospital, Seongnam, Korea
Background: Previous epidemiologic studies showed that obesity increased the risk of diabetic peripheral neuropathy (DPN). However, there is very limited data about the impact of body fat measured by body compo- sition analysis in DPN.
Methods: Subjects with type 2 diabetes mellitus (T2DM) between 20 to 55 years old were enrolled. DPN was diagnosed using the Michigan Neuropathy Screening Instrument. Body composition was assessed by bio-im- pedance analysis, and the association between body composition and DPN was investigated.
Results: Among 65 subjects, 44.6% were diagnosed with DPN. Subjects with DPN had higher body mass index and waist circumference than subjects without DPN. Body composition data showed that fat mass, fat percent, and visceral fat area were higher in subjects with DPN than in subjects without DPN. Furthermore, the presence of DPN was associated with waist circumference (odds ratio [OR], 1.151; 95% confidence interval [CI], 1.055–
1.256; P=0.002), visceral fat area (OR, 1.026; 95% CI, 1.005–1.048; P=0.015), and insulin resistance (OR, 1.673;
95% CI, 1.091–2.565; P=0.018) after adjusting age, sex, diabetes duration, and smoking status.
Conclusion: Abdominal obesity was associated with DPN. Insulin resistance might mediate obesity and DPN in middle aged subjects with T2DM.
Key words: Diabetic neuropathy, Obesity, Visceral fat, Insulin resistance
Received February 25, 2019 Reviewed March 13, 2019 Accepted May 13, 2019
* Corresponding author Tae Jung Oh
https://orcid.org/0000-0002-5078-6123 Department of Internal Medicine, Seoul National University College of Medicine, Seoul; Department of Internal Medicine, Seoul National University Bundang Hospital, 82 Gumi-ro 173beon-gil, Bundang-gu, Seongnam 13620, Korea Tel: +82-31-787-7078
Fax: +82-31-787-4052 E-mail: [email protected]
INTRODUCTION
Diabetic peripheral neuropathy (DPN) is a prevalent and progres- sive microvascular complication of diabetes.
1Early detection and prevention are essential in reducing DPN-related morbidity and mortality. To do this, risk factors of DPN must be identified. Accord- ing to previous epidemiologic studies
2,3and intervention studies
4, age, diabetes duration, smoking status, and components of metabol- ic syndrome including obesity are well-known risk factors for DPN.
There are five components of metabolic syndrome: central obe- sity, high blood pressure, low high-density lipoprotein (HDL) cho- lesterol, high triglycerides, and hyperglycemia.
5Patients with diabe-
tes already have hyperglycemia, but other modifiable risk factors such as hypertension, dyslipidemia, or central obesity can be ad- dressed. Central obesity with insulin resistance is a key pathophysi- ologic factor of metabolic syndrome, so assessment of the relation- ship between obesity and insulin resistance should be investigated.
The Anglo-Danish-Dutch study of Intensive Treatment of Diabetes in Primary Care (ADDITION) study
6and Cooperative Health Research in the Region of Augsburg (KORA) study
7consistently demonstrated that general and central obesity increased the risk of DPN. However, these well-designed prospective observational studies did not assess body composition other than measurement of waist circumference (WC). Furthermore, the ADDITION and
Copyright © 2019 Korean Society for the Study of Obesity
This is an Open Access article distributed under the terms of the Creative Commons Attribution Non-Commercial License (http://creativecommons.org/licenses/by-nc/4.0/) which permits unrestricted non-commercial use, distribution, and reproduction in any medium, provided the original work is properly cited.
eISSN 2508-7576
2017-03-16 https://crossmark-cdn.crossref.org/widget/v2.0/logos/CROSSMARK_Color_square.svg
Original Article
Association between Body Fat and Diabetic Peripheral Neuropathy in Middle-Aged Adults with Type 2
Diabetes Mellitus: A Preliminary Report
Tae Jung Oh*, Jie-Eun Lee, Sung Hee Choi, Hak Chul Jang
Department of Internal Medicine, Seoul National University College of Medicine, Seoul; Department of Internal Medicine, Seoul National University Bundang Hospital, Seongnam, Korea
Background: Previous epidemiologic studies showed that obesity increased the risk of diabetic peripheral neuropathy (DPN). However, there is very limited data about the impact of body fat measured by body compo- sition analysis in DPN.
Methods: Subjects with type 2 diabetes mellitus (T2DM) between 20 to 55 years old were enrolled. DPN was diagnosed using the Michigan Neuropathy Screening Instrument. Body composition was assessed by bio-im- pedance analysis, and the association between body composition and DPN was investigated.
Results: Among 65 subjects, 44.6% were diagnosed with DPN. Subjects with DPN had higher body mass index and waist circumference than subjects without DPN. Body composition data showed that fat mass, fat percent, and visceral fat area were higher in subjects with DPN than in subjects without DPN. Furthermore, the presence of DPN was associated with waist circumference (odds ratio [OR], 1.151; 95% confidence interval [CI], 1.055–
1.256; P=0.002), visceral fat area (OR, 1.026; 95% CI, 1.005–1.048; P=0.015), and insulin resistance (OR, 1.673;
95% CI, 1.091–2.565; P=0.018) after adjusting age, sex, diabetes duration, and smoking status.
Conclusion: Abdominal obesity was associated with DPN. Insulin resistance might mediate obesity and DPN in middle aged subjects with T2DM.
Key words: Diabetic neuropathy, Obesity, Visceral fat, Insulin resistance
Received February 25, 2019 Reviewed March 13, 2019 Accepted May 13, 2019
* Corresponding author Tae Jung Oh
https://orcid.org/0000-0002-5078-6123 Department of Internal Medicine, Seoul National University College of Medicine, Seoul; Department of Internal Medicine, Seoul National University Bundang Hospital, 82 Gumi-ro 173beon-gil, Bundang-gu, Seongnam 13620, Korea Tel: +82-31-787-7078
Fax: +82-31-787-4052 E-mail: [email protected]
KORA studies enrolled patients that were older than 60 and 65 years, respectively. Body composition is influenced by menopause (or andropause for men)
8,9and age-related sarcopenia.
10Therefore, we enrolled young to middle adults to minimize the effect of aging on body composition. This study investigated the association be- tween body composition, components of metabolic syndrome, and DPN in middle-aged adults with type 2 diabetes mellitus (T2DM). We hypothesized that body fat was highly associated with the presence of DPN.
METHODS Subjects
Subjects diagnosed with T2DM were recruited. This is a sub- group analysis of an ongoing prospective observational study. The study plans to enroll 100 subjects annually, and there will be 500 fi- nal participants with T2DM. The study has been designed to inves- tigate reliable tools and discover biomarkers for DPN. The current analysis was performed using subgroup data for the initial 2-year enrolled participants. Inclusion criteria of current analysis included age from 20 to 55 years and no change of antidiabetic medications in the previous 3 months. Exclusion criteria were other causes of neuropathy such as heavy alcohol consumption, renal dysfunction (estimated glomerular filtration rate less than 50 mL/min/1.73 m
2), any history of cancer, and exposure to neurotoxic agents. The study was approved by the Institutional Review Board of Seoul National University Bundang Hospital (IRB No. B-1903/526-101). All par- ticipants provided written informed consent.
Assessment of DPN
DPN was diagnosed using the Michigan Neuropathy Screening Instrument (MNSI)
11, which was validated in Korean patients with diabetes.
12The MNSI is composed of two components, a 15-item self-administered questionnaire and a comprehensive physical ex- amination. DPN was diagnosed when the MNSI-questionnaire (MNSI-Q) was ≥ 7 or MNSI physical examination was ≥ 4.
Anthropometric and body composition measurements
Body weight, height, WC, and blood pressure were measured by a single trained research nurse. All anthropometric examination
was performed in light clothing with bare feet. Body mass index (BMI) was calculated as body weight (kg)/height (m
2). WC was obtained at the middle of the lower rib margin and iliac crest. Sys- tolic and diastolic blood pressure (SBP/DBP) were measured after a 10-minute rest using an electronic blood pressure meter (UA- 1020 device; A&D Co., Tokyo, Japan). Total body fat mass, muscle mass, and visceral fat area were measured by bio-impedance analy- sis (InBody770; InBody, Seoul, Korea).
Biochemical analysis
Participants visited the Endocrine Clinic after fasting overnight.
Blood glucose levels were measured by the hexokinase method, and glycosylated hemoglobin (HbA1c) levels were obtained by high-performance liquid chromatography (Bio-Rad, Hercules, CA, USA). Fasting insulin levels were measured by immunoradiometric assay (DIAsource, Nivelles, Belgium). Homogeneous enzymatic assays and glycerol-3-phosphate oxidase peroxide methods were used to measure HDL cholesterol, low-density lipoprotein choles- terol, and triglyceride. Liver and renal function tests were per- formed using the protocol of the central laboratory of Seoul Na- tional University Bundang Hospital. Homeostatic model assess- ment for insulin resistance (HOMA-IR) was calculated as an indi- cator of insulin resistance using the following formula: plasma insu- lin (μIU/mL)× plasma glucose (mg/dL)/405.
13Insulin resistant status was defined as when HOMA-IR level was higher than 3.0, according to a previous study.
14Statistical analysis
Data are shown as mean± standard deviation or number with
percentage. Means were compared between subjects with and with-
out DPN using Student t-test or the Mann-Whitney U-test. Differ-
ences in sex, history of smoking, alcohol, hypertension, dyslipidemia,
and antidiabetic medications were tested by chi-square test. Spear-
man’s correlation analysis was performed to evaluate the association
between neuropathy examination results, metabolic syndrome com-
ponents, and body composition. Univariate and multivariate logis-
tic regression models were used to estimate the association of clini-
cal parameters and presence of DPN using odds ratios (ORs) with
95% confidential intervals (CIs). Statistical analysis was performed
using IBM SPSS version 22.0 (IBM Corp., Armonk, NY, USA).
RESULTS
In this study, data from 65 subjects with T2DM was analyzed.
Among 65 subjects, 44.6% were diagnosed with DPN. There was no difference in age or sex between subjects without DPN and those with DPN. BMI was higher in subjects with DPN than in subjects without DPN (26.5±4.3 kg/m
2vs. 24.1±3.2 kg/m
2, P=0.011).
SBP tended to be higher in the DPN (+) group, but lipid profiles were comparable between groups. HOMA-IR was significantly in- creased in the DPN (+) group compared to the DPN (–) group.
There was a numerically longer duration of diabetes in the DPN (+) group than the DPN (–) group, and subjects with DPN were more likely to be treated with insulin than subjects without DPN (Table 1).
Table 2 shows body composition data. WC, fat mass, fat percent, and visceral fat area were significantly increased in the DPN (+) group than the DPN (–) group. However, lean body mass was not different between groups.
MNSI-physical examination (MNSI-PE) scores were positively correlated with HbA1c (rho= 0.261, P=0.035), SBP (rho=0.300, P=0.017), and HOMA-IR (rho=0.310, P=0.017). However, these
Table 1. Clinical and biochemical characteristics of patients stratified by presenceof DPN
Variable DPN (–) (n= 36) DPN (+) (n= 29) P
Male sex 25 (69.4) 18 (62.1) 0.603
Age (yr) 47.3± 5.6 47.9± 8.0 0.730
Height (cm) 168.2± 9.2 164.2± 9.4 0.092
Body weight (kg) 68.7± 13.5 71.4± 14.7 0.438
BMI (kg/m2) 24.1± 3.2 26.5± 4.3 0.011
SBP (mmHg) 128.8± 10.6 134.8± 14.8 0.063
DBP (mmHg) 77.1± 7.7 79.3± 9.7 0.304
Diabetes duration (yr) 7.3± 5.0 10.0± 8.3 0.144
Glucose (mg/dL) 139.3± 29.6 156.0± 57.9 0.165
HbA1c (%) 7.2± 1.2 7.8± 1.8 0.111
Cholesterol (mg/dL) 169.0± 42.1 160.8± 52.3 0.486 Triglyceride (mg/dL) 160.6± 156.9 208.6± 248.0 0.417 HDL cholesterol (mg/dL) 50.4± 12.2 47.0± 16.7 0.347 LDL cholesterol (mg/dL) 95.3± 25.8 88.5± 32.9 0.352
BUN (mg/dL) 15.7± 3.4 15.8± 4.8 0.945
Creatinine (mg/dL) 0.7± 0.2 0.8± 0.2 0.288
eGFR (mL/min/1.73 m2) 108.7± 23.0 100.5± 24.2 0.168
AST (IU/L) 26.9± 15.3 35.1± 19.2 0.004
ALT (IU/L) 27.8± 19.5 38.4± 22.3 0.045
Insulin 6.5± 3.0 8.9± 5.0 0.093
HOMA-IR 2.3± 1.2 3.4± 2.1 0.024
MNSI-Q (score) 2.0± 1.7 3.6± 2.8 0.021
MNSI-PE (score) 1.3± 0.7 3.4± 1.0 < 0.001
Smoking status 0.074
Never smoker 10 (27.8) 16 (55.2)
Ex-smoker 12 (33.3) 5 (17.2)
Current smoker 14 (38.9) 8 (29.6)
Alcohol 23 (63.9) 15 (51.7) 0.448
Hypertension 22 (61.1) 21 (72.4) 0.432
Dyslipidemia 21 (58.3) 19 (65.5) 0.614
Oral antidiabetic medication 32 (88.9) 27 (93.1) 0.684
Insulin therapy 5 (13.9) 8 (27.6) 0.218
Values are presented as number (%) or mean± standard deviation.
DPN, diabetic peripheral neuropathy; BMI, body mass index; SBP, systolic blood pressure;
DBP, diastolic blood pressure; HbA1c, glycosylated hemoglobin; HDL, high-density lipo- protein; LDL, low-density lipoprotein; BUN, blood urea nitrogen; eGFR, estimated glo- merular filtration rate; AST, aspartate aminotransferase; ALT, alanine aminotransferase;
HOMA-IR, homeostatic model assessment for insulin resistance; MNSI-Q, Michigan Neuropathy Screening Instrument-questionnaire; MNSI-PE, MNSI-physical examination.
Table 2. Body composition analysis data of patients by presence of DPN
Variable DPN (–) (n= 36) DPN (+) (n= 29) P
WC (cm) 82.9± 9.6 89.0± 7.9 0.008
Fat mass (kg) 17.2± 6.4 21.9± 8.8 0.016
Fat percent (%) 25.0± 7.6 30.0± 7.7 0.010
Lean body mass (kg) 48.5± 10.2 47.0± 9.0 0.539
Visceral fat area (cm2) 78.4± 31.6 102.0± 43.3 0.014 Values are presented as mean± standard deviation.
DPN, diabetic peripheral neuropathy; WC, waist circumference.
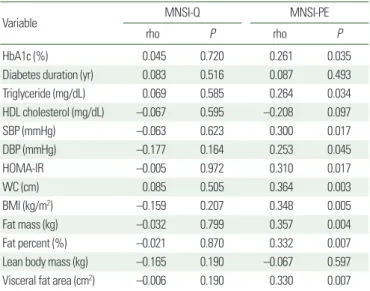
Table 3. Correlation coefficients of Spearman analysis between MNSI, metabolic syndrome components, and body composition data
Variable MNSI-Q MNSI-PE
rho P rho P
HbA1c (%) 0.045 0.720 0.261 0.035
Diabetes duration (yr) 0.083 0.516 0.087 0.493
Triglyceride (mg/dL) 0.069 0.585 0.264 0.034
HDL cholesterol (mg/dL) –0.067 0.595 –0.208 0.097
SBP (mmHg) –0.063 0.623 0.300 0.017
DBP (mmHg) –0.177 0.164 0.253 0.045
HOMA-IR –0.005 0.972 0.310 0.017
WC (cm) 0.085 0.505 0.364 0.003
BMI (kg/m2) –0.159 0.207 0.348 0.005
Fat mass (kg) –0.032 0.799 0.357 0.004
Fat percent (%) –0.021 0.870 0.332 0.007
Lean body mass (kg) –0.165 0.190 –0.067 0.597
Visceral fat area (cm2) –0.006 0.190 0.330 0.007 MNSI, Michigan Neuropathy Screening Instrument; MNSI-Q, MNSI-questionnaire;
MNSI-PE, MNSI-physical examination; HbA1c, glycosylated hemoglobin; HDL, high- density lipoprotein; SBP, systolic blood pressure; DBP, diastolic blood pressure; HOMA- IR, homeostatic model assessment for insulin resistance; WC, waist circumference;
BMI, body mass index.
parameters did not show significant association with MNSI-Q.
Among body composition parameters, total obesity and abdominal obesity were positively correlated with MNSI-PE (Table 3).
Univariate regression analysis revealed that HOMA-IR (OR, 1.561; 95% CI, 1.079–2.258; P=0.018), WC (OR, 1.086; 95% CI, 1.018–1.158; P=0.013), BMI (OR, 1.210; 95% CI, 1.033–1.417;
P=0.018), and visceral fat area (OR, 1.018; 95% CI, 1.003–1.035;
P=0.022) were associated with the presence of DPN. Significance was maintained after adjusting for age, sex, diabetes duration, and smoking status (Table 4).
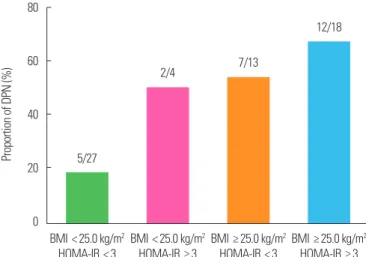
When subjects were categorized according to their BMI and in- sulin resistance status, lean subjects with lower HOMA-IR were less likely to have DPN (18.5%). In contrast, the majority of sub- jects who were obese and had higher insulin resistance also had DPN (66.7%) (Fig. 1).
DISCUSSION
In this observational study that included young to middle-aged adults with T2DM, 44.6% of subjects were diagnosed with DPN according to MNSI. Subjects with DPN showed higher insulin re- sistance and a greater degree of general and abdominal obesity.
Furthermore, the physical examination score of subjects with DPN was significantly associated with HOMA-IR, BMI, WC, and vis- ceral fat area.
Among the five components of metabolic syndrome, central obesity was the most important risk factor for DPN in subjects with diabetes. In our study, the parameters of central obesity, WC, and visceral fat area were highly correlated with HOMA-IR (rho=
0.510 for WC, P<0.001; rho=0.366 for visceral fat area, P=0.008).
In addition, the statistically significant association between DPN and visceral fat area diminished after adjusting for HOMA-IR (data not shown). Therefore, insulin resistance might be a key regulator between obesity and DPN. Insulin resistant status represents low grade inflammation
15, which influences endothelial dysfunction
16and microvascular complications.
17,18The KORA study proved that biomarkers of subclinical inflammation were associated with DPN progression.
19Our study provides evidence of the pathophysiologic role of abdominal obesity and insulin resistance in DPN. However, hyperglycemic-euglycemic clamp studies or oral glucose tolerance tests at multiple time points are needed to measure insulin resis- tance more accurately.
Previous intervention studies showed that body weight loss de- creased the incidence of DPN.
4,20Although secondary effects due to improved hyperglycemia after body weight loss cannot be ruled out, body weight management is an important intervention strate- gy for DPN. Studies have already shown the beneficial effect of
Table 4. Odds ratios and 95% confidential intervals of presence of DPN accordingto metabolic and anthropometric components
Variable Unadjusted model P Adjusted model P
Glucose (mg/dL) 1.009 (0.997–1.021) 0.147 1.009 (0.996–1.023) 0.160 HbA1c (%) 1.336 (0.940–1.899) 0.107 1.394 (0.932–2.084) 0.106 Triglyceride (mg/dL) 1.001 (0.999–1.004) 0.360 1.002 (0.999–1.005) 0.104 HDL cholesterol (mg/dL) 0.983 (0.947–1.019) 0.347 0.978 (0.938–1.019) 0.281 SBP (mmHg) 1.040 (0.997–1.085) 0.069 1.056 (1.004–1.111) 0.034 DBP (mmHg) 1.032 (0.973–1.095) 0.300 1.067 (0.985–1.155) 0.111 HOMA-IR 1.561 (1.079–2.258) 0.018 1.673 (1.091–2.565) 0.018 WC (cm) 1.086 (1.018–1.158) 0.013 1.151 (1.055–1.256) 0.002 BMI (kg/m2) 1.210 (1.033–1.417) 0.018 1.266 (1.045–1.534) 0.016 Fat mass (kg) 1.095 (1.012–1.186) 0.025 1.131 (1.021–1.252) 0.018 Fat percent (%) 1.091 (1.018–1.170) 0.014 1.147 (1.030–1.277) 0.013 Lean body mass (kg) 0.984 (0.934–1.036) 0.533 0.988 (0.896–1.090) 0.811 Visceral fat area (cm2) 1.018 (1.003–1.035) 0.022 1.026 (1.005–1.048) 0.015 Values are presented as odds ratio (95% confidential interval). Adjusted model was ad- justed for age, sex, diabetes duration, and smoking status.
DPN, diabetic peripheral neuropathy; HbA1c, glycosylated hemoglobin; HDL, high-den- sity lipoprotein; SBP, systolic blood pressure; DBP, diastolic blood pressure; HOMA-IR, homeostatic model assessment for insulin resistance; WC, waist circumference; BMI, body mass index.
Figure 1. Proportion of diabetic peripheral neuropathy (DPN) according to body mass index (BMI) and homeostatic model assessment for insulin resistance (HOMA-IR). Values indicate number of subjects with DPN/total number of sub- groups.
80
60
40
20
0
Proportion of DPN (%)
BMI < 25.0 kg/m2 HOMA-IR < 3
5/27
BMI < 25.0 kg/m2 HOMA-IR ≥ 3
2/4
BMI ≥ 25.0 kg/m2 HOMA-IR < 3
7/13
BMI ≥ 25.0 kg/m2 HOMA-IR ≥ 3
12/18