· Received : September 27, 2021 · Revised : October 12, 2021 · Accepted : October 13, 2021
§
Corresponding Author : Jei-Pil Wang (E-mail : [email protected])
Department of Metallurgical Engineering, Pukyong National University, Yongso-ro 45, Nam-gu, Busan 48513, Korea
ⓒThe Korean Institute of Resources Recycling. All rights reserved. This is an open-access article distributed under the terms of the Creative Commons Attribution Non-Commercial License (http://creativecommons.org/licenses/by-nc/3.0/), which permits unrestricted non-commercial use, distribution and reproduction in any medium, provided the original work is properly cited.
≫ 연구논문 ≪
초음파 세척법을 이용한 사용 후 태양광 셀로부터 Si 회수 연구
이동헌* · 고민석* · §왕제필**
*국립부경대학교 마린융합디자인공학과(첨단소재공학), **국립부경대학교 금속공학과, 마린융합디자인공학과(첨단소재공학)
A Study to Recover Si from End-of-Life Solar Cells using Ultrasonic Cleaning Method
Dong-Hun Lee*, Min-Seok Go* and
§Jei-Pil Wang**
*Department of Marine Convergence Design Engineering (Advanced Materials Engineering), Pukyong National University
**Department of Metallurgical Engineering, Department of Marine Convergence Design Engineering (Advanced Materials Engineering), Pukyong National University
요 약
본 연구에서는 사용 후 태양광 셀을 HCl 용액 및 초음파세척기의 cavitation효과를 사용하여 셀 표면의 불순물(Al, Zn, Ag 등)을 제거 하여 Si을 선택적으로 회수하기 위한 최적 공정 조건을 찾기 위한 연구를 진행하였다. 태양광 셀에서 Si을 선택적으로 회수 하기 위해 HCl 용액 및 초음파세척기를 사용하여 침출을 진행하였고, 반응이 끝난 태양광 셀은 증류수로 세척 후 건조 오븐에 건조를 실시하였고, 반응 된 HCl 용액은 감압 여과 실시 후 여과된 용액은 ICP-Full Scan 분석을 실시하였다. 또한, 건조 된 태양광 셀은 유발을 사용하여 파쇄 후 XRD, XRF, 및 ICP-OES 분석을 실시하였으며, 이를 통해 Si의 순도 및 회수율을 알 수 있었다. 실험은 산용액 농도, 반응 온도, 반응 시간, 초음파 세기를 변수로 두고 실험을 진행하였다. 위 과정을 통해 최종적으로 태양광 셀로부터 Si을 선택적으로 회수하기 위한 최적 공정 조건은 산용액 농도 3M HCl, 반응 온도 60℃, 반응 시간 120min, 초음파 세기 150W인것을 알 수 있었고, 최종적으로 Si의 순도는 99.85%, 회수율은 99.24%로 측정되었다.
주제어 : 사용 후 태양광 셀, cavitation 효과, 실리콘, 회수율, 순도
Abstract
In this study, we determine the optimal process conditions for selectively recovering Si from a solar cell surface by removal of impurities (Al, Zn, Ag, etc.). To selectively recover Si from solar cells, leaching is performed using HCl solution and an ultrasonic cleaner. After leaching, the solar cells are washed using distilled water and dried in an oven. Decompression filtration is performed on the HCl solution, and ICP-OES (Inductively Coupled Plasma Optical Emission spectroscopy) full scan analysis is performed on the filtered solution. Furthermore, XRD (X-ray powder diffraction), XRF (X-ray fluorescence), and ICP-OES are performed on the dried solar cells after crushing, and the purity and recovery rate of Si are obtained. In this experiment, the concentration of acid solution, reaction temperature, reaction time, and ultrasonic intensity are considered as variables. The results show that the optimal process conditions for the selective recovery of Si from the solar cells are as follows: the concentration of acid solution = 3 M HCl, reaction temperature = 60℃, reaction time = 120 min, and ultrasonic intensity = 150 W. Further, the Si purity and recovery rate are 99.85 and 99.24%, respectively.
Key words : Post-used Solar Cell, Cavitation Effect, Silicon, Purity, Recovery Efficiency
1. Introduction
Renewable energy is drawing attention due to the problems in resources and the environment caused by recent rapid industrial development. As interest in renewable energy increases, the use of solar energy, a representative eco-friendly energy, is also on the rise. According to the 2017 International Energy Agency (IEA) data, the current state of energy generation includes thermal and nuclear power (67%), hydro power (20%) and solar power (4.4%), etc. In a 2040 growth forecast, thermal and nuclear power were predicted to decrease to 50%, while solar power was expected to increase to 12%1,2). The amount of installed solar modules has increased gradually, with the accumulated global solar installation reaching about 509 GW in 2018, indicating that the solar industry is continuously growing3). However, handling post-used photovoltaic modules at the end of their life cycle (approximately 20-30 years) has emerged as a major problem. According to an IEA report, about 76 million tons of post-used solar modules are expected to be generated in 20504,5). Post-used solar cell modules are composed of silver (Ag), aluminum (Al), silicon (Si), Pb (lead), etc6,7). Since harmful substances such as lead are contained in post-used solar cell modules, burying, or incinerating the modules after use is expected to cause a lot of environmental pollution.
Through the Waste Electrical and Electronic Equipment (WEEE) Directive, Europe has mandated solar modules to be recycled by designating solar modules as electrical and electronic waste. Even though silicon, copper, silver, etc. in the post-used solar modules are expensive and worth recycling, however, most of them are being buried.
Since the process to obtain high purity polysilicon accounts for about 50% of the energy consumed by the entire solar module manufacturing process, economic and environ- mental benefits are expected if high purity silicon can be recovered from the solar cells8).
For the case of France, the main purpose of the CABRISS project, which was sponsored by CEA and launched in June 2015 by a consortium of 16 European
companies and research institutes to be executed over 3 years, is to develop technology based on the idea of
‘Total Recycling (Maximum recycling efficiency of 90%)’
with the goal of recycling all materials that have high economic value even if only a small amount are included rather than technology development oriented toward silicon recycling. It is focused on maximizing economic feasibility through virtuous cycling of resources9).
Germany has dominated the solar cell waste module processing field, and Japan has also been securing source technologies for recovering valuable metals and recycling silicon from solar cell waste modules to cope with resource depletion since the 1980s10,11). Korea is lagging behind in solar cell waste module processing technology, and it is in a situation in which it is burying waste rather than recovering resources12).
In this study, we conducted research to selectively recover silicon from post-used photovoltaic cells by using microwave that is newly-attempted method with cavitation effect. The ultrasonic cavitation effect enables cleaning to the inside of the object in a short time compared to agitation, and the surface cleaning effect is more excellent. Most of the impurities present in the photovoltaic cell are adsorbed to the photovoltaic cell surface, so an ultrasonic cleaner that is more suitable for removing impurities than stirring was used. In this case, the optimal process conditions were established by con- trolling the concentration of the reaction solution, the reaction temperature, the reaction time, and the ultrasonic intensity in order to increase the purity and recovery rate of the recovered silicon. The recovered solar cell phase was confirmed through XRD analysis, and the purity of recovered Si was measured through XRF and ICP-OES analysis. To determine leaching effect to remove the impurities with HCl, the impurity content in the solution was measured through ICP-OES analysis.
2. Materials
The samples used in this study were post-used solar
cells. The results of the XRD and XRF analysis of the solar cells used in the study are shown in Fig. 1. For the analysis, X-Ray Diffraction (XRD) and X-Ray Fluorescence (XRF) analysis were carried out after crushing raw sample solar cells with a mortar. In this study, PANalytical's X'Pert3-Powder was used for XRD, SHIMADZU's XRF 1800 was used for XRF, and PerkinElmer's Optima 5300 DV was used for ICP-OES.
XRD analysis result showed that Si and Al were present in solar cells, and it was possible to verify the element content of 89.75% Si, 10.18% Al, and 0.07% Zn through the XRF analysis result.
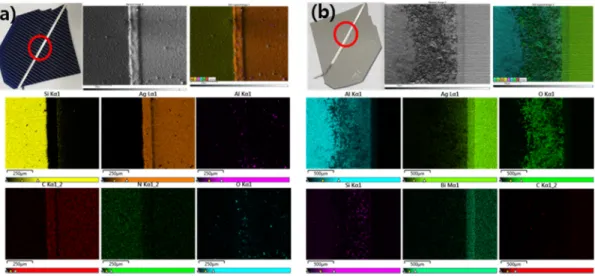
In addition, the results of SEM-Mapping analysis of the front and back side of solar cells are shown in Fig. 2.
For the SEM-Mapping analysis, the red circled areas in Fig. 2 were analyzed. Through SEM-Mapping analysis, it was possible to verify that Si, Ag, and Al are mainly present in the front side of the solar cell, and that Al is mainly present in the back side, in addition to Ag.
3. Experiment method
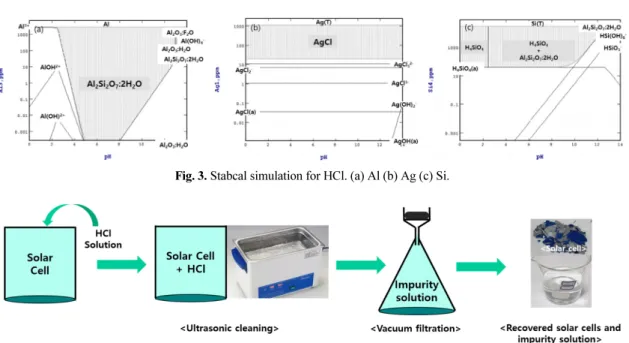
Raw sample analysis result showed the presence of Al, Ag, Zn but no Si in post-used solar cells. The Stabcal simulation for HCl is shown in Fig. 3. Fig. 3 shows that under HCl conditions, Al dissolves in the form of Al3+, AlOH2+, Al(OH)2+ at pH lower than 3, Ag precipitates into AgCl in all areas when the concentration is 10ppm or greater, and Si does not dissolve in acid areas. As a result of Stabacal simulation for HCl shown in Fig. 3, the elements Al, Ag, and Si in the photovoltaic cell, Al and Ag react with HCl and Si does not. Based on this result, only Si can be selectively recovered by removing impurities such as Al and Ag during the reaction with HCl and photovoltaic cells.
In order to remove impurities (Al, Ag, Zn, etc.) and recover Si from the post-used solar cells, an ultrasonic
Fig. 2. SEM-Mapping analysis of post-used solar cells (a) front side of a solar cell (b) backside of a solar cell.
Fig. 1. XRD and XRF analysis results.
cleaner was used as the equipment, 34-36% HCl solution was used as the acid solvent, and distilled water was used for water.
To increase the purity and recovery efficiency of Si, experiments were conducted by diversifying the concent- ration, reaction temperature, reaction time, and ultrasonic intensity conditions of the acid solution shown in Fig. 4.
First, after inserting 10g of post-used solar cell into a beaker containing 34-36% HCl solution, it was reacted by using an ultrasonic cleaner to remove impurities.
After the reaction, the post-used solar cells were washed with distilled water and dried in a drying oven (100°C) for 24h. In addition, the HCl solution reacted with the photovoltaic cell was filtered under reduced pressure, and the filtered solution was analyzed by full scan through ICP-OES. The solar cells dried in a drying oven were crushed into fine powder using a mortar to proceed with XRD and XRF analysis. The following is the expected reaction formula for Al and Ag and HCl in solar cells.
2Ag(s) + 2HCl(l) = 2AgCl↓ + H2↑ 2Al(s) + 6HCl(aq) = 2AlCl3(aq) + 3H2
4. Result and discussion
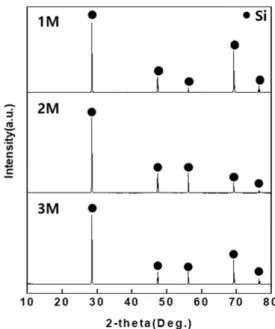
4.1. Acid Solution concentration experiment After mixing 10g of post-used solar cells with 100ml of 1,2,3M HCl solution and inserting in a beaker, reaction was performed at reaction temperature of 60°C, reaction time of 60min, and ultrasonic intensity of 150W using an ultrasonic cleaner. After the reaction, the solar cells were washed sufficiently with distilled water and dried in a drying oven (100°C) for 24h, and decompression filtration was performed on the HCl solution that had reacted with the solar cells. XRD and XRF analysis were carried out on the dried solar cells after crushing them with a mortar and the filtered solution was analyzed by ICP-Full Scan. The XRD analysis result is organized in Fig. 5, and it was verified that only Si phases were detected under all concentration conditions of 1,2,3M. In addition, from the XRF analysis result in Table 1, it was verified that highest Si purity of 99.85% was obtained from the 3M HCl solution.
The ICP-Full Scan result of the filtered solution is shown in Table 2. From the ICP-Full Scan result, it can
Fig. 3. Stabcal simulation for HCl. (a) Al (b) Ag (c) Si.
Fig. 4. Process chart of the entire experiment.
be seen that 3M HCl solution has the highest impurity removal effect since most Al, Ag, Zn content was detected by the 3M HCl solution which has the highest concentration. In addition, it can be verified that removal
of Al was realized effectively while removal of Ag was not under all concentration conditions of 1,2,3M.
Furthermore, it was possible to calculate the Si recovery efficiency from the weight of the solar cell before the experiment, the weight of the solar cell after being dried in a drying oven, and the Si content derived from the XRF analysis result.
The equation to calculate the Si recovery efficiency is as shown below.
Silicon recovery efficiency (%)
= Weight percent of the recovered silicon Weight percent of silicon inside the module×100
(1) The weight of solar cells before and after the experi- ment is shown in Table 3. The weight of the solar cells before the experiment was 1M 10.13g, 2M 10.06g and 3M 10.21g, respectively, and it decreased to 1M 9.21g, 2M 8.85g and 3M 8.98g, respectively, after the experiment.
Using Equation (1), the Si recovery efficiency was calculated to be 1M 95.82%, 2M 97.67%, and 3M 97.93%,
Fig. 5. XRD result for solar cells after drying – concentration.
Table 1. XRF result for solar cells after drying – concentration (Unit: %)
Analyzed element
Concentration (M) Si Al Total
1 94.54 5.46
100
2 99.66 0.34
3 99.85 0.15
Table 3. Weight of the solar cell before and after the ex- periment and Si recovery efficiency – concentration Sample (M) Before the
experiment (g) After the
experiment (g) Recovery efficiency (%)
1 10.13 9.21 95.82
2 10.06 8.85 97.67
3 10.21 8.95 97.93
Table 2. ICP-Full scan of the filtered solution – concentration Analyzed element and content (mg/L)
1M 2M 3M
Al 1400 Ni 0.4 Al 1400 Ni 0.4 Al 1300 Ni 0.5
Ag 0.4 In 1.0 Ag 0.5 In 1.0 Ag 4.8 In 0.8
Si 65 Sn 1.5 Si 48 Sn 1.0 Si 37 Sn 9.7
Fe 6.4 Mg 0.1 Fe 4.0 Mg 0.2 Fe 4.1 Mg 0.1
Zn 9.5 Mn 0.2 Zn 8.0 Mn <0.1 Zn 8.0 Mn <0.1
Pb 4.2 Co <0.1 Pb 3.5 Co <0.1 Pb 6.8 Co <0.1
Bi 0.6 Cu 0.2 Bi 0.6 Cu 0.2 Bi 1.2 Cu 7.7
and the highest recovery efficiency of 97.93% was obtained with the 3M HCl solution. As a result of the study, it was confirmed that the removal rate of impurity and Si purity of the photovoltaic cell were improved as the solution concentration increased when the same amount of HCl solution was reacted. It seems that the removal rate of impurity and Si purity improved as the HCl content to react with impurities in the solar cell increased.
From the results of the experiments that were per- formed with variable concentrations to derive the optimal concentration condition for selective recovery of Si from post-used solar cells, it was possible to verify that only Si phases were detected under all concentration conditions of 1,2,3M. Furthermore, under concentration conditions of 1,2,3M, it was confirmed that the purity of Si was 94% or higher and the recovery rate was verified to be 95% or higher. While the Si recovery efficiency of the 2M and 3M HCl solutions were similar, impurity removal and purity of Si were higher for the 3M HCl solution, indicating that the optimal concentration condition is 3M HCl.
4.2. Reaction temperature experiment
Experiments were conducted under four conditions of 30, 40, 50, and 60°C to obtain the optimal temperature for the selective recovery of Si from post-used solar cells. For the acid solution concentration, the 3M HCl solution derived from the previous experiment was used.
The reaction was carried out with reaction time of 60 min and the ultrasonic intensity of 150 W. After the reaction, the solar cells were washed sufficiently with distilled water and dried in a drying oven (100°C) for 24h, and decompression filtration was performed on the HCl solution that had reacted with the solar cells. XRD and XRF analysis were carried out on the dried solar cells after crushing them with a mortar and the filtered solution was analyzed by ICP-Full Scan.
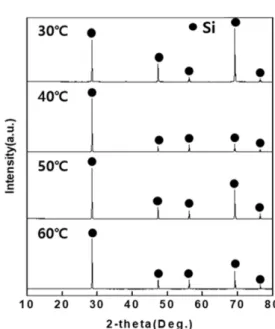
The XRD analysis result for dried solar cells are shown in Fig. 6. From the XRD analysis result, no
impurity (Al, Zn) phase was detected, and it was verified that only Si phases were detected under all temperature conditions of 30, 40, 50, 60°C. In addition, the XRF analysis result for dried solar cells are shown in Table 4.
The XRF analysis result confirmed that the purity of Si was 99% or higher under all temperature conditions of 30, 40, 50 and 60°C.
The ICP-Full Scan analysis result of the filtered solution after decompression filtration is shown in Table 5. From the ICP-Full Scan result, it can be confirmed that content of Al, Ag, etc. were highest at 60°C. For Ag, since only trace amounts were detected at 30, 40, and 50°C conditions excluding 60°C, this indicates that HCl is not suitable for the removal of Ag.
Fig. 6. XRD analysis result for solar cells after drying–
temperature.
Table 4. XRF analysis result for solar cells after drying – temperature (Unit: %)
Analyzed element
Temperature (℃) Si Al Total
30 99.91 0.09
40 99.91 0.09 100
50 99.87 0.13
60 99.85 0.15
Changes to the solar cell weight before and after the experiment are shown in Table 6. The weight of the solar cells before the experiment was 30°C 10.09g, 40°C 10.02g, 50°C 10.12g, and 60°C 10.21g, respectively, and it decreased to 30°C 8.86g, 40°C 8.79g, 50°C 8.81g, and 60°C 8.98g, respectively, after the experiment. Using the XRF analysis result of Table 4 and Equation (1), the recovery efficiency was calculated to be 30°C 96.68%, 40°C 97.66%, 50°C 97.92%, and 60°C 97.93% and the highest recovery efficiency was verified to be 97.93% at 60°C.
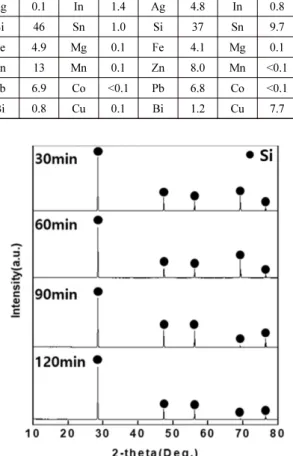
4.3. Reaction time experiment
Experiments were conducted under four conditions of 30, 60, 90, 120min to obtain the optimal reaction time for the recovery of Si from post-used solar cells. For the HCl concentration and reaction temperature, the 3M HCl and 60°C derived from the previous experiment were used. The experiment was carried out with the ultrasonic intensity of 150 W. After the reaction, the solar cells were washed sufficiently with distilled water and dried
in a drying oven (100°C) for 24h, and decompression filtration was performed on the HCl solution that had reacted with the solar cells. ICP-Full Scan analysis was carried out for the filtered solution and XRD and XRF analysis were carried out on the dried solar cells after crushing them with a mortar.
From the XRD analysis result in Fig. 7, it was verified that Al was removed and only Si phases were detected due to the reaction with the HCl solution for all four conditions of 30, 60, 90, 120min. The XRF analysis result in Table 7 confirmed that purity of Si was 99% or higher under all conditions of 30, 60, 90, 120min and it
Table 5. ICP-Full scan for the filtered solution – temperature
Analyzed element and content (mg/L)
30℃ 40℃ 50℃ 60℃
Al 1000 Ni 0.5 Al 990 Ni 0.5 Al 1100 Ni 0.5 Al 1300 Ni 0.5
Ag <0.1 In 1.4 Ag <0.1 In 1.4 Ag 0.1 In 1.4 Ag 4.8 In 0.8
Si 37 Sn 0.7 Si 26 Sn 0.7 Si 46 Sn 1.0 Si 37 Sn 9.7
Fe 5.0 Mg 0.1 Fe 5.8 Mg 0.1 Fe 4.9 Mg 0.1 Fe 4.1 Mg 0.1
Zn 14 Mn 0.1 Zn 12 Mn 0.1 Zn 13 Mn 0.1 Zn 8.0 Mn <0.1
Pb 6.1 Co <0.1 Pb 4.8 Co <0.1 Pb 6.9 Co <0.1 Pb 6.8 Co <0.1
Bi 0.5 Cu 0.1 Bi 0.8 Cu 0.1 Bi 0.8 Cu 0.1 Bi 1.2 Cu 7.7
Table 6. Solar cell weight before and after the experiment and Si recovery efficiency – temperature
Sample
(℃) Before the
experiment (g) After the
experiment (g) Recovery efficiency (%)
30 10.09 8.86 97.68
40 10.02 8.79 97.66
50 10.12 8.81 96.92
60 10.21 8.98 97.93
Fig. 7. XRD analysis result for solar cells after drying – time.
can be seen that the Si purity is highest for 90min at 99.92%.
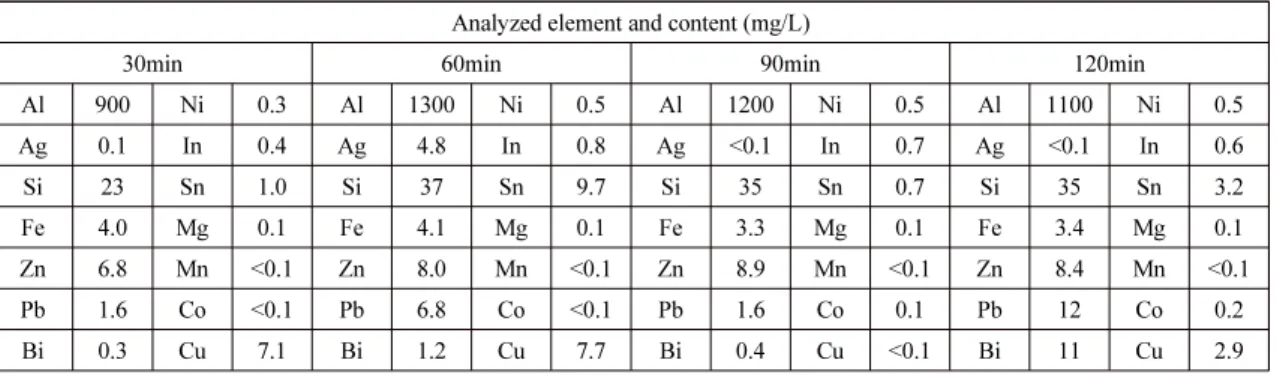
The ICP-Full Scan analysis result of the filtered solution is shown in Table 8. From the ICP-Full Scan analysis result, detected Ag contents were low at 30, 90, 120min conditions and the detected contents of impurities like Al, Ag, Zn, etc. were verified to be highest at 60min.
Order of the next highest contents of Al that were detected were verified to be for 90min, 120min, 30min.
The weight of solar cells before and after the experi- ment and the Si recovery efficiency calculation result are shown in Table 9. The weight of the solar cells decreased from 30min 10.09g, 60min 10.21g, 90min 10.14g, 120min 10.25g, respectively, to 30min 8.95g, 60min 8.98g, 90min
8.91g, 120min 9.14g, respectively.
The recovery efficiency was calculated by using Equation (1). The recovery efficiency were calculated to be 30min 98.45%, 60min 97.93%, 90min 97.80%, 120min 99.24% as shown in Table 9 and the highest Si recovery efficiency of 99.24% was obtained for 120min.
From the XRD analysis result, Al phase was not detected because it was removed by HCl and it was verified that only Si phases were detected at 30, 60, 90, 120min conditions. For the XRF analysis result, purity of Si was 99% or higher for all four conditions. In addition, the highest purity was verified to be for 90min, and they were high in the following order of 120min, and 60min, 30min. The recovery efficiency was highest for 120min at 99.24%.
4.4. Ultrasonic Intensity experiment
The cavitation effect is that when ultrasonic waves are generated in a solution, decompression and pressure increase repeatedly appear. At the ultrasonic wave, the pressure is formed by the half-cycle on the decompression side, during which minute bubbles are generated due to
Table 7. XRF analysis result for solar cells after drying –
time (Unit: %) Analyzed element
Time (min) Si Al Total
30 99.68 0.32
60 99.85 0.15 100
90 99.92 0.08
120 99.85 0.15
Table 8. ICP-Full scan for the filtered solution – time Analyzed element and content (mg/L)
30min 60min 90min 120min
Al 900 Ni 0.3 Al 1300 Ni 0.5 Al 1200 Ni 0.5 Al 1100 Ni 0.5
Ag 0.1 In 0.4 Ag 4.8 In 0.8 Ag <0.1 In 0.7 Ag <0.1 In 0.6
Si 23 Sn 1.0 Si 37 Sn 9.7 Si 35 Sn 0.7 Si 35 Sn 3.2
Fe 4.0 Mg 0.1 Fe 4.1 Mg 0.1 Fe 3.3 Mg 0.1 Fe 3.4 Mg 0.1
Zn 6.8 Mn <0.1 Zn 8.0 Mn <0.1 Zn 8.9 Mn <0.1 Zn 8.4 Mn <0.1
Pb 1.6 Co <0.1 Pb 6.8 Co <0.1 Pb 1.6 Co 0.1 Pb 12 Co 0.2
Bi 0.3 Cu 7.1 Bi 1.2 Cu 7.7 Bi 0.4 Cu <0.1 Bi 11 Cu 2.9
Table 9. Solar cell weight before and after the experiment and recovery efficiency – time
Sample (min) Before the experiment (g) After the experiment (g) Recovery efficiency (%)
30 10.09 8.95 98.45
60 10.21 8.98 97.93
90 10.14 8.91 97.80
120 10.25 9.14 99.24
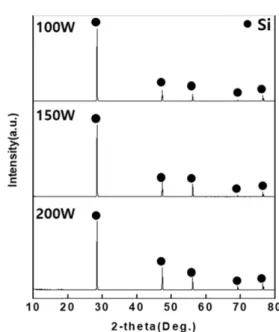
the cavitation phenomenon. The generated bubble contracts at the increased pressure and expands at the reduced pressure. When the bubble exceeds a certain pressure, the bubble contracts and explodes to generate a large shock wave. Contaminants on the surface of the wash are removed by the destruction of these bubbles. The ultrasonic cavitation effect enables cleaning to the inside of the object in a short time compared to agitation, and the surface cleaning effect is more excellent. After use, most of the impurities present in the photovoltaic cell are adsorbed to the photovoltaic cell surface, so an ultrasonic cleaner that is more suitable for removing impurities than stirring was used. Experiments were conducted by controlling the ultrasound output to obtain the optimal ultrasound intensity for the recovery of Si from post-used solar cells. Since the intensity is insigni- ficant for up to 30% of the maximum ultrasound output for an ultrasonic cleaner, the experiment was performed for three conditions of 100W, 150W, 200W which are 40% of the maximum ultrasound output or higher. The experiment was conducted with HCl concentration of 3M, reaction temperature of 60°C, and reaction time of 120min. After the reaction, the solar cells were washed sufficiently with distilled water and dried in a drying oven (100°C) for 24h, and decompression filtration was performed on the HCl solution that had reacted with the solar cells. XRD and XRF analysis were carried out on the dried solar cells after crushing them with a mortar and ICP-Full Scan was carried out for the filtered solution.
From the XRD analysis result in Fig. 8, only Si phases were detected for the three conditions of 100W, 150W, 200W and it was verified that impurities (Al, Zn) that had been detected during XRD analysis of the raw samples could not be detected because they had been removed by the HCl solution.
The XRF analysis result for dried solar cells are shown in Table 10. The analysis result confirmed that the purity of Si was 99% or higher under all three conditions and the highest purity of 100% can be seen at the highest ultrasound intensity of 200W.
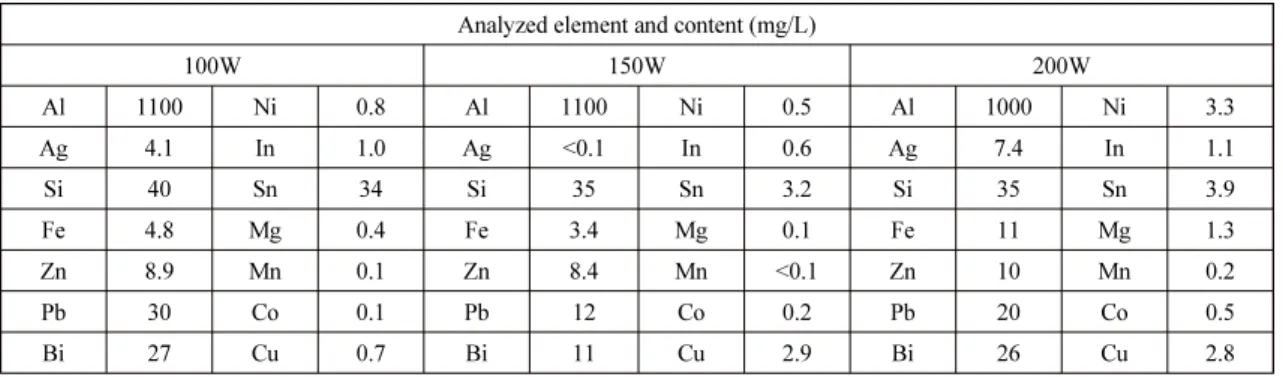
The ICP-Full Scan analysis result of the filtered solution is shown in Table 11. From the analysis result, it was possible to verify that Al and Ag had been removed by HCl while this was not the case for Si. The Al content of the filtered solution was high in the order of 150W≥
100W>200W while the Ag content was high in the order of 200W≥100W>150W.
The weight of the solar cells before the experiment was 100W 10.15g, 150W 10.25g, 200W 10.16g, respectively, and it decreased to 100W 8.97g, 150W 9.14g, 200W 9.00g, respectively, after the experiment. The Si recovery efficiency that were calculated by using Equation (1) were 100W 98.43%, 150W 99.24%, 200W 98.68% and the highest recovery efficiency was verified to be 99.24%
for 150W shown in Table 12.
Fig. 8. XRF result of the solar cell after drying – ultrasonic intensity.
Table 10. XRF Result of the Solar Cell after Drying – Ultra- sonic intensity (Unit: %)
Analyzed element
Ultrasound intensity (W) Si Al Total
100 99.97 0.03
100
150 99.85 0.15
200 100 -
ICP-OES analysis was performed to measure the purity of the recovered Si powder using the optimal process conditions derived through experiments. The analytical results are shown in Table 13. The purity of Si was found to be 99.88%.
5. Conclusions
In this study, HCl solution and the cavitation effect of an ultrasonic cleaner were used to selectively recover Si from the post-use solar cells. To recover Si, the optimal condition was derived for each concentration, reaction temperature, reaction time, and ultrasonic intensity of the HCl solution, and after the experiment, solar cells were dried and crushed to perform XRD and XRF analysis to calculate the purity and recovery efficiency of the recovered Si. From the experiment results, the optimal process conditions for the selective recovery of Si from solar cells were derived to be 3M HCl, 60°C, 120min, 150W, and the Si purity and the recovery
efficiency were verified to be 99.85% and 99.24%
respectively. When the photovoltaic cell was leached using the HCl solution, it was confirmed that the Al content was detected as high as the ICP analysis of the filtrate solution, but the Ag content was detected in a very small amount. This is thought to be because Ag is precipitated with AgCl in the entire pH range when it is more than 10 ppm. This shows that HCl solution is suitable for removing Al but not for removing Ag.
Acknowledgement
This work was supported by Korea Environment Industry & Technology Institute (KEITI) through R&D Project for recyclability of non-recyclable products Program, funded by Korea Ministry of Environment (MOE) (NTIS : 1485017728).
Table 11. ICP-Full scan of the filtered solution – ultrasonic intensity Analyzed element and content (mg/L)
100W 150W 200W
Al 1100 Ni 0.8 Al 1100 Ni 0.5 Al 1000 Ni 3.3
Ag 4.1 In 1.0 Ag <0.1 In 0.6 Ag 7.4 In 1.1
Si 40 Sn 34 Si 35 Sn 3.2 Si 35 Sn 3.9
Fe 4.8 Mg 0.4 Fe 3.4 Mg 0.1 Fe 11 Mg 1.3
Zn 8.9 Mn 0.1 Zn 8.4 Mn <0.1 Zn 10 Mn 0.2
Pb 30 Co 0.1 Pb 12 Co 0.2 Pb 20 Co 0.5
Bi 27 Cu 0.7 Bi 11 Cu 2.9 Bi 26 Cu 2.8
Table 12. Change in weight before and after the experiment and the recovery efficiency – ultrasound intensity Sample (W) Before the experiment (g) After the experiment (g) Recovery efficiency (%)
100 10.15 8.97 98.43
150 10.25 9.14 99.24
200 10.16 9.00 98.68
Table 13. Chemical composition of Si obtained by optimal conditions analyzed by ICP-OES
Element Si Al Fe Ca Mg Na K Ni O
Result (%) 99.88 0.050 0.005 0.004 0.002 0.001 0.001 0.003 0.056
References
1. Aanesen, K., Heck, S., Pinner, D., 2012 : Solar power:
Darkest Before Dawn, Mckinsey report, pp.3-15.
2. World Energy Outlook, 2018, International Energy Agency (IEA).
3. Global Market Outlook For Solar Power, 2019 – 2023, 2019, May, Solar Power Europe.
4. J. Tao., S. Yu., 2015 : Review on feasible recycling pathways and technologies of solar photovoltaic modules, Solae Energy Materials&Solar Cells, 141, pp.108-124.
5. S. Weckend., A. Wade., G. Heath., 2016 : End-of-life management: Solar photovoltaic panels.
6. Latunussa, C.E.L., Ardente, F., AndreaBlengini, G., et al., 2016 : Life Cycle Assessment of an innovative recycling process for crystalline silicon photovoltaic panels, Solar EnergyMaterials&SolarCells,156, pp.101-111.
7. Hsi, H. W., Shin, W.J., Wang, L., et al., 2017 : Strategy and technology to recycle wafer-silicon solar modules,”
Solar Energy, 144, pp.22-31.
8. G. L. T. Filho., C. A. Rosa., R. M. Barros., et al., 2016 : Study of energy balance and environmental liabilities associated with the manufacture of crystalline Si photo- voltaic modules and deployment in different regions, Sol.
Energy Mater. Sol. Cells, 144, pp.383-394.
9. Federzoni, L., D. Pelletier and J. Rakotoniaina., 2015 : Cabriss: Developing a Circular Economy Based on Re- cycled, Reused and Recovered Indium, Silicon and Silver Materials for Photovoltaic and Other Applications, EUPVSEC, Hamburg.
10. Anna Kuczyńska-Łażewska, Ewa Klugmann-Radziemska, Zuzanna Sobczak, et al., 2018 : Recovery of silver metallization from damaged silicon cells, Solar Energy Materials and Solar Cells, 176, pp.190-195.
11. Eurostat, Renewable energy statistics. http://epp.eurostat.
ec.europa.eu/statistics_explained/index.php/Renewable_
energy_statistics#Electricity, 2010.
12. Ndiaye, A., Charki, A., Kobi, A., et al., 2013 : Degrations of silicon photovoltaic modules: A literature review, Solar Energy, 96, pp.140-151.
이 동 헌
• 국립부경대학교 신소재시스템공학과 졸업
• 현재 국립부경대학교 마린융합디자인공학과 (첨단소재공학) 석사과정
고 민 석
• 국립부경대학교 신소재시스템공학과 졸업
• 현재 국립부경대학교 마린융합디자인공학과 (첨단소재공학) 석사과정
왕 제 필