*****†강용혁(교신저자) : 한국에너지기술연구원 신재생 에너지자원센터
E-mail : [email protected], Tel : 042-860-3518
*박년배 : 한국에너지기술연구원 에너지정책연구실
**박상용 : 한국에너지기술연구원 에너지정책연구실
***최동구 : 한국에너지기술연구원 에너지정책연구실
****김현구 : 한국에너지기술연구원 신재생에너지자원 센터
*****†Kang Yong-Heack(corresponding author) : New-Renewable Energy Resource Center, Korea Institute of Energy Research E-mail : [email protected], Tel : +82-42-860-3518
*Park Nyun-Bae : Energy Policy Research Team, Korea Institute of Energy Research
**Park Sang-Yong : Energy Policy Research Team, Korea Institute of Energy Research
***Choi Dong-Gu: Energy Policy Research Team, Korea Institute of Energy Research
****Kim Hyun-Goo : New-Renewable Energy Resource Center, Korea Institute of Energy Research
신재생에너지 자원지도의 비즈니스 모델 개발
Business Model of Renewable Energy Resource Map
박년배*․박상용**․최동구***․김현구****․강용혁*****†
Nyun-Bae Park*, Sang Yong Park**, Dong Gu Choi***, Hyun-Goo Kim**** and Yong-Heack Kang*****†
(Received 04 January 2015; accepted 12 February 2016)
Abstract
: Geographic information system (GIS) based renewable energy resource map including potential analysis can play a crucial role not only to develop the national plan for renewable energy deployment but also to make strategic investment decision in the private sector. Korea Institute of Energy Research (KIER) has been developing domestic maps about several resources such as solar, wind, hydro, biomass, and geothermal, as well as conducting research on methodologies for potential analysis. Furthermore, the institute is trying to transfer related technologies and know-how to foreign countries, recently. In this context, the main purpose of this study is to introduce the business model of renewable energy resource map. From the value chain analysis, we focus on the government-side market in foreign countries, such as the development of the national level renewable energy resource map and the support of the national renewable energy plan. For about 180 countries, we segment the customers according to the consideration of economic capacity, renewable energy resource capacity, existence of renewable resource map, current portion of renewable energy facility capacity, and renewable energy policies, and we conclude that the target customers are non-Organization for Economic Co-operation and Development (non-OECD) countries or some OECD countries, their per capita GDP are under the average among OECD countries, that do not have renewable resource map yet.We segment the target customers into four groups, and suggest different strategies for market positioning and financing strategy based on Strengths, Weaknesses, Opportunities, Threats (SWOT) analysis. This study can help to develop the business strategy about the development of renewable energy resource map in foreign countries.
Key Words : 신재생에너지 자원 지도(Renewable energy resource map), 잠재량 분석(Potential analysis), 비즈니스 모델 (Business model), 가치 사슬(Value chain), 시장 세분화(Market segmentation), 스왓 분석(SWOT analysis) [논문] 한국태양에너지학회 논문집
Journal of the Korean Solar Energy Society
Vol. 36, No. 1, 2016 IS S N 1 5 9 8 - 6 4 1 1 http://dx.doi.org/10.7836/kses.2016.36.1.039
1. 서 론
전세계적으로 온실가스 감축과 에너지 수입 의존도 저감, 녹색 일자리 등을 이유로 태양 광, 풍력, 바이오매스 발전 등 신재생에너지 보급이 빠르게 증가하고 있다.
1)
일반적으로 재생에너지는 고갈성 저량(stock)을 사용하는 것이 아니라 일정 시간의 유량(flow)을 이용 하기 때문에, 지역별 이용가능한 에너지의 양 의 제한, 간헐성, 경제성 등이 보급의 주요 장 애요인이 되고 있다. 기후변화 완화를 위한 온 실가스 감축과 에너지 안보 개선 측면에서 각 국은 신재생에너지 보급 목표를 설정하고 있 으며, 이때 신재생에너지 자원 지도는 중요한 기초 자료가 된다.신재생에너지 잠재량 지도는 지리정보시스 템과 결합하여 지역별 신재생에너지원별(태 양, 풍력, 지열, 수력, 바이오매스 등) 자원량 (또는 잠재량)에 대한 정보를 제공하는 지도를 의미한다.
2)
신재생에너지 자원지도는 신재생 에너지의 잠재량과 환경적, 사회적 제약조건 등에 대한 정보를 의사결정자에게 제공함으로 써, 신재생에너지 투자 및 계획 수립시 중요한 선결조건이 되고 있다.3)
신재생에너지의 기술 적 잠재량 평가의 주요 이점 중 하나는 신재생 에너지 개발 잠재량의 상한에 대한 추정치를 알 수 있다는 것이다.4)
또한 태양, 풍력 등 신 재생에너지 보급의 적정 부지 선정에 도움이 된다.5)
미국, 영국, 한국, 일본 등 자국에서 상 세 재생에너지 자원지도를 구축한 국가들이 있는 한편, 국제재생에너지기구(International Renewable Energy Agency, IRENA) 등은 협 력사업을 통해 전지구적 수준에서 신재생에너 지 잠재량 지도를 수집하여 제공하고 있다6)7)8)9)
. 본 연구는 신재생에너지 보급 목표 설정 및 투자 계획 수립시 기초 자료가 되는 신재생에너지 자원지도의 비즈니스 모델 개발을 목적 으로 하며, 특히 외국을 대상으로 자원지도 개 발시 시장 세분화, 재정 전략 등을 제시하고 있다. 본 연구는 신재생에너지 자원지도의 수 요처 파악, 가치 제안, 재원 마련 전략 등을 통 해 해외 신재생에너지 자원지도 시장 진출에 기여할 것이다.
Fig. 1 Renewable energy resource maps produced by the Korea Institute of Energy Research
2. 비즈니스 모델의 이론적 검토
논문 데이터베이스에서 비즈니스 모델의 용 어 검색을 한 연구에 따르면, 비즈니스 모델에 대한 논문은 1995년 이후 급격히 증가하였다
10)11)
. 비즈니스 모델에 대한 연구가 급증하면 서 연구 목적에 따라 비즈니스 모델을 다르게 정의하기도 하지만, 비즈니스 모델의 핵심은 비즈니스 활동이 고객에게 가치를 제공하고, 고객들로 하여금 그 가치에 대해 지불하게 함으로써 수익을 창출하는 것이다
12)
. 비즈니 스 모델은 사업을 통해 기술 또는 아이디어로 부터 돈을 버는 방법을 의미하며, 새로운 모 험사업의 시장 예시와 비교, 성공 요인 발굴 등을 분석하는 유용한 도구이다.13)
비즈니스 모델의 구성 요소는 가치 제안과 전달 형태의 두 가지로 정의할 수 있다.
14)15)16)
전달 형태는 고객과의 인터페이스, 하부구조, 수익 모델로 세분화된다.17)18)19)
Ritcher(2013a) 에 따르면 네 가지 구성 요소의 정의는 다음 과 같다.20)
Osterwaler and Pigneur(2010)는 비즈니스 모델의 구성 요소를 9가지로 세분화하고 있다. 비즈니스 모델의 구성 요소가 세분 화될수록, 비즈니스 모델에 대해 이해관계자 들은 더 명확히 이해할 수 있을 것이다.
21)
∙ 가치 제안 : 고객을 위해 가치를 창출하 고 사업을 통해 수익을 낼 수 있는 제품 및 서비스를 의미
∙ 고객과의 인터페이스 : 고객과의 관계, 고객 세분화, 전달 통로 등으로 구성
∙ 하부구조 (또는 가치 사슬) : 기업이 가 치를 창출하는 과정을 의미하며, 자산, 노하우, 파트너쉽 등을 포함
∙ 수익 모델 : 고객에게 가치를 제공하기 위한 비용과 가치 제공을 통해 창출된 수익간의 관계를 의미
비즈니스 모델은 새로 만들어지는 시장에 특히 효과적인데, 최근에는 재생에너지의 비 즈니스 모델에 대한 연구들도 발표되고 있다.
재생에너지에 대한 비즈니스 모델을 소개한 연구들도 다수 있는데, Frantzis et al.(2008) 은 정부의 정책 활동을 통해 태양광 비즈니스 모델이 장려되었던 과정을 검토하고 있다.
22)
Okkonen and Suhonen(2010)은 핀란드의 목 재 연료를 이용한 열 생산 사업에 비즈니스 모델을 적용하여 5개의 비즈니스 모델을 제시 하고 있다.23)
Würtenberger et al.(2012)은 건 축물에 재생에너지 기술을 접목하는 10개의 비즈니스 모델을 소개하고 있다.24)
전력회사들의 재생에너지에 대한 기존 비즈 니스 모델을 검토하고 신규 비즈니스 모델을 분석한 연구들도 다수 있다. Lehr(2013)은 미 국의 발전 부문에 초점을 맞추어, 전력회사의 신규 비즈니스 모델을 장려하는 새로운 규제 모델을 제안하고 있다.
25)
Richter(2012, 2013a, 2013b)는 독일의 전력회사에 비즈니스 모델을 적용하여, 전력회사 측면의 비즈니스 모델과소비자 측면의 비즈니스 모델을 분석하고 있
다.
13)20)26)
독일의 전력회사 관리자들과의 심층면담을 통해 전력회사들이 향후 지속가능한 비즈니스 모델로서 소비자 측면의 비즈니스 모델 보다는 전력회사 측면의 비즈니스 모델 을 선호하는 이유를 제시하고 있다.
13)
아울러 전력회사 입장에서 분산형 태양광 발전의 기 회와 위협 요인을 제시하고 있다.20)
Loock (2012)는 재생에너지 투자자들의 비즈니즈 모 델 성공 요인에 대한 선호도를 계산하였는데, 재생에너지 산업에서는 최고의 기술과 최저 가격보다 다른 요인들이 선호될 수 있음을 시 사하고 있다.27)
전반적으로 재생에너지의 비즈니스 모델 연 구의 주된 목적은 두 가지로 구분된다. 첫 번 째는 시장의 이해관계자들에게 재생에너지 시 장의 신규 비즈니스 아이템에 대한 중요한 통 찰을 제공하기 위함이다. 두 번째는 정책결정 자들에게 재생에너지 기술의 보급을 촉진하기 위한 규제 정책을 설계하는데 유용한 통찰을 제공하기 위함이다.
3. 분석틀 및 자료 수집
신재생에너지 자원지도 및 잠재량 분석의 비즈니스 모델을 개발하기 위하여, 본 연구에 서는 비즈니스 모델의 구성 요소인 가치 제안, 고객과의 인터페이스 중에서 특히 고객 세분 화, 가치 사슬, 수익 모델 등을 분석하였다.
신재생에너지 자원지도의 해외 시장의 세분 화를 위해, 세계 180여 개국의 신재생에너지 자원지도의 상세 수준 여부, 국가 경제력, 신재 생 발전설비의 비중, 신재생에너지 보급 목표 와 주요 신재생에너지 정책(발전차액지원, 신 재생에너지공급의무화 등) 시행 여부에 대한 자료를 IEA(International Energy Agency)
28)
,IRENA, REN21(Renewable Energy Policy Network for the 21st Century) 등으로부터 수집하였다.
4. 비즈니스 모델
4.1 가치 제안
신재생에너지 자원지도 및 잠재량 분석은 정부와 산업계, 기술 개발자에게 유용한 가치 를 제공해 준다.
우선 정부의 정책결정자에게는 위치별 신재 생에너지의 잠재량 정보를 제공해줌으로써 신 재생에너지 보급 목표 설정 및 보급 계획 수 립시 보급 목표의 적절성과 지역별 잠재량에 대한 논란을 해소함으로써 행정 비용을 줄일 수 있으며, 신재생에너지의 효과적인 보급을 통해 부수적으로 에너지 수입비용을 절감할 수 있다.
산업계와 신재생에너지 투자자에게는 태양 광 및 풍력 등 대규모 단지와 소규모 사업의 입지에 따른 사전 타당성을 분석할 수 있는 잠재량 자료를 제공함으로써 자료 수집 비용 을 절감해주고, 좋은 위치 선정에 따른 수익을 제고해 줄 수 있다. 신재생에너지 자원지도 웹 서비스를 무료로 제공하되, 사업자를 대상으 로 하는 상세자료는 유료화하여 신재생에너지 자원지도의 R&D(Research and development, 연구개발)에 재투자할 경우 자원지도 제작 순 비용을 경감할 수 있다.
신재생에너지 자원지도의 기술 개발자에게 는 신재생에너지 자원지도 개발 과정에서 특 허 확보와 기술 이전, 기술 사업화 등 부가적 인 수익을 가져다 줄 수 있다.
4.2 고객 세분화
앞에서 서술한 바와 같은 가치를 지닌 신재
생에너지 자원지도의 고객을 세분화하기 위하 여, 본 연구에서는 해외 정부를 대상으로 전략 적으로 진출하기 위해 해외 시장을 세분화하 였다.
세계 180여개 국가 중에서 경제력과 신재생 에너지 자원지도 구축 여부, 신재생에너지 발 전설비 비중을 토대로 4사분면으로 고객 세분 화하였다. 4사분면에서 가로축은 경제력을 기 준으로 구분하였으며 OECD(Organization for Economic Co-operation and Development, 경제협력개발기구) 회원국 여부로 구분한 다 음, 다시 평균 소득 수준으로 세분화하였다.
세로축은 신재생에너지 자원지도(상위 수준 의 자국제작 자원지도) 유무로 구분한 다음, 해당 국가의 신재생에너지 발전설비 비중이 총 발전설비에서 30% 이상 여부로 구분하였 다. 참고로 상위수준의 자국지도 제작 국가는 25개국이며, 국제협력으로 중하위 수준의 자 원지도를 구축한 국가는 100개국이다. 시장 고객은 자원지도가 없는 국가들과 중하위 수 준의 자원지도를 구축한 국가들을 대상으로 하였다.
고객 세분화 결과는 Table 1, Fig. 2와 같다.
신재생에너지 자원지도의 비즈니스 모델의 핵 심 고객군을 아직 신재생에너지 자원지도가 구축되지 않은 국가들 중심으로 4개 그룹으로 구분하였다. 제1 그룹은 저소득 비OECD 회원 국이면서, 신재생에너지 자원지도는 아직 구 축되지 않았지만 신재생에너지를 상당 수준 활용하고 있는 국가군이다(베네수엘라, 가봉 등). 제2 그룹은 저소득 비OECD 회원국이면 서, 신재생에너지 자원지도가 없고, 향후 신재 생에너지 확대 전망이 좋은 국가군이다(몽고, 우크라이나 등). 제3 그룹은 중소득 비OECD 회원국이면서, 신재생에너지 자원지도가 없 고, 향후 신재생에너지가 상당히 확대될 가능
Existence of Resource Map
Renewable Capacity
>30%
Brazil, Sri Lanka, Albania, Namibia
Italy, Spain, New Zealand
Germany, Canada, Switzerland, Sweden, Austria Renewable
Capacity
<30%
China, Thailand,
Bulgaria Saudi Arabia Slovenia, South
Korea
United States, Japan, United Kingdom, Australia, Ireland
No Resource Map
Renewable Capacity
>30%
[Group 1]
Nigeria, Venezuela, Colombia, Philippines, Peru, Romania, Vietnam, Angola, Ecuador, Guatemala, Costa Rica, Ghana, Ethiopia, Kenya, Serbia, Tanzania, Côte d'Ivoire, Congo, Dem.
Rep., Bolivia, Paraguay, Cameroon, El Salvador, Zambia, Nepal, Honduras, Bosnia and Herzegovina, Georgia, Mozambique, Cambodia, Congo, Rep., Sudan and South Sudan, Zimbabwe, Nicaragua, Armenia, Macedonia, Tajikistan, Kyrgyzstan, Montenegro
[Group 1]
Croatia, Uruguay, Panama, Latvia, Gabon
[Group 4]
Turkey, Chile, Portugal
Norway,
Denmark, Finland, Iceland
Renewable Capacity
<30%
[Group 2]
India, Indonesia, Iran, South Africa, Egypt, Pakistan, Kazakhstan, Iraq, Algeria, Ukraine, Bangladesh, Morocco, Libya, Azerbaijan, Belarus, Cuba, Syria, Dominican Republic, Uzbekistan, Tunisia, Turkmenistan, Yemen, Jordan, Botswana, Senegal, Jamaica, Mongolia, Haiti, Benin, Moldova, Eritrea
[Group 3]
Russia, Argentina, United Arab Emirates, Malaysia, Singapore, Hong Kong, Qatar, Kuwait, Oman, Lithuania, Lebanon, Bahrain, Trinidad and Tobago, Cyprus, Brunei
Darussalam, Malta
[Group 4]
Mexico, Poland, Israel, Greece, Czech Republic, Hungary, Slovakia, Estonia
France, Netherlands, Belgium, Luxembourg
Under per capita average GDP of Non-OECD
Over per capita average GDP of Non-OECD
Under per capita average GDP of OECD
Over per capita average GDP of OECD
Non-OECD OECD
Table 1. Customer segmentation of renewable resource map business
* per capita average GDP(Gross Domestic Product) of OECD : 31,726US$, per capita average GDP of Non-OECD : 6,436US$. Renewable capacity and per capita average GDP indicate numbers in 2011.
Fig. 2 Customer segmentation plot of renewable resource map business
* Renewable capacity and per capita average GDP indicate numbers in 2011.
Group Strength [S] and Opportunity [O] Weakness [W] and Threat [T] Enterprise
(Customer Needs) Financing
1
[S] Accumulated experiences of resource map and information exchange with Gabon, etc.
[W] Personnel shortage for foreign support
Building renewable energy resource map, establishing
renewable energy master plan
ODA (Official Development Assistance) [O] High technological potential
of renewable energy. No renewable energy resource map
[T] Low income level
2
[S] Accumulated experiences of resource map and information exchange with Ukraine, etc.
[W] Personnel shortage for foreign support
Building renewable energy resource map, establishing
renewable energy master plan [O] Good prospect for domestic
renewable energy market. No renewable energy resource map
[T] Poor renewable energy market and infrastructure. Low income level
3
[S] Accumulated experiences of resource map and information exchange with Singapore, etc.
[W] Personnel shortage for foreign support
Building renewable energy resource map
GCF
(Green Climate Fund)
[O] Good prospect for domestic renewable energy market. No renewable energy resource map
[T] Poor renewable energy market and infrastructure
4
[S] Accumulated experiences of resource map and preparations for joint-research
[W] Personnel shortage for foreign support
Co-building renewable energy resource map
Joint Research
[O] Synergy effect or win-win effect between OECD countries.
Opportunity to show Korean power for resources map
[T] High prospective of other high-income OECD countries’
market penetration
Table 2. SWOT analysis of renewable energy resource map business by customer targets
* [S] Strength, [W] Weakness, [O] Opportunity, [T] Threatening
성이 높은 국가군이다(러시아, UAE 등). 제4 그 룹은 중소득 OECD 회원국이면서, 신재생에 너지 자원지도가 없으며, 향후 기후변화대응 및 에너지안보 차원에서 신재생에너지에 대한 관심이 지속적으로 높아질 국가군이다(멕시 코, 터키 등).
4개 그룹별 고객의 수요 및 SWOT(Strengths, Weaknesses, Opportunities, Threats) 분석을 하고, 자금조달 방안을 Table 2에 제시하였다.
신재생에너지 자원지도 수요 국가의 경제력을 고려하여, 제1, 2 그룹은 공적개발원조(Official Development Assistance, ODA)를 활용하고, 제3 그룹은 녹색기후기금(Green Climate Fund, GCF)를 활용하고, 제4 그룹은 상호출자를 통 해 공동연구하는 방안을 검토하였다.
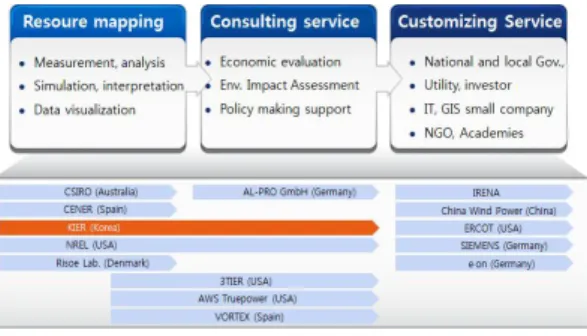
4.3 가치 사슬
신재생에너지 자원지도의 가치 사슬은 기본 적으로 세 단계로 구성된다(Fig. 3 참고). 첫번째 단계는 태양, 풍력, 지열 등 잠재량 자료의 측정, 수치모의, 시각화 등 자원지도를 제작하는 과정 이다. 두번째 단계는 사업의 예비타당성 평가, 환경영향평가, 정책수립 지원 등 1차 자료를 이 용한 컨설팅 단계이다. 세번째 단계는 신재생에 너지 자원지도의 자료를 토대로 정부, 지자체, NGO, 기업 등이 의사결정 및 부가가치를 창출 하는 과정이다. 신재생에너지 자원지도를 제작 하는 기관들 마다 가치 사슬 상의 역할이 다른 데, 국가 자원지도는 주로 국립연구소 등에서 제 작하고, 민간 컨설팅 기관은 주로 잠재량 자료를 이용하여 컨설팅을 제공하거나 기상, 풍력 등 일 부 신재생에너지에 대한 자원 지도를 제작하고 있다. 자원지도 제작과 컨설팅 제공을 한 기관에 서 수행하기도 하고, 서로 다른 기관이 분담하기 도 하는데, 한국에너지기술연구원은 자원지도 제작과 컨설팅 제공 모두를 수행하고 있다.
Fig. 3 Value chain of renewable energy resource map business
4.4 수익 모델
해외 국가를 대상으로 한 신재생에너지 자 원지도 비즈니스 모델의 수익 모델은 자원지 도 제작 인프라 구축, 자원지도 생성, 자원지 도 정보 서비스 제공, 자원지도 정보 유통체계 구축, 정책지원 컨설팅, 기술 특허, 교육 훈련
Revenue
model Description Potent
ial
Building resource map infrastructure
Building measurement network for resource data, data communication and storage system, database integration, data calibration and quality control, data standardization, equipment maintenance support, continuous monitoring, etc.
High
Producing resource map
Resource mapping using measurement data, satellite data, numerical model, etc.
High
Information services of resource map
Information services based on renewable energy resource map
High
Building information channel of resource map
Building information distribution channel using web, mobile devices, etc.
Middle
Consulting
Feasibility assessment of renewable energy equipment technology, policy-making support such as national renewable energy master plan
Middle
Licensing Technology transfer and
patent rent Low
Education
and training Experts training and
know-how transfer Low Table 3. Revenue model of renewable energy resource
map business
으로 구분할 수 있다. 수익 모델 중에서 상대 적으로 비중이 높은 것은 자원지도 제작 인프 라 구축, 자원지도 제작, 자원지도 서비스 제 공이다(Table 3 참고).
5. 결 론
신재생에너지 자원지도는 국가 차원의 신재 생에너지 기본계획 수립과 투자자 차원의 신 재생 설비 입지 결정시 중요한 기초 자료가 된다. 본 연구는 비즈니스 모델에 대한 이론적 검토를 통해 신재생에너지 자원지도의 해외 시장 진출을 위한 비즈니스 모델을 분석하고 자 하였다.
본 연구는 해외 신재생에너지 자원지도 시 장을 경제력, 신재생에너지 자원지도 보유 여 부, 신재생에너지 발전설비 비중 등 복합적 지표를 이용하여 최초로 세분화하였다. 현재 상세 수준의 신재생에너지 자원지도를 구축 하지 못한 국가들이 100여개 국가에 이르며, 이 국가들을 경제력과 신재생 발전설비 비 중을 토대로 4개의 핵심 고객군으로 구분하 였다. 아울러, 세분화된 핵심 고객군별 수요 를 파악하고, 강점, 약점, 기회, 위협요인을 분석하는 한편, 공적개발원조, 녹색기후기금, 공동연구 등의 자금 조달 방안을 검토함으 로써 신재생에너지자원지도의 해외 시장 진 출에 대한 방향을 제시하고 있다.
국내 신재생에너지 자원지도의 지속적인 업 데이트와 고도화를 전개해 나가는 한편, 본 연 구에서 분석한 비즈니스 모델을 활용한다면, 해외 신재생에너지 자원지도 개발과 우리 기술의 해외 이전을 보다 효과적으로 수행 하는데 기여할 수 있을 것이다. 향후 핵심고 객군별로 더욱 세분화된 진출 전략을 개발하 는 후속 연구가 필요할 것으로 판단된다.
후 기
본 연구는 2015년도 산업통상자원부의 재원으로 한국에너지기술평가원(KETEP)의 지원을 받아 수 행한 연구과제입니다. (20143010071570)
Reference
1. REN21 (Renewable Energy policy Network for the 21stcentury), Renewables 2014 Global Status Report, REN21, 2014
2. MOTIE (Ministry Of Trade, Industry and Energy) & KEMCO (Korea Energy Management Corporation), 2014 New & renewable energy white paper, MOTIE & KEMCO, 2014 (in Korean) 3. ESMAP (Energy Sector Management Assistance Program), Renewable Energy Resource Mapping Initiative, http://www.esmap.org/RE_Mapping, (Access 31, Dec. 2015)
4. Lopez, A., Roberts, B., Heimiller, D., Blair, N., Porro, G., US renewable energy technical potentials: a GIS-based analysis, NREL, 2012 5. Hernandez, R.R., Hoffacker, M.K., Field, C.B., Efficient use of land to meet sustainable energy needs, Nature Climate Change, Vol.5, pp. 353-358, 2015
6. Kim H.G., Kang Y.H., Cho D.K., Yun C.Y., New & Renewable Energy Resource Map Service, Journal of Wind Energy, Vol.4, No.1, pp. 5-9, 2013 (in Korean)
7. Milbrandt A.R., Heimiller D.M., Perry A.D., Field C.B., Renewable energy potential on marginal lands in the United States, Renewable and Sustainable Energy Reviews, Vol.29, pp.
473-481, 2014
8. Ramachandra T.V., Shruthi B.V., Spatial mapping of renewable energy potential, Renewable and Sustainable Energy Reviews, Vol.11, pp.
1460-1480, 2007
9. IRENA (International Renewable Energy Agency), Global atlas for renewable energy.
http://globalatlas.irena.org, (Access 31, Dec. 2015) 10. Chazinani A., Ventresca M.J., Keywords and Cultural Change: Frame Analysis of Business model Public Talk, 1975-2000, Sociological Forum, Vol.20, No.4, pp. 523-559, 2005 11. Zott C., Amit R., Massa L., The business
model: Recent developments and future research, Journal of Management, Vol.37, No.4, pp.
1019-1042, 2011
12. Teece D.J., Business Models, Business Strategy and Innovation, Long Range Planning, Vol.43, pp. 172-194, 2010
13. Ritcher M., Utilities’ business models for renewable energy: A review, Renewable and Sustainable Energy Reviews, Vol.16, pp.
2483-2493, 2012
14. Chesbrough C., Rosenbloom R.S., The role of the business model in capturing value from innovation: evidence from Xerox corporation’s technology spin-off companies, Industrial and Corporate Change, Vo.11, No.3, pp. 529-555, 2002
15. Morris M., Schindehutte M., Allen J., The entrepreneur’s business model: toward a unified perspective, Journal of Business Research, Vol.58, No.6, pp. 726-735, 2005
16. Zott C., Amit R., Business model design and the performance of entrepreneurial firms, Organization Science, Vol.18, No.2, pp. 181-199, 2007
17. Osterwalder A., The business model ontology - A proposition in a design science approach, University of Lausanne, Dissertation, 2004 18. Ballon P., Business modelling revisited; the
configuration of control and value, The Journal of Policy, Regulation and Strategy for Telecommunications, Information and Media, Vol.9, No.5, pp. 6-19, 2007
19. Doganova L., Eyquem-Renault M., What do business model do? Innovation devices in technology entrepreneurship, Research Policy, Vol.38, pp. 1559-1570, 2009
20. Ritcher M., Business model innovation for sustainable energy: German utilities and renewable energy, Energy Policy, Vol.62, pp.
1226-1237, 2013a
21. Osterwalder A., Pigneur Y., Business model generation, A Handbook for Visionaries, Game Changers, and Challengers, Wiley, New Jersey, 2010
22. Frantzis L., Graham S., Katofsky R., Sawyer H., Photovoltaics Business Models, Technical Report, National Renewable Energy Laboratory, 2008
23. Okkonen L., Suhonen N., Business models of heat entrepreneurship in Finland, Energy Policy, Vol.38, pp. 3443-3452, 2010
24. Würtenberger L., Bleyl J.W., Menkveld M., Vethman P., van Tilburg X., Business models for renewable energy in the built environment, IEA-RETD, 2012
25. Lehr R.L., New utility business models: utility and regulatory models for the modern era, The Electricity Journal, Vol.26, No.8, pp. 35-53, 2013
26. Ritcher M., German utilities and distributed PV: How to overcome barriers to business model innovation, Renewable Energy, Vol.55, pp. 456-466, 2013b
27. Loock M., Going beyond best technology and lowest price: on renewable energy investors’
preference for service-driven business models, Energy Policy, Vol.40, pp. 21-27, 2012 28. IEA (International Energy Agency), CO2
emissions from fuel combustion, IEA, Paris, 2014