http://dx.doi.org/10.7848/ksgpc.2015.33.6.475
Feasibility of Using an Automatic Lens Distortion Correction (ALDC) Camera in a Photogrammetric UAV System
Jeong, Hohyun
1)ㆍAhn, Hoyong
2)ㆍPark, Jinwoo
3)ㆍKim, Hyungwoo
4)Kim, Sangseok
5)ㆍLee, Yangwon
6)ㆍChoi, Chuluong
7)Abstract
This study examined the feasibility of using an automatic lens distortion correction (ALDC) camera as the payload for a photogrammetric unmanned aerial vehicle (UAV) system. First, lens distortion for the interior orientation (IO) parameters was estimated. Although previous studies have largely ignored decentering distortion, this study revealed that more than 50% of the distortion of the ALDC camera was caused by decentering distortion. Second, we compared the accuracy of bundle adjustment for camera calibration using three image types: raw imagery without the ALDC option; imagery corrected using lens profiles; and imagery with the ALDC option. The results of image triangulation, the digital terrain model (DTM), and the orthoimage using the IO parameters for the ALDC camera were similar to or slightly better than the results using self- calibration. These results confirm that the ALDC camera can be used in a photogrammetric UAV system using only self-calibration.
Keywords : Automatic Lens Distortion Correction, Photogrammetric UAV System, Interior Orientation Parameter, Accuracy, Image Triangulation
Original article
Received 2015. 10. 28, Revised 2015. 11. 24, Accepted 2015. 12. 28
1) Member, Dept. of Spatial Information Engineering, Pukyong National University (E-mail: [email protected]) 2) Member, Dept. of Spatial Information Engineering, Pukyong National University (E-mail: [email protected]) 3) Dept. of Spatial Information Engineering, Pukyong National University (E-mail: [email protected])
4) Dept. of Spatial Information Engineering, Pukyong National University (E-mail: [email protected]) 5) Member, Dept. of Industry and Academic Cooperation, Dongeui Institute of Technology (E-mail: [email protected] ) 6) Dept. of Spatial Information Engineering, Pukyong National University (E-mail: [email protected])
7) Corresponding Author, Member, Dept. of Spatial Information Engineering, Pukyong National University (E-mail: [email protected])
This is an Open Access article distributed under the terms of the Creative Commons Attribution Non-Commercial License (http://
1. Introduction
Estimating the interior calibration parameters of a camera from sequences of images is an important problem for a broad range of applications (Hartley, 2008). Almost all camera lenses suffer from some distortion, which reduces the positional accuracy of image points located on the image plane. This is one of the oldest computer vision problems and although much has been solved, some questions remain (Kukelova and Pajdla, 2011).
Lens distortion may include symmetric radial distortion, decentering distortion, affinity distortion, and non-orthogonal
deformation (Fraser, 1997). Radial distortion is symmetrical relative to the principal point of the image and is calculated with the polynomial of odd powers against the radial distance (Wolf et al., 2000). Decentering distortion is the error that occurs when the lens centers are not concordant; it has less effect on distortion than does symmetric radial distortion.
Affinity distortion and non-orthogonal deformation are typically very small. Consequently, lens distortion has recently been considered in terms of symmetric radial and decentering distortion (Fraser, 1997; Kim et al., 2013).
Several methods have been proposed for correcting the
radial distortion of lenses causing moderate distortion,
including the radial model by Brown (1971), the rational model by Claus et al. (2005), and the division model by Lenz (1987). Automatic approaches for correcting radial distortion have been attempted (Gonzalez-Aguilera et al., 2011; Lee et al., 2013; Cai, 2014). Additionally, intelligent cameras with automatic lens distortion correction have been introduced widely. A smart camera can correct lens distortion automatically as users shoot, and users are never required to load lens profiles. Therefore, the use of smart cameras allows a photogrammetric unmanned aerial vehicle (UAV) system to be developed at much lower cost and with much faster calibration than earlier systems. However, no research has considered the accuracy of an automatic lens distortion correction (hereafter, ALDC) camera in this context.
This study assessed the feasibility of using an ALDC camera as the payload for a photogrammetric UAV system.
The study’s primary contributions can be summarized as follows:
1. Three types of imagery were used for lens calibration of the ALDC camera: raw imagery without the ALDC option (Type 1, only remove chromatic and vignette);
imagery corrected using lens profiles (Type 2); and imagery with the ALDC option (Type 3).
2. We examined the effects of ALDC on the accuracy of aerial triangulation and a digital terrain model (DTM) with the photogrammetric UAV system.
2. Methodology
2.1. Camera calibration
An ALDC camera can estimate lens distortion using its lens firmware and then correct the lens distortion automatically.
In this study, the Samsung SMART NX camera was chosen as the ALDC camera. It has a focal length of 16 mm, but when taking an image with the ALDC option, the field of view was 71.65° by 51.41° (wide by high). With the raw image without the ALDC option, this increased to 72.62° by 52.09°.
The raw image was 1.3% larger than the image with the ALDC option. As shown in Fig. 1, the actual picture element of the Samsung SMART NX ALDC is 20.50 megapixels, but the four corners and four edges of the wide angle lens produced barrel distortion.
Most cameras in photogrammetric UAV systems have inexpensive lenses, which can cause lens distortion and reduce the accuracy of DTMs. Accordingly, the most important issue in using a camera for photogrammetric purposes is to correct the distortion, because it shifts the image points locally and causes errors in their position (Lee et al., 2012).
Lens distortion is divided into radial and decentering. The distortion can be described as follows:
x
c=x+dr
x+dp
x(1)
y
c=y+dr
y+dp
y(2)
where xc and yc are the corrected image points, drx and dry are the (x, y) components of the radial lens distortion correction, and dpx and dpy are the (x, y) components of the decentering lens distortion correction. Radial lens distortion (dr) is described as:
dr=K1* r
2+K2* r
4+K3* r
6(3)
where, r
2=x
2+y
2, K1, K2, and K3 are the parameters.
Decentering lens distortion is:
dp
x=P1*(r
2+2* x
2)+2*P2*x*y (4) dp
y=P2*(r
2+2* y
2)+2*P1*x*y (5)
where P1 and P2 are the parameters, r is in mm from the principal point, x and y are in mm from the principal point.
A Samsung NX camera can obtain two types of image:
raw images without the ALDC option (Type 1) and images with the ALDC option (Type 2). Images corrected using lens profiles (Type 3) can be estimated using Adobe Lens Profile Fig. 1. Lens distortion before and after correction: (a) after removing only chromatic and vignette using lens profiles;
and (b) the result with auto lens distortion correction
(a) (b)
Creator, which can incorporate three factors: lens distortion, chromatic aberration, and vignette.
Camera calibration and the IO parameters were calculated using the PhotoModeler software, which is a photogrammetric software for image-based measurement and 3D modelling developed by Eos Systems Inc., particularly designed for the photogrammetric close range.
Calibration was accomplished using multi-sheet method that uses several sheets having ringed automatically detected (RAD) coded targets. Taking into account the focal length and CCD size/resolution of the camera, 16 sheets of A3-size sheets of RAD-coded targets were obtained (inner target diameter: 12.6 mm; height: 1.8 m; width: 1.8 m). These targets provide the ability to automatically mark, recognize, and reference targets in a scene (Fig. 2).
2.2. Photogrammetric UAV experiment and field campaign
Photogrammetric UAV experiments were conducted at Pukyong National University in South Korea (Fig. 3a).
The UAV for this experiment was an X8+ double motor octocopter, equipped with a Pixhawk autopilot and 3DR u-blox GPS with a compass. This was an appropriate site for evaluating the three types of image due to its flat geography.
The study area was selected to provide six flight courses (length 80 m, interval 10m) to take pictures of the size 100 m by 100 m. The time interval for image-taking was set to 5 to 6 seconds for over 60% of the overlap (Fig. 3b). The instant field of view (IFOV) angle for the upper side lap 60% and overlap 60% was set according to the camera specification.
The targets for GCPs were designed with an interval of 7 m to 10 m, and the radius for targets was 8 cm.
Before the photogrammetric UAV experiment, we conducted a field campaign to determine the ground control point (GCP) using aerial signal targets. The 3-D coordinates of control points are very important in processing images and generating ortho-rectified images. They are used as the GCPs for image triangulation and are also used to triangulate 3-D laser scanning data. To determine the 3-D coordinates of the two base station in the test field, we used GPS. Using the two control points determined by GPS surveying, 96 GCPs were established using a Total Station (Fig. 3c). The scanning process was implemented to generate DTM (Fig. 3d).
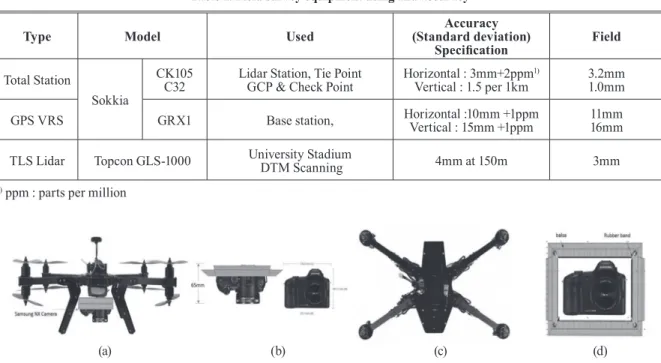
GPS accuracy in the field experiment was horizontal 11 mm and vertical 16 mm, whereas the accuracy of 3-D laser scanning was horizontal and vertical 3 mm. The accuracy of Fig. 2. Calibration sheet used in this study
(Multi RAD-coded target)
Fig. 3. The test field for study area (a) Aerial view of the region in which the UAV images were taken. The central area (marked in red) is where the experiment was conducted (b) Flight course in this study (c) Distribution of the locations of
GPS base stations, 3D laser scanners, and GCPs on the final orthoimages (d) TLS LiDAR DTM
(a) (b) (c) (d)
total station surveying was horizontal 3.2 mm and vertical 1 mm. The accuracy of GPS surveying was slightly greater than the accuracy listed in the technical specifications, and vertical accuracy was worse than the horizontal accuracy.
The 3-D laser scanner and total station accuracies were very good, within 3 mm in both vertical and horizontal directions (Table 1).
More vibration occurred in the rotorcraft UAV than a fixed wing craft. Movement of the sensors should be avoided and the influence of vibrations has to be reduced (Henri, 2009).
A vibration proof gimbal was attached for ALDC camera on the lower side of the rotorcraft UAV (Fig. 4). The electric rotorcraft UAV showed reduced higher frequency vibrations than a gasoline engine UAV; high frequency vibrations can be critical to UAV sensors and serious effects can result on magnetic sensors from the magnetic field created by the rotating motor. The magnetic compass on the UAV suffers significant interference from the motors and power wires, because magnetic interference is linearly related with the current drawn. It is technically possible to set up compass and motor calibration relative to the throttle.
3. Result & Discussion
3.1. Camera calibration
Calibrations and IO orientation are calculated from the perspective geometric model with bundle adjustment (Brown, 1971). This study compared The interior orientation (IO) parameters were calculated by Photomodeler for three sets of ALDC type. Multi RAD-coded targets sheet area used to correct for irregular lens distortion found on ALDC cameras.
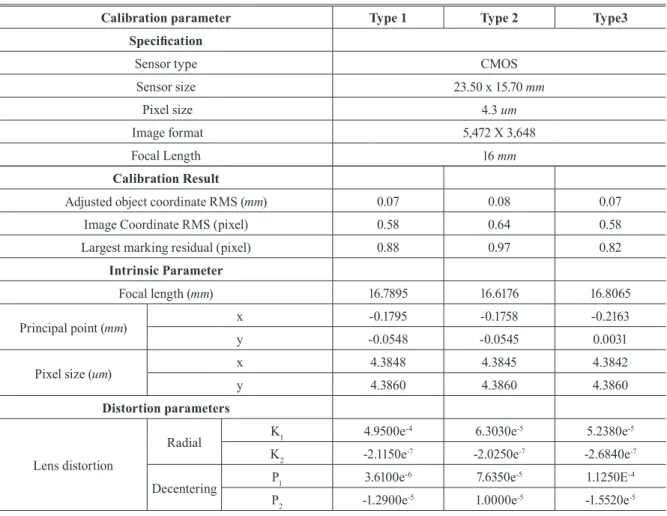
Table 2 lists the calibrated focal length (mm), principal point x0, y0, radial distortion, and decentering distortion estimates. The overall coordinate RMSE for the ALDC camera images was 0.5750-0.6380 pixel and the RMS error for object coordinates was less than 0.1mm from the object plane (1.8m x 1.8 m). The maximum marking residual of the calibration quality of the ALDC camera was 0.8170-0.9687.
The calibrated focal lengths (mm) in the Type 2, Type 1, and Type 3 images were 16.6176, 16.7895, and 16.806, respectively. Differences were observed in the principal point x0, y0 (mm): (-0.1758, -0.0545), (-0.1795, -0.0548), and
Type Model Used Accuracy
(Standard deviation)
Specification Field
Total Station
Sokkia
CK105
C32 Lidar Station, Tie Point
GCP & Check Point Horizontal : 3mm+2ppm
1)Vertical : 1.5 per 1km 3.2mm 1.0mm
GPS VRS GRX1 Base station, Horizontal :10mm +1ppm
Vertical : 15mm +1ppm 11mm 16mm TLS Lidar Topcon GLS-1000 University Stadium
DTM Scanning 4mm at 150m 3mm
Table 1. Field survey equipment using and accuracy
1)
ppm : parts per million
Fig. 4. Research UAV & vibration reduction device (a) A front view of UAV with a vibration reduction device, (b) A 65mm offset between camera and UAV, (c) A top view of UAV, (d) The camera balsa frame
(a) (b) (c) (d)
(-0.2163, 0.0031), respectively. The Type 2 and Type 1 values were similar, but the Type 3 estimate was larger. This is likely because the Raw file differs in pixel width and height.
The pixel size x (mm) was 4.3842-4.3848, and pixel size y (mm) was 4.3860; each ALDC camera was similar.
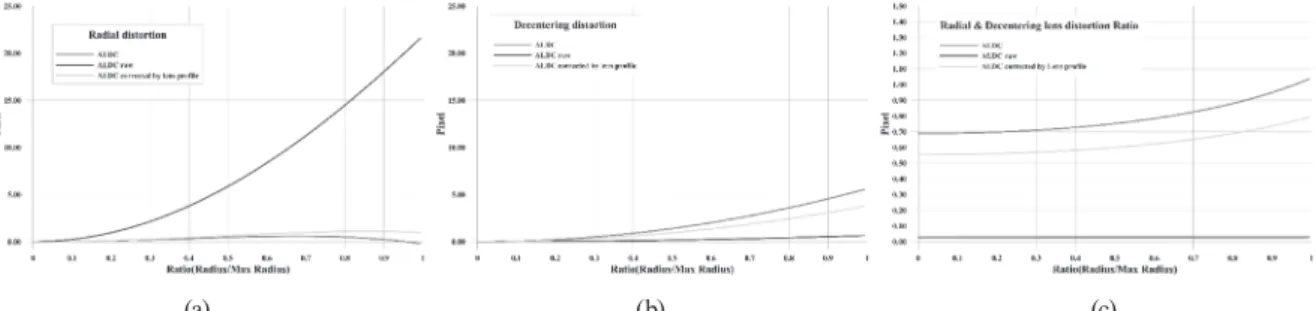
Generally, of the symmetric radial distortion and decentering coefficients K1, K2, K3, P1, and P2, K3 are seldom considered because of their small magnitudes (Fraser, 1997). In this study (see Table 2), We estimated radial and decentering lens distortion with K1, K2, P1, and P2. The radial lens distortion (Fig. 5a) differed in some ways.
Lens radial distortion was in the order Type 1 (21.6) > Type 2 (1.1) > Type 3 (0.6). ALDC Raw (Type 1) exhibited large lens radial distortion, but Type 2 (imagery corrected by lens profiles) and Type 3 (imagery with ALDC) radial distortion
exhibited much less. Decentering lens distortion is shown in Fig. 5b. The lens decentering distortion was in the order Type 3 (5.55-12.46) > Type 2 (3.77-10.01) > Type 1 (0.65-0.94).
The lens distortion ratio is shown in Fig. 5c. The x-axis is the Ratio = (Radius/Max Radius) and the y-axis is Decentering / (Decentering + Radial).
In the ALDC RAW file, the effect of the decentering distortion ratio was very small (<4%); the radial distortion was mostly removed. However, the lens decentering distortion was increased in the ALDC images (Fig. 5b and 5c). Decentering lens distortion has largely been ignored in past research, but it is important with ALDC cameras.
Thus, a small-format camera can get much better results when decentering and radial distortion are considered, rather than radial distortion only (Karras et al., 1998). That is,
Calibration parameter Type 1 Type 2 Type3
Specification
Sensor type CMOS
Sensor size 23.50 x 15.70 mm
Pixel size 4.3 um
Image format 5,472 X 3,648
Focal Length 16 mm
Calibration Result
Adjusted object coordinate RMS (mm) 0.07 0.08 0.07
Image Coordinate RMS (pixel) 0.58 0.64 0.58
Largest marking residual (pixel) 0.88 0.97 0.82
Intrinsic Parameter
Focal length (mm) 16.7895 16.6176 16.8065
Principal point (mm) x -0.1795 -0.1758 -0.2163
y -0.0548 -0.0545 0.0031
Pixel size (um) x 4.3848 4.3845 4.3842
y 4.3860 4.3860 4.3860
Distortion parameters Lens distortion
Radial K
14.9500e
-46.3030e
-55.2380e
-5K
2-2.1150e
-7-2.0250e
-7-2.6840e
-7Decentering P
13.6100e
-67.6350e
-51.1250E
-4P
2-1.2900e
-51.0000e
-5-1.5520e
-5Table 2. Interior orientation of each type ALDC camera by calibration
the accuracy of IO for an ALDC camera depends on how decentering lens distortion is considered.
3.2 Image block triangulation
Photogrammetric image processing of the data, consisting of tie point measurement, bundle adjustment, DTM, and orthoimage generation, was performed using ERDAS LPS software.
Manufacturer interior orientation (M.IO), including focal length and manufacturer pixel size, was used. For the principal point X0, Y0, the radial and decentering distortion parameter was “0”, and the self-calibration option was IO for focal length, and principal point x0, y0 standard deviation was ±0.001 mm for triangulation.
Most previous research has only used radial lens distortion, but the results of this study indicated that for lens calibration for interior orientation, decentering distortion is
also important. Therefore, we analyzed C.IO was analyzed for accuracy considering decentering lens distortion. M.IO cannot consider radial and decentering in the IO parameter, so only a C.IO camera was analyzed.
The results of image triangulation for each Interior Orientation and camera type are shown in Table 3.
In the case of the considering both radial and decentering parameter (D&R), total image unit-weight RMSE (The total root mean square error for the triangulation) ALDC and ALDC RAW were 0.723 and 0.734 pixels, respectively, whereas considering only radial parameter, its RMSE showed 1.082 and 0.765 pixels, respectively.
When considering radial and decentering (D&R) parameter, depending on verification of the camera, the total image unit-weight RMSE showed better than those for the only radial (R) lens distortion were considered. However, C.IO ALDC exhibited higher levels of improvement with Fig. 5. Radial and decentering distortion curve for each camera Type Device (a) Radial Lens Distortion,
(b) Decentering Lens Distortion, (c) Decentering distortion Ratio
(a) (b) (c)
ALDC ALDC RAW
Calibrated
I.O. Manufacturer
I.O. Calibrated
I.O. Manufacturer I.O.
Totalimageunit-weight RMSE (pixel)
Decentering /
Radial distortion 0.723
1.300 0.734
12.368
Only radial distortion 1.082 0.765
Control point RMSE (Ground, m)
X 0.014 0.018 0.012 0.128
Y 0.012 0.015 0.012 0.127
Z 0.024 0.040 0.025 0.450
Control point RMSE
(Image, pixel) X 0.477 0.872 0.513 8.732
Y 0.511 1.004 0.518 8.916
Table 3. The result of aerial triangulation's by interior orientation and camera type
high decentering distortion ratios. The deviation of the distortion center from its true location under both lens radial and decentering distortion was equivalent to adding two additional decentering distortion terms (Moumen, 2005).
Wide-angle lens decentering distortion is larger and the C.IO (D&R) is more effective. Also, C.IO (D&R) can reduce the sum of C.IO (R) residues (Wang et al., 2008).
based on this results, if a No ALDC camera (e.g. Canon IXUS) was used considering only radial distortion, a ‘useful’
result can be derived. However, with an ALDC camera, one has to consider radial and decentering distortion. Indeed, decentering lens distortion is critical in ALDC.
3.3 DTM and orthoimage generation
Orthoimages for each ALDC and DEM generated by the automatic terrain extraction (ATE) functionality in LPS 9.2, are shown in Fig. 6. Also, a comparison was made between TLS DTM regarding the same area and image-based DTM to assess differences between them (Table 4). Based on the difference of DTM extraction from the images and TLS DTM accuracy was evaluated by difference mean and standard deviation C.IO ALDC were 0.0cm and 2.5cm, C.IO ALDC Raw were 0.3cm and 3.2cm, respectively, whereas The M.IO ALDC were 2.2cm and 3.8cm, M.IO ALDC Raw were 35.0cm and 16.5 cm, in order. Although differences appeared in the histograms of DTM extraction from images (Fig. 7), TLS DTM, and Calibrated IO had similar distributions, but the manufacturer IO one was different.
When converting the altitude of a Sony nex7 and UAV to the same altitude from an archaeological survey result, the standard deviation was ±2.56-3.52 cm (Flener et al., 2013).
When a swinglet (UAV) and a Canon IXUS 120 were used, the result from taking the picture DTM height difference mean and standard deviation were 1.2±2.4 cm and 2.8±6.8 cm at the same fight height (Vallet et al., 2011). Thus, C.IO ALDC, C.IO ALDC Raw, and M.IO ALDC are considered to be within the level of significance. The maximum absolute values are about 20 m, near building edges and in the central area covered by very high trees. In most areas (~90%), differences were in the range of -30 to 40 cm.
Moreover, the average of the differences being close to zero shows the absence of vertical and horizontal biases for all DTM (Moumen, 2005) that is, when we convert to the same flight altitude, 6.23 to 8.31 cm. With the estimated ~90%
difference, C.IO ALDC Raw were in the range of -4 to 2 cm and C.IO ALDC were-4.5 to 2cm showed remarkably good results, whereas M.IO ALDC were in the range of -8 to 6cm was reasonably similar, and M.IO ALDC Raw were -60 to -0.15cm showed poor results.
In the cases using a calibrated IO, the point quality was sufficiently high to play an important part in achieving a good result. In the case of using the manufacturer IO, ALDC was relatively good in each field, but the other M.IO file was low for the DTM extraction ratio. Thus, to obtain high quality data, a highly accurately C.IO (D&R) is considered to be essential.
Fig. 6. Orthorectified image and DTM (a) Calibrated interior orientation ALDC orthoImage, (b) Calibrated interior orientation ALDC DTM, (c) Manufacturer interior orientation ALDC raw orthoImage (d) Manufacturer interior
orientation ALDC raw DTM
(a) (b) (c) (d)
5. Summary and Conclusions
Since 2010, when cameras were first equipped with powerful CPUs, auto lens distortion correction (ALDC) has become possible and ALDC is now used with self-calibration in nonphotography applications. However, use of ALDC still requires a rigorous evaluation of the camera. Recently, the Samsung NX camera, a Smart ALDC camera, has added internal clock time synchronization as accurate as 1/1,000 s,
and is equipped with all kinds of sensors, so it seems to have great potential; however, careful consideration of the Smart ALDC camera’s accuracy and problems remains important.
ALDC image lens distortion was outstanding in comparison with imagery corrected by lens profiles. However, when assessing nonmetric and small-format camera, ALDC Raw images have high lens decentering distortion that previous research has largely ignored, but that increases greatly in ALDC processes. Thus, when comparing C.IO (D&R), and C.IO (R), ALDC Raw images showed marginal differences, but there were large improvements in C.IO (D&R) in ALDC.
Accordingly, when using C.IO (D&R), a much better result is expected. However, C.IO (R) showed similar or better results than M.IO ALDC and self-calibration, so removal of decentering lens distortion is very important.
The accuracy of the final products (orthoimages and DTM) can be greatly improved by careful calibration. However, although some errors still appeared, the M.IO ALDC and self-calibration settings can generally be used by non- photogrammetry experts, except for cases demanding high accuracy of orthoimages and DTM.
Acknowledgment
This work was supported by a Research Grant of Pukyong National University (2014 Year).
ALDC ALDC RAW
Calibrated I.O. Manufacturer I.O. Calibrated I.O. Manufacturer I.O.
DTM Statistic by UAV System
Min 4.730 4.721 4.730 4.630
Max 5.006 5.046 5.037 5.791
Mean 4.907 4.927 4.901 5.264
Stdev
1)0.027 0.038 0.033 0.164
Residual by Terrestrial LiDAR
Min -0.137 -0.158 -0.126 -0.895
Mx 0.143 0.177 0.162 0.296
Mean 0.000 -0.021 0.006 -0.357
Stdev
1)0.025 0.038 0.032 0.165
Table 4. Extraction DTM and difference each DTM and TLS DTM statics (unit : m)
1)