Antioxidative Effect and Neuraminidase Inhibitory Activity of Polyphenols Isolated from a New Korean Red Waxy Sorghum (Sorghum bicolor L. cv.
Hwanggeumchalsusu)
Ji-Eun Ra1,2†, Kyung Hye Seo1†, Jee Yeon Ko1, Mi-Ja Lee1, Hyeon Jung Kang1, Sun Lim Kim1, Ill-Min Chung2 and Woo Duck Seo1*
1Crop Foundation Division, National Institute of Crop Science, 181 Hyeoksin-ro, Iseo-myeon, Wanju-Gun, Jeollabuk-do 565-851, Korea
2Department of Applied Life Science, College of Life and Environmental Sciences, Konkuk University, 120 Neungdong-ro, Gwangjin0gu, Seoul 143-701, Korea
Received April 30, 2015 /Revised July 10, 2015 /Accepted July 10, 2015
To identify nutritional and therapeutic properties of the new Korean red waxy sorghum cultivar
‘Hwanggeumchalsusu (HGC)’, we assayed the antioxidative effects and neuraminidase inhibitory activity. A methanol and 70% ethanol extract of HGC exhibited strong antioxidative effects (IC50 val- ues of 83.2±2.7 for DPPH) and 85.6±2.4 μg/ml for ABTS) and neuraminidase (ND) inhibitory activity (IC50 values of 1.8±0.1 from extracted with methanol and 3.4±0.1 μg/ml from extracted with 70% etha- nol) compared with that of the control, noncolored sorghum cultivar ‘Huinchalsusu (HC)’ (IC50 > 200 μg/ml). We isolated nine polyphenols, Gallic acid (1), Protocatecuic acid (2), p-Hydroxy benzoic acid (3), Vanillic acid (4), Caffeic acid (5), Ferulic acid (6), Luteolinidin (7), Apigeninidin (8), Luteolin (9), from the HGC–methanol extract, to determine whether they were the active components Luteolinidin of one kind of polyphenols from the HGC, exhibited significant antioxidative effects (IC50 values of 10.9±0.5 μM for DPPH and 8.6 0.6 μM for ABTS) and neuraminidase (ND) inhibitory activity (IC50 val- ues of 26.3±0.6) showed noncompetitive inhibition model. The binding affinity of the ND inhibitors in molecular docking experiments correlated with their ND inhibitory activities. These results suggest that HGC may be utilized to serve as a potential effective antioxidant and inhibitor of ND.
Key words : Antioxidative effect, apigeninidin, luteolinidin, neuraminidase inhibitor, Sorghum bicolor L.
†Authors contributed equally.
*Corresponding author
*Tel : +82-63-238-5333, Fax : +82-63-238-5305
*E-mail : [email protected]
This is an Open-Access article distributed under the terms of the Creative Commons Attribution Non-Commercial License (http://creativecommons.org/licenses/by-nc/3.0) which permits unrestricted non-commercial use, distribution, and reproduction in any medium, provided the original work is properly cited.
Journal of Life Science 2015 Vol. 25. No. 7. 786~794 DOI : http://dx.doi.org/10.5352/JLS.2015.25.7.786
Introduction
Sorghum is one of the most important staple foods in the semiarid tropics of Africa and Asia. It is primarily used as food in these regions and also used as feed for domestic animals. Recently, the number of studies that focus on the importance of sorghum as a food source has increased be- cause of the beneficial effects of sorghum on human health [2]. For example, when consumed as part of the diet, sor- ghum or its components act as antiinflammatory agents [5], anticancer drugs [22], and as antimutagens [2]. Sorghum contains numerous compounds, particularly phenolic com- pounds such as phenolic acid and flavonoids. Among them,
3-deoxyanthocyanins, apigeninidin, and luteolinidin are components of pigments that impart grain color to sorghum [3]. These compounds mediate the beneficial effects of sor- ghum on health and contribute to the favorable character- istics of processed goods prepared using sorghum [7].
Seasonal influenza kills hundreds of thousands of peo- ple because of the high infectivity of influenza virus and the emergence of strains with new antigenicity [2]. The sur- face of the influenza virus particle contains hemagglutinin, neuraminidase (ND), and an ion channel. ND, which is widely distributed among viral and bacterial species, cleaves sialic acid residues from the cell–surface. Because of the ND function, progeny virus particles are easily re- leased from host cell [4, 6, 18]. Therefore, ND is a significant therapeutic target for the development of antiviral drugs.
Several polyphenols which are derived from natural sources have been reported as ND inhibitors [12, 13]. 3-deoxy- anthocyanidin is a major polyphenol of sorghum; however, there are no reports on its ability to inhibit ND activity.
Antioxidants protect organisms against the harmful ef- fects of free radicals, which are derived from environmental
pollutants, ultraviolet light and chemicals. The free radicals damage DNA, RNA, and proteins, leading to different types of tissue injuries [1, 10]. Antiviral agents taken together with antioxidants, antiinflammatory agents, or both demonstrate enhanced activity [8, 24]. Therefore, compounds that act as antioxidants and ND inhibitors may serve as powerful ther- apeutics to control influenza virus.
In the present study, we investigated the ability of a Korean red waxy sorghum cultivar on ND activity and anti- oxidative effect. To the best of our knowledge, this is the first study to show that a colored sorghum cultivar may serve as food for human consumption or as animal feed with antioxidative and antiviral activity.
Materials and Methods
Plant materials
Two Korean waxy sorghum cultivars (Sorghum bicolor L.
Moench), ‘Hwanggeumchalsusu (HGC)’ with a red pericarp and ‘Huinchalsusu (HC)’ with a white pericarp, were har- vested in 2013 at the experimental field of the National Institute of Crop Science (NICS), Rural Development Administration, Korea. The samples were packaged in plas- tic bags and stored at -20°C.
Chemicals
1,1-diphenyl-2-picryhydrazyl (DPPH), 2,2’-azino-bis(3- ethylbenzothiazoline-6-sulfonic acid (ABTS), potassium per- sulfate, Clostridium perfringens neuraminidase (ND), 4-meth- ylumbelliferyl-α-D-N-acetylneuraminic acid sodium salt hy- drate (4-MU-NANA), sodium acetate, trifluoroacetic acid (TFA) were purchased from Sigma-Aldrich (St. Louis, USA).
HPLC-grade water and acetonitrile (ACN) were purchased from J.T. Baker (Phillipsburg, USA).
Isolation and identification of active compounds Dried HGC grain was ground using a miller to a mesh size of 100, and 1 kg of this powder was extracted with methanol containing 0.5% HCl (v/v) at room temperature for 3 days. The extract was concentrated at 40°C under re- duced pressure using an evaporator, and 61 g of dark red residue was obtained. The residue was subjected to reverse phase column chromatography (RPCC, LiChroprep C18, Millipore, Darmstadt, Germany) and eluted with a mixture of ACN and methanol (ACN:methanol, 10:1, 5:1, 1:1, and 0:1, v/v). Based on the TLC profile, five main fractions (F.10
–5) were collected. F.2 was again subjected to RPCC and yielded compounds 8 (380 mg) and 9 (82 mg). Compounds 7 (198 mg) and 6 (46 mg) were isolated from F.3 and F.4, respectively, using an RPCC eluted with a mixture of meth- anol and distilled water. F.5 was divided into five sub- fractions (F.5.1–5) and yielded compounds 5 (71 mg), 4 (11 mg), and 3 (20 mg) from F.5.2–4. Subfraction F.5.5 was applied to an RPCC that was eluted with a mixture of meth- anol and distilled water (5:1, 1:1, and 0:1), yielding com- pounds 2 (26 mg) and 1 (27 mg). Nuclear magnetic reso- nance (NMR, Bruker Avance-300, Bruker Biospin, Karlsruhe, Germany) and ultra–highperformance liquid chromatog- raphy (UPLC, Waters, Milford, USA) equipped with an elec- tro–spray ionization–tandem mass/mass spectrometric system (LC/MS/MS, Waters) were used to determine their structures. The 1H- and 13C-NMR spectral data of com- pounds are available as supplementary materials. LC/
MS/MS analyses ware performed over the range m/z 50–
1,000 and conducted using positive- and negative-ion modes. The operating parameters were: cone voltage 40 V;
capillary voltage, 2.8 kV; drying gas, N2, 800 l/hr; collision gas, argon, 0.12 ml/min. Full scan data acquisition was processed MassLynx (Waters).
Evaluation of antioxidant activities
Free radical scavenging activities were determined using the DPPH and ABTS assays [15]. DPPH (200 μl, 0.15 mM) was mixed with sample (50 μl), and absorbance (ABS) was measured at 517 nm after 30 min at room temperature. The ABTS stock solution (7.4 mM) was mixed with 2.4 mM po- tassium persulfate and maintained for 4 hr until the absorb- ance stabilized. The ABTS (225 μl) and sample (25 μl) were mixed for 1 min and ABS was immediately measured at 734 nm. DPPH and ABTS radical scavenging activity were calculated according to formula (1).
Free radical scavenging activity (%) = (ABSblank–ABSsample) / ABSblank ×100 (1)
Bacterial neuraminidase inhibition assay
Inhibition of ND activity was measured using a mod- ification of a method published by Potier et al [16]. The sample (100 μl, inhibitor, I) was mixed with 2 mM 4- MU-NANA (125 μl) and sodium acetate buffer (1771 μl, pH 5.0) and maintained at 37°C. ND (4 μl, 10 U/ml) was added, mixed well, and the reaction product 4-methylumbelliferon was immediately measured at 37°C using a fluorescence
spectrophotometer (SpectraMax M5, Molecular Devices, Sunnyvale, USA). The excitation and emission wavelengths were 365 and 450 nm. Inhibitory activities were calculated according to equation (2).
Activity (%) = 100[1 / (1 + ([I] / IC50))] (2) To determine the inhibition model displayed by com- pounds, Lineweaver-Bulk and Dixon plot were obtained at several inhibitor concentrations using several substrate (S) concentrations and data were analyzed using the SigmaPlot (SPCC Inc., Chicago, USA). The kinetic parameter, Ki values were calculated according to equation (3).
Ki = IC50 / [1 + ([S] / Km)] (3)
Molecular docking calculations
Docking calculations were determined using the program AUTODOCK 4.2 [14]. The monomer model of the three–di- mensional structure of neuraminidase (PDB code: 2VK6) [18] was used. The AUTODOCKTOOLS program was also used to generate the docking input files using the im- plemented empirical free energy function and the Lamarckian genetic algorithm. The grid maps for docking simulations were generated with 60 grid points in the x, y, and z direction centered on the O-4 hydroxyl of 2-de- oxy-2,3-dehydro-N-acetyl neuraminic acid (NeuAc2en) in li- gand binding site of catalytic domain using the AutoGrid program. The best docked conformation was chosen to have the lowest binding energy in the cluster with the greatest number of members. The figure was generated using PyMOL (http://www.pymol.org).
Quantitative analysis of phenolic compounds Quantitative analysis of phenolic compounds was per- formed using the UPLC system. One gram of sorghum grain powder was extracted with 20 ml of methanol containing 0.5% (v/v) HCl for 24 hr at 30°C. The extract injected into a column (Waters ACQUITY BEH C18) that was maintained at 35°C and absorbance was measured at 254 nm. The mo- bile phase, 0.1% TFA in water (A) and ACN (B), was deliv- ered at 0.4 ml/min using a gradient as follows: initial, 3%
B; 10 min, 20% B; 13 min 30% B; 15 min, 50% B; 16 min, 90% B; 20 min 3% B. The calibration curve was generated using different concentrations of isolated compounds. The identities of the compounds were determined by comparing the retention times of the standard peaks with those of the sorghum extract peaks.
Statistical analysis
All measurements were repeated three times, and the re- sults are presented as the mean ± standard deviation (SD) of data obtained from triplicate experiments. The data were displayed using SigmaPlot software.
Results and Discussion
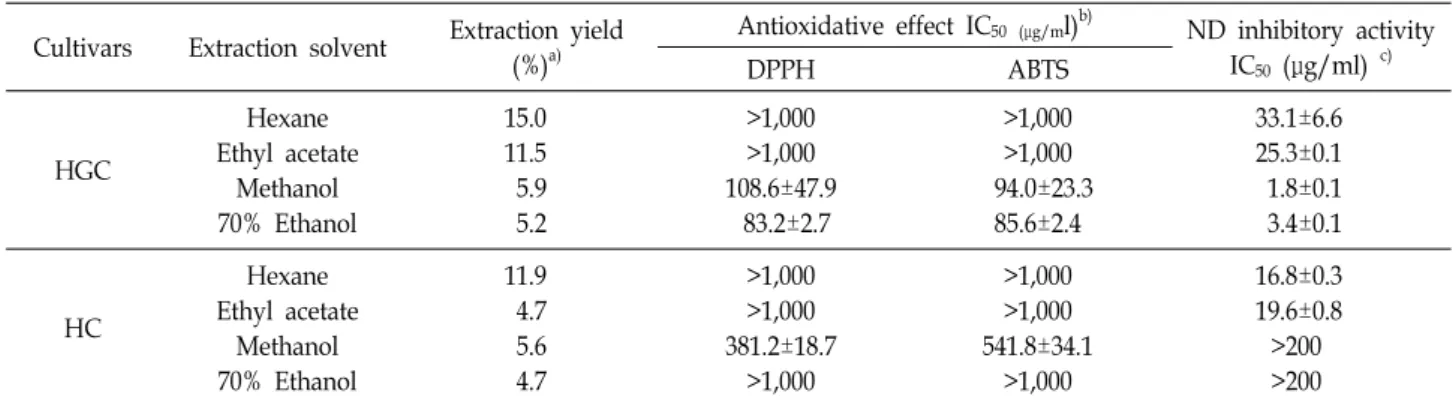
Antioxidative effects and ND inhibitory activities of sorghum grain extracts
The evaluation of antioxidative activity is primarily used to determine the biological effects of natural products and foods. The antioxidative activities of HGC and HC extracts were measured using DPPH and ABTS assays which have been commonly used to evaluate free radical scavenging activity of natural compounds [21]. HGC–methanol and HGC ethanol (70%) extracts and only the HCC–methanol extract was active in DPPH and ABTS antioxidant assays (Table 1). The antioxidative effects of HGC–methanol ex- tracts were higher than those of HC–methanol extracts (by factors of 3.5 in DPPH assay and 5.8 in ABTS assay). There was no significant difference in the effects of methanol and ethanol (70%) extracts of HGC. All HGC extracts inhibited ND activity, specifically, the IC50 values of the HGC–meth- anol and HGC–70% ethanol extracts were remarkable (1.8±0.1 μg/ml and 3.4±0.1 μg/ml, respectively). In contrast, HC–hexane and HC–ethyl acetate extracts only inhibited ND activity, with IC50 values of 16.8±0.3 μg/ml and 19.6±0.8 μg/ml, respectively. Throughout the assessment of the free radical scavenging and ND inhibitory activities, the anti- oxidant capacity and ND inhibition of sorghum may be de- termined by compounds, contained within HGC methanol extract more than other extracts. These compounds, which were expected to be active on antioxidant capacity and ND inhibition, were expected to have different dissolution char- acteristic, antioxidant capacity, influence on ND action, and contents in sorghum grain. Therefore, we selected the HGC –methanol extract for further analysis.
Identification of compounds isolated from the sorghum cultivar HGC
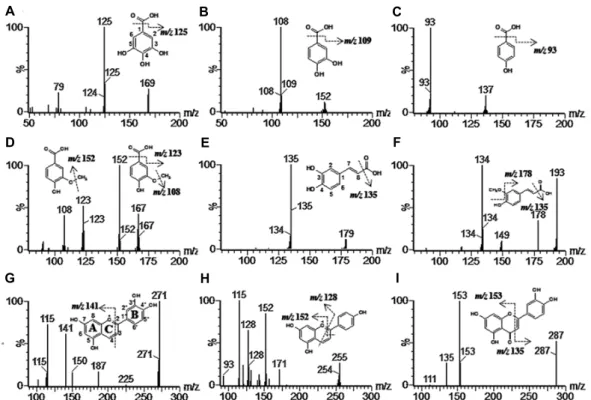
The HGC–methanol extract yielded fractions containing discrete peaks from repeated column chromatographic sepa- rations, and nine phenolic compounds were identified using NMR and LC/MS/MS. The LC/MS/MS chromatograms are shown in Fig. 1, and their UV–VIS absorption maxima,
Table 1. Yields, antioxidative effects, and ND inhibitory activities of extracts of two sorghum cultivar grains prepared using four different solvents
Cultivars Extraction solvent Extraction yield (%)a)
Antioxidative effect IC50 (μg/ml)b) ND inhibitory activity IC50 (μg/ml) c)
DPPH ABTS
HGC
Hexane Ethyl acetate
Methanol 70% Ethanol
15.0 11.5 5.9 5.2
>1,000
>1,000 108.6±47.9
83.2±2.7
>1,000
>1,000 94.0±23.3
85.6±2.4
33.1±6.6 25.3±0.1 1.8±0.1 3.4±0.1
HC
Hexane Ethyl acetate
Methanol 70% Ethanol
11.9 4.7 5.6 4.7
>1,000
>1,000 381.2±18.7
>1,000
>1,000
>1,000 541.8±34.1
>1,000
16.8±0.3 19.6±0.8
>200
>200
a)Extraction yields are represented as g/100 g dry weight.
b)All extracts were assayed in a set of experiments repeated three times. The IC50 values represent the concentration of a compound that scavenged 50% of the free radicals.
c)All extracts were assayed in a set of experiments repeated three times. IC50 values represent the concentration of a compound that inhibited enzyme activity by 50%.
Table 2. UV–VIS absorption maxima, LC-retention times, and MS data of phenolic compounds isolated from the sorghum cultivar HGC
Compound number
UV max (nm)
tR at 254 nm (min)
Molecular ion [M-H] (m/z)
Fragment ions in
ESI/MS (m/z) Identification References
1 2 3 4 5 6 7 8 9
215.2 217.6 255.4 219.9 323.3 323.3 486.9 473.6 356.3
1.5 2.9 4.3 5.3 5.6 8.2 9.2 10.2 12.8
169 [M-H]- 152 [M-H]- 137 [M-H]- 167 [M-H]- 179 [M-H]- 193 [M-H]- 271 [M-H]+ 255 [M-H]+ 287 [M-H]+
125, 79 108 93
152, 123, 108 135
178, 134 141, 115 152, 128, 115
153, 135
Gallic acid Protocatecuic acid p-hydrobenzoic acid Vanillic acid Caffeic acid Ferulic acid Luteolinidin Apigeninidin Luteolin
23, 24 23, 24 23, 24 23, 24 23, 24 23, 24 25 25 26 retention times, molecular ions, and fragmentation ion pat-
terns were compared with already published values (Table 2). Compounds 1-3 and 5 yielded molecular ions [M-H]− at m/z 169, 152, 137 and 179. The fragment ions at m/z 125, 108, 93 and 135 with the same fragmentation pattern were generated by the loss of a carboxyl group (Fig. 1.A–C, 1.E).
Compounds 1-3 and 5 were identified as gallic acid, proto- catechuic acid, p-hydroxybenzoic acid, and caffeic acid re- spectively, according to the NMR data and comparison with already published data [20, 21]. Compounds 4 and 6 ex- hibited a molecular ion [MH]− at m/z 167 and 193, and produced a fragment ion at m/z 152, 123 and 108 in com- pound 4, and 178 and 134 in compound 6 with sequential loss of a methyl and a carboxyl groups (Fig. 1.D, 1.F).
Compounds 4 and 6 were identified as vanillic acid and ferulic acid, respectively, in agreement with already pub- lished data [9, 11]. Compounds 7-9 yielded molecular ions
[M-H]+ at m/z 271, 255 and 287, respectively (Fig. 1.G–I).
According to the characterization of the C ring, fragments of compound 7 were detected at m/z 141 and 115, fragments of compound 8 at 152, 128, and 115, and fragments of com- pound 9 at 153 and 135. The compounds were identified as luteolinidin, apigeninidin, and luteolin according to pub- lished fragmentation patterns [20, 22], NMR data, and LC-retention times.
Antioxidative effects and ND inhibitory activities of phenolic compounds isolated from sorghum cultivar HGC
The antioxidative and ND inhibitory activities of the nine polyphenol compounds are shown in Table 3. The activities of all compounds, except compound 5, were higher in the ABTS assay than in the DPPH assay, and compounds 1 and 7 were highly active in both. The activity of compound
A B C
D E F
G H I
Fig. 1. Spectra of LC/MS/MS fragmentation patterns of compounds 1-9 isolated from sorghum cultivar HGC. (1), gallic acid;
(2), protocatechuic acid; (3), p-hydrobenzoic acid; (4), vanillic acid; (5), caffeic acid; (6), ferulic acid; (7) luteolinidin; (8), apigeninidin; (9), luteolin.
Table 3. The antioxidative effect, ND inhibitory activities, and mechanisms of inhibition of the phenolic compounds isolated from HGC
Compound Antioxidative effect IC50 (μM)a)
ND inhibitory activity
DPPH ABTS IC50 (μM)b) Type of inhibition (Ki, μM)
1 2 3 4 5 6 7 8 9c)
18.2±4.3 54.7±9.3
-d) - 34.4±1.3 73.9±2.9 10.9±0.5 237.9±6.2 31.6±2.7
15.0±0.2 41.5±0.5
- 31.2±2.4 41.2±4.8 19.3±0.6 8.6±3.0 9.3±0.4 29.8±0.7
- - - - - - 26.3±0.6 24.3±1.2 12.9±3.8
cNDe) ND ND ND ND ND
Noncompetitive (28.1±1.9) Noncompetitive (19.4±1.1) Noncompetitive (19.4±0.4)
a)All extracts were assayed in a set of experiments repeated three times. The IC50 values represent the concentration of compound that scavenged 50% of free radicals.
b)All compounds were examined in a set of experiments repeated three times. The IC50 values represent the concentrations of compounds that inhibited enzyme activity by 50%.
c)Luteolin was used as a positive control.
d)Free radical scavenging and ND inhibitory activities were very low (0%-7.2% at 100 μM).
e)Not determined.
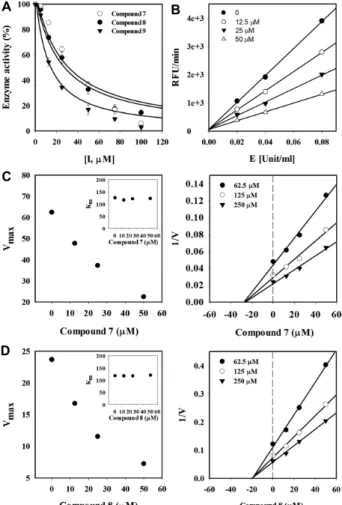
8 in the ABTS assay was high, and its activity in the DPPH assay was lower than those of the other compounds. ND activity was markedly inhibited by compounds 7 and 8 with the IC50 values of 26.3±0.6 μM and 24.3±1.2 μM, respectively (Fig. 2A, Table 3). To the best of our knowledge, this is the first study to demonstrate the ability of compounds 7
and 8 to inhibit ND activity. Compound 9 is a known ND inhibitor [9, 24], and was used as a positive control. The ND inhibitory activity of compound 8 was slightly lower than that of compound 9 and similar to that of compound 7. The inhibition of ND by compound 8 was concentration dependent (Fig. 2B). The plots of enzyme activity versus
A B
C
D
Fig. 2. Effect of compounds 7-9 on ND activity and graphical determination of the mechanism of inhibition. (A) Enzyme activity expressed as a function of inhibitor concentration. (B) Enzyme activity expressed as a func- tion of enzyme concentration using different concen- trations of compound 8. Panels (C) and (D) show the modified Lineweaver–Burk and Dixon plots for com- pounds 7 and 8, respectively.
Fig. 3. Binding modes of docked compounds within the activity site of ND. Overlay of the active site of the ligand free structure and compounds. The ND is shown in gray and the substrates are shown in stick: Compound 7 (oxygen in red, carbon in yellow), compound 8 (oxygen in red, carbon in orange), compound 9 (oxygen in red and car- bon in green).
enzyme concentration were linear and intercepted the y-axis near the origin, indicating that compound 8 was a reversible inhibitor. The mechanisms of inhibition of ND by com-
pounds 7 and 8 were determined using a modification of the Lineweaver–Burk and Dixon plots (Fig. 2C, 2D). Vmax
values decreased as a function of increased concentrations of both compounds and Km values maintained a constant value. As shown in the Dixon plots, the inhibition curves for each concentration intercepted the same point on the negative x-axis, indicating that the two compounds were noncompetitive inhibitors and those bind the free enzyme and the enzyme–substrate complex. Ki values were de- termined from the Dixon plots, in which the x-axis intercept is equal to −Ki. Ki values for compounds 7 and 8 were 28.1±1.9 μM and 19.4±0.4 μM, respectively (Table 3). As previously reported, the inhibitory activity of compound 9 is mediated by the presence of hydroxyl groups and absence of glycosides [1]. The flavonoid moieties of compounds 7 and 8 are identical, and their structures are similar to that of compound 9 with a structural difference at the C-ring.
We found that this structural analogy may affect the in- hibitory activities of compounds 7-9 during the enzyme–
substrate interaction.
Molecular docking simulation of phenolic com- pounds isolated from sorghum cultivar HGC
To determine effect of chemical structure, inhibitor’s binding modes in the ND active site were analyzed via mo- lecular docking calculation using by AUTODOCK (Fig. 3).
The least stable binding mode with energy of -4.6 kcal/mol for compound 9 was obtained, and energy of compound 7 and 8 were very similar to that of compound 9 with the value of -5.05 kcal/mol and -5.04 kcal/mol, respectively.
The docking suggests that the those compounds 7-9 were binding cell into the active binding site interacting with the well conserved binding modes and residues of compounds 7-9 were very similar. Those compounds were interacting with side chain of active site residues. As mentioned above,
A
B
C
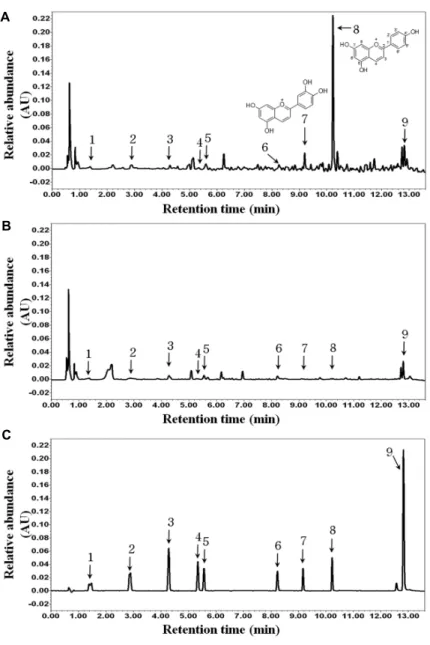
Fig. 4. UPLC profiles of nine polyphenols in HGC and HC extracts. (A) HGC, (B) HC, (C) Standard chemicals. The peak re- tention times were as follows: peak 1 (compound 1, gallic acid), tR = 1.5 min, peak 2 (compound 2, protocatechuic acid), tR = 2.9 min, peak 3 (compound 3, p-hydrobenzoic acid) tR = 4.3 min, peak 4 (compound 4, vanillic acid), tR
= 5.3 min, peak 5 (compound 5, caffeic acid), tR = 5.6 min, peak 6 (compound 6, ferulic acid) tR = 8.2 min, peak 7 (compound 7, luteolinidin), tR = 9.2 min, peak 8 (compound 8, apigeninidin), tR = 10.2 min, and peak 9 (compound 9, lu- teolin) tR = 12.8 min.
Table 4. Content of phenolic compounds (compounds 1-9) of the sorghum cultivars HGC and HC
Compound Content of phenolic compoundsa) (mg/100 g)
HGC HC
1 2 3 4 5 6 7 8 9
5.5±0.7 5.4±0.4 2.2±0.1 4.2±0.1 16.3±0.5 9.1±0.8 28.1±4.1 75.3±5.1 18.6±0.6
6.8±0.2 2.0±0.2 3.1±0.0 1.5±0.1 8.9±0.0 6.4±0.1 trb)
tr 19.5±0.2
Total 164.6±9.8 48.2±0.4
a)All extracts were examined in a set of experiments repeated three times.
b)Traced.
structural differences in C-ring of three compounds existed, therefore, 4-oxygen C-ring of compound 9 was key inter- acted with side chain of Arg555. It may be make compound 9 more tightly interact with ND. The molecular docking of the binding mode of compounds 7-9 should strong pro- vide clues to understand how the inhibitor compound bound to the ND active site.
Quantitative analysis of phenolic compound content of two sorghum cultivars
The content of the candidate polyphenols responsible for the antioxidant effects and ND inhibitory activity in HGC and HC were quantified using UPLC. Chromatograms of the methanol extracts prepared from HGC and HC are shown in Fig. 4. The total amount of polyphenols in HGC
was 164.6±9.8 mg/100 g, approximately was higher by a factor of 3.4 than that in HC extract (Table 4 and Fig. 4).
We found it of interest that different compounds were iden- tified as major components of HGC and HC. Compound 8 was the most abundant compound in the HGC extract and compound 9 was the most abundant compounds in the HC extract (approximately 50% and 40%, respectively).
In HGC, the sum of the contents of three major compounds 7, 8 and 9, which markedly inhibited ND activity, was 121.9±10.6 mg/100 g; however, compound 9 accounted for 19.5±0.2 mg/100 g, the rest two compounds were present at trace levels in HC. These results suggest that HGC, which contained nine polyphenols in abundance, was a more effec- tive antioxidant and inhibitor of ND activity than HC.
Furthermore, the HG extract was a poor inhibitor of ND;
therefore, these findings suggest that HGC sorghum cultivar may serve as a resource for producing antioxidants and ant influenza agents.
Conclusion
In conclusion, we assessed for the first time the anti- oxidative effect and ND inhibitory activity of new Korean red waxy sorghum cultivar HGC, and compounds isolated from HGC. We found that methanol extracts of HGC strong- ly inhibited ND activity and exhibited antioxidant activity.
Compounds 7 (luteolinidin) and 8 (apigeninidin) were iso- lated from this extract, and we show here that they sig- nificantly inhibited ND activity. Compounds 7 and 8 were present at relatively high levels in HGC, and we also identi- fied compound 9 (luteolin), which is a known inhibitor of ND. Based on these results, we conclude that the Korean sorghum cultivar HGC can be applied to preparing food for humans and feed for domestic animals, with the poten- tial benefit of preventing and controlling diseases caused by oxidative damage and infection with influenza virus.
Acknowledgements
This work was carried out with the support of the
“Cooperative Research Program for Agriculture Science &
Technology Development (Project title: Research of stand- ardization functional compounds and useful metabolite change Project No. PJ009257032015)”, Rural Development Administration (RDA), Republic of Korea.
References
1. Amarowicz, R, Rahimi-Moghaddam, P., Barl, B. and Weil, J. A. 2004. Free-radical scavenging capacity and antioxidant activity of selected plant species from the Canadian prairies.
Food Chem. 84, 551-562.
2. Atkinson, W. and Hamborsky, J. 2012. Centers for Disease Control and Prevention. Influenza. In: Epidemiology and Prevention of Vaccine-Preventable Diseases. J. Cereal Sci.
12th edn, 151-171.
3. Awika, J. M., Rooney, L. W. and Waniska, R. D. 2004.
Properties of 3-deoxyanthocyanins from sorghum. J. Agric.
Food Chem. 52, 4388-4394.
4. Basler, C. F. and Aguilar, P. V. 2008. Progress in identifying virulence determinants of the 1918 H1N1 and the Southeast Asian H5N1 influenza A viruses. Antiviral Res. 79, 166-178.
5. Bralley, E., Greenspan, P., Hargrove, J. L. and Hartle, D.
K. 2008. Inhibition of hyaluronidase activity by select sor- ghum brans. J. Med. Food 11, 307-312.
6. Corfield, T. 1992. Bacterial sialidases--roles in pathogenicity and nutrition. Glycobiology 2, 509-521.
7. Dicko, M. H., Traore, A. S., Voragen, A. G. J. and Berkel, W. J. H. V. 2006. Phenolic compounds and related enzymes as determinants of sorghum for food use. Biotechnol Mol.
Biol. Rev. 1, 21-38.
8. Eropkin, M., Gudkova, T. M., Konovalova, N. I., Shcheka- nova, S. M., Iaglovskaia, I. B., Eropkina, E. M. and Kiselev, O. I. 2007. Antiviral action of some antioxidants/anti- hypoxants and their combinations with remantadine against human influenza A(H3N2) virus studied in in vitro models. Eksp Klin Farmakol 70, 33-37.
9. Fang, N., Yu, S. and Prior, R. L. 2002. LC/MS/MS charac- terization of phenolic constituents in dried plums. J. Agric.
Food Chem. 50, 3579-3585.
10. Halliwell, B. 2009. The wanderings of a free radical. Free Radic. Biol. Med. 46, 531-542.
11. Hossain, M. B., Rai, D. K., Brunton, N. P., Martin-Diana, A. B. and Barry-Ryan, C. 2010. Characterization of phenolic composition in Lamiaceae spices by LC-ESI-MS/MS. J. Agric.
Food Chem. 58, 10576-10581.
12. Jeong, H. J., Ryu, Y. B., Park, S. J., Kim, J. H., Kwon, H.
J., Kim, J. H., Park, K. H., Rho, M. C. and Lee, W. S. 2009.
Neuraminidase inhibitory activities of flavonols isolated from Rhodiola rosea roots and their in vitro anti-influenza viral activities. Bioorg Med. Chem. 17, 6816-6823.
13. Kim, Y. S., Ryu, Y. B., Curtis-Long, M. J., Yuk, H. J., Cho, J. K., Kim, J. Y., Kim, K. D., Lee, W. S. and Park, K. H.
2011. Flavanones and rotenoids from the roots of Amorpha fruticosa L. that inhibit bacterial neuraminidase. Food Chem.
Toxicol. 49, 1849-1856.
14. Morris, G. M., G, D. S., Halliday, R. S., Huey, R., Hart, W. E., Belew, R. K. and Olxon, A. J. 1998. Automated dock- ing using a Lamarckian genetic algorithm and an empirical binding free energy function. J. Comput. Chem. 19, 1639-1662.
15. Newstead, S. L., Potter, J. A., Wilson, J. C., Xu, G., Chien,
초록:황금찰수수(Sorghum bicolor L. cv. Hwanggeumchalsusu) 유래 에탄올 추출물 및 폴리페 놀계 화합물의 항산화 활성 및 뉴라미니데이즈 억제 효과
나지은1,2†․서경혜1†․고지연1․이미자1․강현중1․김선림1․정일민2․서우덕1*
(1농촌진흥청 국립식량과학원, 2건국대학교 환경생명과학대 응용생명학과)
본 연구는 황금찰수수의 에탄올 추출물을 이용하여 항산화 활성 및 뉴라니미데이즈 억제 효과를 조사하였다.
헥산, 에틸아세테이트, 메탄올과 70% 에탄올 조추출물에서 항산화력의 IC50값을 비교한 결과 70% 에탄올 추출물
이 DPPH 라디칼 소거능, ABTS 라디칼 소거능에서 각각 83.2±2.7, 85.6±2.4 μg/ml으로 가장 높았고, 뉴라니미데이
즈 억제활성 IC50값을 비교한 결과 메탄올 추출물에서 1.8±0.1 μg/ml로 나타났다. 또한 황금찰수수 추출물에서
컬럼크로마토그래피와 UPLC-PDA-MS/MS 분광기 분석을 통해, Gallic acid (1), Protocatecuic acid (2), p-Hydroxy benzoic acid (3), Vanillic acid (4), Caffeic acid (5), Ferulic acid (6), Luteolinidin (7), Apigeninidin (8), Luteolin (9), 총 9종의 폴리페놀 화합물을 확인하였다. 또한 각각의 화합물에 대한 항산화력의 IC50값을 비교한 결과 Luteolinidin이 DPPH 라디칼 소거능, ABTS 라디칼 소거능에서 각각 10.9±0.5, 8.6±3.0 μM로 가장 우수 하였고,
뉴라니미데이즈 억제활성은 Luteolin이 12.9±3.8의 IC50값과 비경쟁적 저해모델을 보였다. 결과적으로 황금찰수수
는 높은 항산화 효과와 뉴라미니데이즈 억제활성을 보여 식품, 사료 등의 새로운 기능성소재로 다양하게 활용될 수 있음을 시사한다.
C. H., Watts, A. G., Withers, S. G. and Taylor, G. L. 2008.
The structure of Clostridium perfringens NanI sialidase and its catalytic intermediates. J. Biol. Chem. 283, 9080-9088.
16. Potier, M., Mameli, L., Belisle, M., Dallaire, L. and Melan- con, S. B. 1979. Fluorometric assay of neuraminidase with a sodium (4-methylumbelliferyl-alpha-D-N-acetylneur- aminate) substrate. Anal. Biochem. 94, 287-296.
17. Ryu, Y. B., Curtis-Long, M. J., Lee, J. W., Ryu, H. W., Kim, J. Y., Lee, W. S. and Park, K. H. 2009. Structural character- istics of flavanones and flavones from Cudrania tricuspida- ta for neuraminidase inhibition. Bioorg Med. Chem. Lett. 19, 4912-4915.
18. Schauer, R. 2004. Sialic acids: fascinating sugars in higher animals and man. Zoology (Jena) 107, 49-64.
19. Seo, W. D., Kim, J. Y., Han, S. I, Ra, J. E., Lee, J. H., Song, Y. C., Park, M. J., Kang, H. W., Oh, S. K. and Jang, K.
C. 2011. Relationship of radical scavenging activities and anthocyanin contents in the 12 colored rice varieties in Korea. JABC 54, 693-699.
20. Shih, C. H., Siu, S. O., Ng, R., Wong, E., Chiu, L. C., Chu, I. K. and Lo, C. 2007. Quantitative analysis of anticancer 3-deoxyanthocyanidins in infected sorghum seedlings. J.
Agric. Food Chem. 55, 254-259.
21. Tirzitis, G. and Bartosz, G. 2010. Determination of anti- radical and antioxidant activity: basic principles and new insights. Acta Biochim. Pol. 57, 139-142.
22. Wolfender, J. L., W. P, Ndjoko, K., Hobby, K. R. and Major, H. J. 2000. Evaluation of Q-TOF-MS/MS and multiple stage IT-MS for the dereplication of flavonoids and related com- pounds in crude plant extracts. Analusis 28, 895-906.
23. Yang, L., Browning, J. D. and Awika, J. M. 2009. Sorghum 3-deoxyanthocyanins possess strong phase II enzyme in- ducer activity and cancer cell growth inhibition properties.
J. Agric. Food Chem. 57, 1797-1804.
24. Zhang, L., Cheng, Y. X., Liu, A. L., Wang, H. D., Wang, Y. L. and Du, G. H. 2010. Antioxidant, anti-inflammatory and anti-influenza properties of components from Chaeno- meles speciosa. Molecules 15, 8507-8517.