명상이 집중도에 미치는 영향조사를 위한 EEG 뇌파 분석
조준모*
EEG Brainwave Analysis for Research on Meditation Influence to the Concentration
Jun-Mo Jo* 요 약
현대의 복잡한 도시생활로 인하여 많은 이들이 크고 작은 정신적인 스트레스를 호소하고 있으며 이에 따라 각종 정신질환에 노출되어 있다. 특히, 학생이나 직장인 할 것 없이 많은 이들이 집중력 부족으로 인하여 일 의 능률 저하나 양질의 생활 유지에 어려움을 가지고 있다. 이러한 집중력을 향상시키기 위해 명상이 대안으 로 떠오르고 있으며, 이러한 명상이 집중력에 어떠한 형태로 영향을 미치는지 알아보기 위해 EEG 뇌파를 활 용하여 실험하였다. 명상경험자를 실험대상으로 하였으며 뇌의 좌우반구의 전전두엽 영역에 배치된 AF3와 AF4영역을 중점적으로 관찰하고 분석하였다. 그 결과 리듬성 활동 뇌파의 특유한 패턴과 파워 스팩트럼의 변 화를 관찰할 수 있었다.
ABSTRACT
Many people complain their big or little stress due to the complicated city life in modern times, so they are exposed of the mental illness. Especially, not only students and office workers but also most people suffer from degradation of efficiency at work and keeping the high quality of life because of the insufficiency of concentration ability. To improve the concentration ability, the meditation is a substitution. The influence of meditation for the concentration ability is experimented with EEG brainwave. Some experienced meditators are participated for the experiments, and the left and right portion of prefrontal lobe, AF3 and AF4, are measured and analyzed. As a result, the changes of rhythmic activity of a unique pattern and power spectra are observed.
키워드
Brainwave(EEG), Concentration, Meditation, SMR Wave, Alpha Wave, Theta Wave 뇌파(EEG), 집중력, 명상, SMR파, 알파파, 세타파
* 교신저자(corresponding author) : 동명대학교 전자공학과([email protected])
접수일자 : 2014. 08. 25 심사(수정)일자 : 2014. 11. 25 게재확정일자 : 2014. 12. 15
Ⅰ. Introduction
Many people in the industrialized countries suffer from excessive stress and are exposed of the mental illness. Especially, in Korea, from most of
the elementary to high school students have that kind of stress and complaints about their lack of concentration while they are studying. There are some researches that the meditation helps to improve the concentration ability as well as to
resolve the stress.
There are some experiments related to the meditation using 19 EEG channels to find out the function of the brains. They were established by functional connectivities between brain regions. The EEG was recorded before, during and after that meditation exercise. The head surface EEG data were recomputed into 19 cortical regional source model time series. Mostly the locations of elec- trodes are mainly prefrontal lobe of both left and right hemisphere[1].
Another research is related on the changes in EEG and autonomic nervous activity during medi- tation and their association with personality traits.
They have carefully experiment the EEG with the meditation as the attainment of a restful yet fully alert physical and mental state practiced by many as a self-regulatory. The result showed that the power on EEG predominantly in the frontal area[2].
Another research related on the meditation is to analyze the brainwaves related to human conc- entration using visual stimulus is to induce the concentration. The visual stimulus tasks were presented to subjects for concentration. The method is to measure EEG signals with several channels and analyze the signals into several frequency bands[3]. The concentration is mostly related to the SMR, Alpha and Theta waves. There is an interesting research by measuring and analyzing the brainwaves to observe the characteristics of human drowsiness. The basic method is to analyze the EEG signals from subjects according to the frequency band and the Alpha wave[4].
The Theta wave gradually increases as well as the concentration within most of their sessions.
Furthermore that was consistent with the subject's acknowledgments of tiredness as well as reports of increases in anterior Theta with sustained concentration and cognitive demands[5].
In chapter II, the basic concepts are related to the measuring meditation EEG signals. Then, in
chapter III, the rhythmic activities related on the concentration are elaborated. In chapter IV, the result of experiments and analysis will be elaborated. Finally, there will be the explanation of the unique patterns of rhythmic activity and power spectra.
Ⅱ. Measuring Meditation EEG Signals
2.1 Measuring EEG Signal
There are some rhythmic activities from the human brain. The EEG is classically composed of four frequency bands. The Delta, Theta, Alpha, and Beta waves have their own frequency bands like 0-3Hz, 4-7Hz, 8-12Hz and 13-24Hz respectively.
The EEG is classically described as occurring between 0 and 30Hz, and recent work and precise notch digital filtering has defined a gamma frequency greater than 24Hz extending to 50-60Hz[6].
For analysis, this study used Discrete Fourier Transform to observe the signals in the frequency domain and Pearson Product-Moment Correlation Coefficient to quantify the correlation between the signals. To obtain EEG signals, the Discrete Fourier transform is used because they reveal periodicity in input data as well as the relative strengths of any periodic components. The discrete Fourier transform of areal sequence of numbers will be a sequence of complex numbers of the same length. The equation (1) is shown below[7].
(1)
The Concentration Index(CI), a state on con- centration, can be calculated with power spectrum of EEG. The concentration factors Theta, SMR and mid Beta waves represent as P(ɵ), P(SMR) and P(mid ϐ) respectively[8]. However, the Alpha wave
is also a critical rhythmic activity[5],[9], so the mid Beta is replaced by the Alpha wave in this paper.
The equation is shown as below(2).
(2)
2.2 EEG Signals for Concentration
There is some specific field like SMR waves related to the concentration, but it is also part of the Beta wave. The rhythmic waves of brain are dramatically changing while meditator meditates. In usual daytime activity of human brain generates Beta waves. When the meditators meditate, the rhythmic waves go down to the Alpha waves and stay in relaxation or calm state. The experienced meditators can go further to the state of Theta waves which is deep state of meditation.
There are some locations where the electrodes are placed in the surface of head as shown in Fig.
1. AF3, and AF4 are the prefrontal lobe of left and right hemisphere respectively. These two signals of the location will be used for this experiment in this paper since the prefrontal lobe is very sensitive to the meditation.
Fig. 1 Electrode location for EEG signal
Ⅲ. Meditation Experiments
For the experiment, I have carefully examined
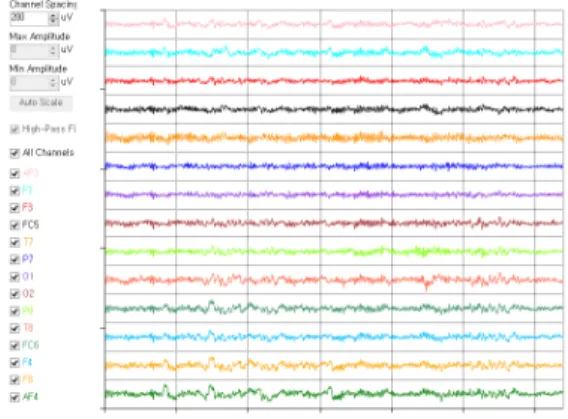
both on the changes of the rhythmic activity and the power spectra of frequencies related to the concentration fields such as SMR, Alpha and Theta waves during experiments. There are 5 experienced meditators are participated for this experiments, and they have 2, 3, 4, 12, 15 years of meditation experiences. Each meditators meditated for 10 minutes for this experiment. The meditators have used ‘Emotiv EPOC’ device with 14 channels of electrodes. The EEG signals measured by ele- ctrodes are shown in Fig. 2. For the main channels using in these experiments, the two channels of frequencies will be used; one is AF3 and AF4 shown at the first line and the last line in Fig. 4.
Likewise, other EEG data is geographically symmetric in the picture. The ‘P’ stands for
‘Parietal lobe’, the ‘O’ stands for ‘Occipital lobe’ and so on.
Fig. 2 14 Frequencies of channels
The concentration related rhythmic activity waves are Theta, Alpha and SMR waves. There are many related researches on the subjects.
Frontal Theta, while associated with increasing memory load, also synchronize with task demands, focused attention, sustained concentration and meditation. And gaining in music performance was associated with the elevation of Theta over Alpha, and termed the Alpha/Theta protocol, and the SMR[9].
IV. Experiment Results and Analysis
4.1 Changes of Rhythmic Activity
In order to analyze the concentration aspects with the EEG signals, analyzing both on the AF4 and AF3 is essential. However, the graphs of AF3 will be omitted in this section since AF4 and AF3 have the same pattern.
Through the experiments, the changes of the rhythmic activity of AF4 during the meditation will be compared and analyzed in this section. The specific rhythmic waves such as SMR, Alpha and Theta are selected and analyzed since they are the waves related to the concentration. The ‘Custom’
waves showing in the figures in this section are set for the SMR(13~15Hz) waves.
4.1.1 Start Stage of Meditation
The start stage of meditation means that the meditators just sit for the meditation from usual activity. So he or she might be in the state of stress, uncomforted or fatigue before he or she comes to the meditation.
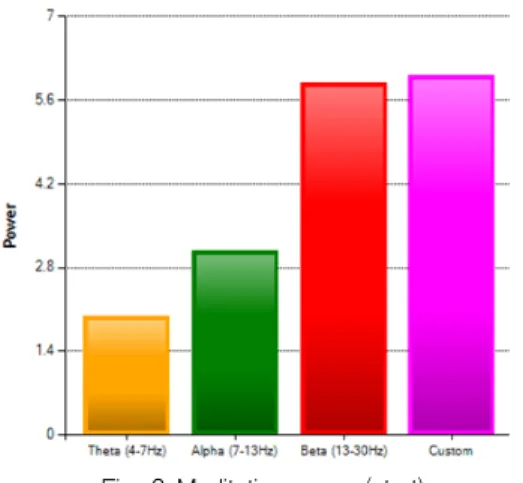
Fig. 3 Meditation waves(start)
The Fig. 3 shows the rhythmic waves of the beginning period. The Theta, Alpha, Beta and the Custom waves are shown in order. The Custom wave is set as SMR waves. The waves from AF4
show that the meditators just started to meditate from usual activity. The Beta wave dominates over all other waves. The well-known wave field SMR as a concentration factor showed the similar results with the graph of Beta since they have an overlapping portion. We can see the experienced meditators having a great improvement on the SMR wave in a short period of time.
4.1.2 Middle Stage of Meditation
The middle stage of meditation means that the meditators are in the state of meditation. The meditators who are in this state usually started to feel a relaxation and comfort. The Fig. 4 shows the middle(5 minutes of meditation) period of the experiment. The SMR wave has been decreased and the Alpha wave has been increased. It is obvious that the meditators are in the state of meditation. Moreover, the concentration is also increased in the deeper state.
Fig. 4 Meditation waves(mid)
4.1.3 End Stage of Meditation
The end stage of meditation means that the meditators are in the deep state of meditation. The meditators who are in this state are similar with the state of sleeping, but they are in conscious.
The Fig. 5 shows the end(10 minutes of medi- tation) period of the experiment. The Theta wave finally dominates over the Alpha wave. That means
the meditator is in the state of deep meditation as well as the concentration factor.
Fig. 5 Meditation waves(end)
4.2 Changes of Power Spectra
Unlike with the rhythmic changes, the power spectra pattern of AF4 and AF3 are somewhat different. So in this section, the power spectra of each AF4 and AF3 are described and analyzed.
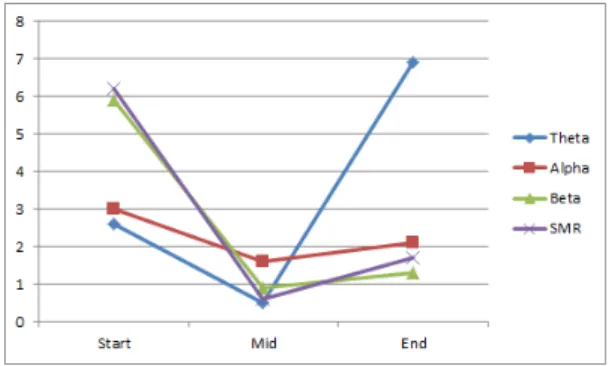
The Fig. 6 and Fig. 7 are the changes of the power spectra of AF4 and AF3 respectively. X axis shows that the 3 periods of meditation and Y axis shows the power spectra level.
The AF4, the prefrontal lobe of right hemi- sphere, shown in Fig. 6, showed that every rhythmic waves started with high level of powers, but they gradually went down and went up at the end of simulation.
Fig. 6 Changes of power spectra(AF4)
The patterns are similar with the graph of AF3 shown in Fig. 7. But the Fig. 7 shows that the patterns are evenly distributed, unlike the graphs shown in Fig. 6. The Theta wave shown in AF4 severly increased the end of the meditation. The 4 meditators out of 5 showed the same results.
Fig. 7 Changes of power spectra(AF3)
V. Conclusion
There are some researches related on the meditation that improves concentration ability. To find out the influence of meditation for the concentration ability, some experienced meditators are experimented with EEG brainwave. There has been many researches measured in the various areas in a brain however the specific areas of AF3 and AF4 are measured and analyzed in this paper.
At first, there is a sequence of pattern in the rhythmic activity by the levels of concentration. If the meditator in the shallow meditation state, SMR wave dominates among other waves such as Alpha and Theta waves. If the meditator in the deeper level of meditation, the Alpha wave dominates among others. Finally, if the meditator in the de- epest state of meditation, the meditator is in the highest level of concentration with the Theta wave.
Secondly, the changes of power spectra between AF4 and AF3 have similar pattern that there was a declination from ‘start’ to the ‘mid’ state, then
goes up to the end of the meditation.
With the result of this paper, we can verify the density of concentration at certain period of time during a meditation.
For the further study, influence of meditation for drowsiness will be studied by analyzing many portions of brainwaves simultaneously.
References
[1] D. Lehmanna, P. L. Fabera, S. Tei, R. D. Pas- culal-Marqui, P. Milz, and K. Kochi, “Reduced functional commnectivity between cortical so- urces in five meditation traditions detected with lagged coherence using EEG tomography,”
Neuroimaging, Elsevier, Sec. 60, 2012, pp.
1574-1586.
[2] T. Takahashi, T. Murata, T. Hamada, M.
Omori, H. Kosaka, M. Kikuchi, H. Yoshida, and Y. Wada, “Changes in EEG and autonomic nervous activity during mediation and their association with personality traits,” Int. J. of Psychophysiology, Elsevier, Sec. 55, 2005, pp.
199-207.
[3] Y.-S. Jang and J.-W. Han, “Analysis of EEG Generated from Concentration by Visual Sti- mulus Task,” J. of the Korea Institute of Electronic Communication Sciences, vol. 9, no. 5, 2014, pp. 589-594.
[4] Y.-S. Jang, S.-L. Lee, and S.-A. Ryu, “Cha- racteristics of Frequency Band on EEG Signal Causing Human Drowsiness,” J. of the Korea Institute of Electronic Communication Sciences, vol.
8, no. 6, 2013, pp. 949-954.
[5] H. F. Unterrainer, M. J. Chen, and J. H.
Gruzelier, “EEG-neurofeedback and psychody- namic psychotherapy in a case of adolescent anhedonia with substance misuse,” Int. J. of Psychophysiology, Elsevier, Sec. 93, 2014, pp.
84-95.
[6] J. W. Sleigh, D. A. Steyn-Ross, M. L. Steyn-Ross, M. L. Williams, and P. Smith, “Comparison of changes in electroencephalo-graphic measures during induction of general anaesthesia: influence of the gamma frequency band and elect- romyogram signal,” Br. J Anaesth, Sec. 1, 2001, pp. 50-58.
[7] C. E. Reyes, J. L. C. Rugayan, C. Jason, G.
Rullan, C. M. Oppus, and G. L. Tangonan, “A Study on Ocular and Facial Muscle Artifacts in EEG Signals for BCI Applications,” In Proc.
IEEE Conf., TENCON, Cebu, Philippine, Nov.
2012, pp. 1-6.
[8] Y.-S. Jang, G.-C. Park, and D.-W. Han,
“Comparison of EEG Characteristics between Dementia Patient and Normal Person Using Frequency Analysis Method,” J. of the Korea Institute of Electronic Communication Sciences, vol.
9, no. 5, 2014, pp. 595-600.
[9] J. H. Gruzelier, “EEG-neurofeedback for opti- mising performance,” Neuroscience and Biobe- havioral Reviews, Elsevier, vol. 44, July 2014, pp.
124-141.
저자 소개
조준모(Jun-Mo Jo)
1991년 아이오아주립대학교 컴퓨 터과학과 졸업 (공학사)
1995년 경북대학교 대학원 컴퓨터 공학과 졸업(공학석사)
2004년 경북대학교 대학원 컴퓨터공학과 졸업(공학 박사)
1998년~현재 동명대학교 전자공학과 교수
※ 관심분야 : 이동통신, 뇌파통신, 뇌과학