1. INTRODUCTION
One of the biggest problem we are facing in the 21st century is the accumulation of mental fatigue.
It can negatively impact our performance at work, family life, and social relationships. But it is diffi- cult to detect the mental fatigue level without any medical equipment. Mental fatigue has been mainly assessed by using electroencephalographic (EEG) measures [1, 2]. So many people with it do not know they got mental fatigue.
Mental fatigue is the result of brain over-activ- ity. It can happen when a person expends too much mental effort on a project or task. Basically, it makes our brain overwork, leaving us exhausted, hampering our productivity and overall cognitive function. The most common symptoms include
mental block, lack of motivation, irritability, stress eating, loss of appetite and insomnia [3].
Research shows that mental fatigue results in an inability to concentrate and an increase in sim- ple mistakes. Mental fatigue may lead to feeling stressed, irritated and even depressed. What's more, being in a state of mental fatigue not only affects people's well-being, it also spills over into their interactions with family and others they as- sociate with. It's draining for them to be around someone who is continuously mentally exhausted.
If left unchecked, mental fatigue can also lead to all sorts of serious health problems, including anxi- ety and burnout. So it has been highly required to develop a system that enables people's mental fa- tigue to be monitored continuously without any medical expert or equipment.
Human Mental Condition Monitoring through Measurement of Physiological Signals
Natsagdorj Ulziibayar†, Sanghoon Kang††, Hanhoon Park†††
ABSTRACT
Nowadays, one of the most common diseases is chronic mental fatigue syndrome. This can be caused by many factors, such as busy life, heavy workload, high population density, and adverse technological impact. Most office workers and students who are sitting all day long while being exposed to this kind of environments are likely to be involved in the mental illness. Therefore, to prevent the illness, it has been highly required to design a device that enables mental fatigue to be monitored continuously without human intervention. This paper proposes a linear regression method to reliably estimating the level of human mental fatigue using wearable physiological sensors, with an estimation error of 0.852. Also, this paper presents an Android application that is able to check mental health conditions in daily life.
Key words: Arduino-based Mental Condition Measurement, Wearable Physiological Sensors, Mental Fatigue Level Analysis, Android Application
※ Corresponding Author : Hanhoon Park, Address:
(608-737) Yongso-ro 45, Nam-gu, Busan, Korea, TEL : +82-51-629-6225, FAX : +82-51-629-6210, E-mail : [email protected]
Receipt date : Jun. 2, 2020, Revision date : Aug. 12, 2020 Approval date : Sep. 8, 2020
†††Dept. of Electronic Engineering, Pukyong National University (E-mail : [email protected])
†††Dept. of Electronic Engineering, Pukyong National University (E-mail : [email protected])
†††Dept. of Electronic Engineering, Pukyong National University
※ This work was supported by the Pukyong National University Research Fund in 2019.
In this paper, we design an Arduino-based sys- tem that would measure the mental fatigue, which is easy to measure, light and body fit. When people have mental fatigue, the value of blood pressure, heart rate, and body temperature changes because of the reaction of heart, kidney and liver. Therefore, we use Arduino-compatible wearable sensors to measure those physiological signals. Then, we cal- culate mental fatigue levels using these the phys- iological values by linear regression. Finally, we present an Android application that is implemented to check mental health conditions in daily life.
This paper is an extension of our previous work [4] and includes more details for system imple- mentation and extended experimental results.
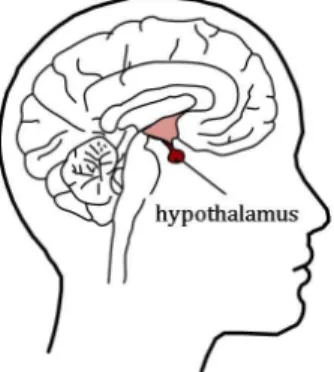
2. MENTAL FATIGUE MEASUREMENT The hypothalamus is a small region of the brain (Fig. 1) and plays a crucial role on keeping the body in a healthful, balanced state as much as possible.
The body is always trying to achieve this balance.
Feelings of hunger, for example, are the brain's way of letting its owner know that they need more nutrients [5]. This hypothalamus acts as the con- nector between the endocrine and nervous systems in many essential functions of the body such as:
body temperature, thirst, appetite, weight control, emotions, sleep cycles, sex drive, childbirth, blood pressure, heart rate, production of digestive juices and balancing bodily fluids [6]. Because of the ac-
tivity of hypothalamus, when people get mental fa- tigue, lots of symptoms appear in their body, in- cluding changes in vital signs such as blood pres- sure, heart rate, and body temperature. Therefore if we have sensors that can measure the physio- logical signals, we can detect our mental fatigue level [3].
We measure three physiological signals (heart rate, blood pressure and body temperature) and formularize the relationship between the physio- logical measurements and the mental fatigue levels as follows.
(1)
Here, F, HR, BR and T denote mental fatigue level, heart rate, blood pressure and body temper- ature, respectively. The ground-truth stress levels are obtained from survey results using a mental fatigue indicator questionnaire (described in the subsequent subsection). Thus, the unknown func- tion Ψ can be estimated by regression.
We use Arduino-compatible sensors to measure the physiological signals. The details for the sen- sors will be explained in the subsequent subsec- tions.
2.1 Blood pressure sensor
To measure blood pressure, the wrist blood pressure monitor, HBP-700, is used. The automatic blood pressure monitor has its own pressure sensor which is 2SMPP-02 (Fig. 2). It inflates a cuff sur- rounding an arm with sufficient pressure to pre-
Fig. 1. Location of the human hypothalamus. Fig. 2. Pressure sensor, 2SMPP-02.
vent blood flow in the local main artery. This pres- sure is gradually released until the moment that the blood begins to flow through the artery, the measurement of which determines the systolic pressure. Pulse rate is also sensed at the same time with blood pressure. The measurement taken when the blood flow is no longer restricted determines the diastolic pressure. This measurement cycle is performed automatically with a pressure pump and pressure sensor [7].
2.2 Heart rate sensor
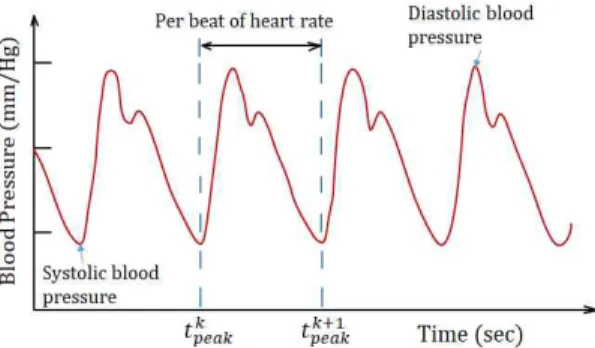
The HBP-700 device does not have its own heart rate sensor. But it detects heart beats from the blood pressure graph (Fig. 3). When our heart beats, it squeezes and pushes blood through our arteries to the rest of body. This force creates pressure on those blood vessels, and that is systolic blood pressure. So if we count each systolic (or diastolic) blood pressure we can detect heart rate in beats per minute (BPM) [8].
(2)
Here,K is the number of systolic blood pressure in a certain length of time.
2.3 Body temperature sensor
Body temperature is a measure of human body's ability to make and get rid of heat. The average normal temperature is 37°C (= 98.6°F). It can be measured on several body parts, such as the fore-
head, mouth, rectum, armpit and ear [8].
With an analog thermometer, temperature var- iations cause a change in the volume of the liquid, which in turn causes it to rise or fall in a small tube. A card bearing some numbers is placed near the tube, and by comparing the height of the col- umn to the nearest number, a human can “digitize”
the temperature and turn it into a string of digits.
A digital thermometer works in somewhat the same way. There are things that change their elec- trical resistance with temperature, or generate a voltage proportional to temperature in several dif- ferent ways. But still, the result is an analog repre- sentation of temperature. The signal can then be sent to some sort of “analog to digital converter”
which outputs a string of digits representing a best approximation to the continuous analog signal. The string of digits is then “scaled” — divided or multi- plied as needed — to get the result in the expected
“Celsius” units.
In this paper, we use DS18B20 human body tem- perature sensor (Fig. 4) whose electrical resistance changes exponentially with change in temperature.
The sensor can be placed on armpit and connected with Arduino micro-controller directly [9].
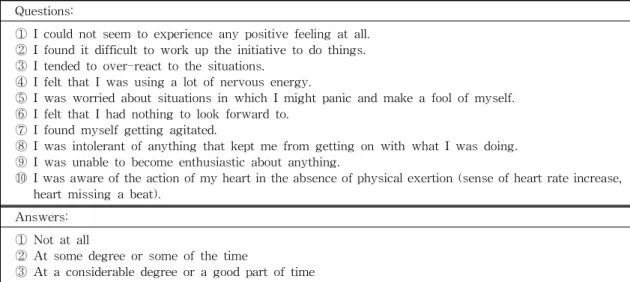
2.4 Mental fatigue indicator questionnaire To get the ground truth for the mental fatigue level, we use a mental fatigue indicator ques- tionnaire which was developed by Loviband [10].
By answering mental fatigue indicator questions, we can find out how tired people are mentally.
There are four choices to answer for each question.
By selecting the choices that best describe how of-
Fig. 3. Calculating heart rate in blood pressure graph. Fig. 4. Temperature sensor, DS18B20.
ten one experiences each mental fatigue indicator during a week, the mental fatigue is scaled to 10 levels [11]. The questionnaire consists of ten ques- tions and four answers [12] (Table 1).
3. SYSTEM CONFIGURATION
In order to monitor the human mental fatigue/
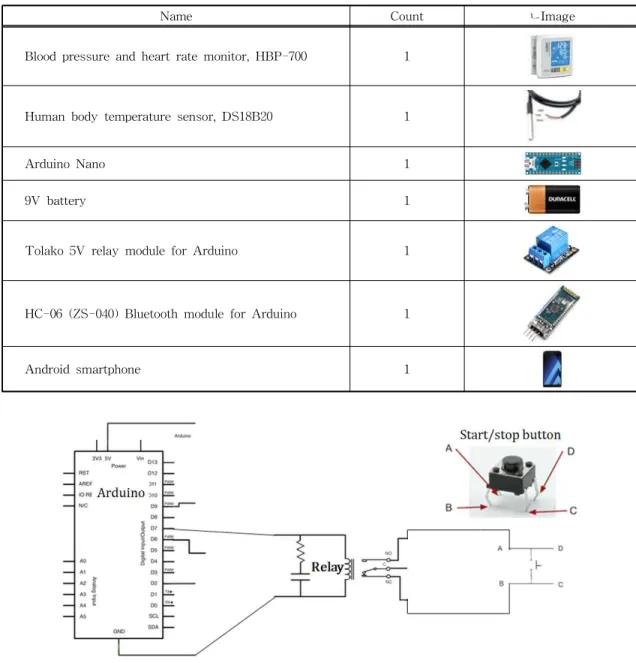
condition using the proposed method, various de- vices are required, which includes the sensors for measuring the physiological signals, a micro-con- troller for controlling the sensors, a smartphone for interacting with the user, a relay switch for turning on/off the system and a device for supporting the communication between the micro-controller and the smartphone. Table 2 shows the hardware com- ponents we chose to build our system. The main reasons why to choose these components were be- cause they were accurate, fast, small, and light.
Also these components are easy to use and cheap to build our system.
All the components including sensors are wired or wirelessly connected to Arduino micro-con- troller (Fig. 5) [13]. After collecting the physio- logical signals from the sensors, the data is sent to the Android phone via Bluetooth wireless com-
munication. Then the data is processed and the mental fatigue level is determined in an Android application.
Our system should work automatically to meas- ure about 3-5 times per day. However, the HBP- 700 has only start/stop button and need to push the button manually to run it. That is why we used a relay switch to turn on/off the device automati- cally. In other words, we used the 5V relay instead of the start and stop button of the HBP-700 device to measure blood pressure and heart rate. To make a connection we need to connect the relay pins NO and NC to the A and B pins of start button in the HBP-700 device (Fig. 6).
Table 1. Mental fatigue indicator questionnaire Questions:
① I could not seem to experience any positive feeling at all.
② I found it difficult to work up the initiative to do things.
③ I tended to over-react to the situations.
④ I felt that I was using a lot of nervous energy.
⑤ I was worried about situations in which I might panic and make a fool of myself.
⑥ I felt that I had nothing to look forward to.
⑦ I found myself getting agitated.
⑧ I was intolerant of anything that kept me from getting on with what I was doing.
⑨ I was unable to become enthusiastic about anything.
⑩ I was aware of the action of my heart in the absence of physical exertion (sense of heart rate increase, heart missing a beat).
Answers:
① Not at all
② At some degree or some of the time
③ At a considerable degree or a good part of time
④ Very much or most part of the time
Fig. 5. System configuration and process flow.
4. EXPERIMENTS AND DISCUSSION For experiment, heart rate, blood pressure and body temperature were measured from 80 partic- ipants who are of different genders and ages and have different mental fatigue levels. Measurements were taken when the participants were at rest sit- ting on the chair as shown in Fig. 7. Measurements
may be affected by the unknown measuring envi- ronments or the physical condition of the partic- ipants. In this paper, we assume that such a varia- tion is ignorable. The participants also filled out the mental fatigue questionnaire after the meas- urement. The participants were divided into two groups: 50 for estimating the unknown function model in Eq. (1) and 30 for testing the estimated Table 2. Hardware components used to build our system
Name Count ㄴImage
Blood pressure and heart rate monitor, HBP-700 1
Human body temperature sensor, DS18B20 1
Arduino Nano 1
9V battery 1
Tolako 5V relay module for Arduino 1
HC-06 (ZS-040) Bluetooth module for Arduino 1
Android smartphone 1
Fig. 6. Adding a relay to turn on/off the system automatically.
model.
Firstly, we tried to find out the relationship (ψ in Eq. (1)) between mental fatigue levels and the individual physiological measurements. As shown in Fig. 8, it turned out that, as one of physiological values increased, the mental fatigue level also increased. That means all the physiological values are proportional to mental fatigue levels (this has also been confirmed in a number of previous stud- ies [3]). In this paper, we assumed that the rela- tionships are linear (most samples are well fitted to a straight line in Fig. 8). So, we defined the func- tion ψ in Eq. (1) as a linear function as follows.
(3)
From the physiological measurements and ques- tionnaire results collected from the participants, the weightsw1,w2andw3were calculated by linear re- gression as follows.
·· ·· ··
· · ·
··
·
(4)Here, N is the number of measurements (50 in our experiments). Before the regression, the meas- urements and fatigue levels were normalized to [0, 1]. In our experiment, the results are that:w1= 0.69,
w2 = 0.28 andw3= 0.038. The human mental fatigue was more strongly correlated to heart rate and blood pressure than body temperature. This may be because the range of changes in body temper- ature is relatively small (at most 3°C) and the tem- perature sensor is not sufficiently accurate. With these weights, we evaluated the accuracy of esti- mating the human mental fatigue of 30 participants using Eq. (3). The mean absolute error was 0.852 and its standard deviation was 0.571. Here, the er- ror means the difference between the estimated fa- tigue level and that obtained from the questionnaire method. Therefore, our system can be used as a Fig. 7. Measuring mental fatigue.
Fig. 8. Correlation of heart rate, blood pressure and body temperature to mental fatigue level. The straight line represents the asymptotic line of data points.
reliable mental fatigue measurement device.
To monitor mental fatigue continuously, an Android application that communicates with the Arduino was implemented. As shown in Fig. 9, the application is designed easy to use and understand [14]. It consists of three screens (activities) that appear sequentially. In the screen ‘A’, there is a Bluetooth connection button to connect the smart- phone with the Arduino Nano. And, there are a memory button to save measurements and a time setup button to allow measuring mental fatigue in a set time. In the screen ‘B’, the physiological meas- urement values received from the Arduino Nano are displayed. And the last screen shows the re- sults of the mental fatigue level and the mental condition.
5. CONCLUSION
In this paper, we proposed a linear regression method for estimating human mental fatigue levels from physiological signals measured using wear- able sensors. Then, we implemented an Android application wirelessly connected with an Arduino- based sensing system for daily-monitoring of hu- man mental fatigue/condition. By using the appli- cation, we confirmed that people's mental fa- tigue/condition can be monitored easily without any medical expert or equipment.
In this paper, we assumed the linear relationship between physiological signals and mental fatigue levels. However, to monitor human mental con- dition more accurately, we will attempt to find out a more sophisticated model by learning the un- known relationship using a neural network.
REFERENCE
[ 1 ] Mental Fatigue Measurement Using EEG (2010), https://www.intechopen.com/books/
risk-management-trends/mental-fatigue- measurement-using-eeg (accessed June 19, 2020).
[ 2 ] Y.W. Kim and H.B. Kang, “An Analysis of Visual Distraction and Cognitive Distraction Using EEG,” J ournal of Korea Multimedia Society, Vol. 21, No. 2, pp. 166-172, 2018.
[ 3 ] T. Arai, Mental Fatigue, Doctor’s Thesis of Columbia University, 1912.
[ 4 ] U. Natsagdorj, K.S. Moon, and H. Park,
“Mental Fatigue Monitoring System Using Physiological Sensors,” Proceeding of the Summer Conference of the Korea Institute of Convergence Signal Processing, pp. 26-27, 2019.
[ 5 ] S.B. Nuland, The Mysteries Within: A Sur- geon Explores Myth, Medicine, and the Human Body, Simon and Schuster, New York, United States, 2001.
[ 6 ] B. Dudas, The Human hypothalamus: Anat- omy, Functions and Disorders (Neuroscience Research Progress), Nova Science Publish- ers, New York, United States, 2013.
[ 7 ] E. Kaniusas, Biomedical Signals and Sensors I: Linking Physiological Phenomena and Bio- signals, Springer Science and Business Media, Berlin, Germany, 2012.
[ 8 ] M.D. Rienzo, G. Mancia, G. Parati, A. Pedotti, and A. Zanchetti,Frontiers of Blood Pressure and Heart Rate Analysis, IOS Press, Amster- dam, Netherlands, 1997.
[ 9 ] Y. Houdas and E.F.J. Ring, Human Body Temperature: Its Measurement and Regula- tion, Springer, Berlin, Germany, 1982.
[10] P.F. Lovibond and S.H. Lovibond, “The Structure of Negative Emotional States: Com- parison of the Depression Anxiety Stress Scales (DASS) with the Beck Depression and Anxiety Inventories,”Behaviour Research and Therapy, Vol. 33, No. 3, pp. 335-343, 1995.
[11] J.L. Wilson, Adrenal Fatigue: The 21st Cen- tury Stress Syndrome, Smart Publications, Petaluma, Canada, 2001.
[12] Mental Fatigue Questionary Test, https://www.
15minutes4me.com/fatigue-2/fatigue-test-
your-fatigued-or-exhausted-feeling/ (accessed June 19, 2020).
[13] K. Iniewski,Embedded Systems: Hardware, Design and Implementation, Wiley, New Jersey, United States, 2012.
[14] D. Saffer,Designing for Interaction: Creating Innovative Applications and Devices, New Riders, San Francisco, United States, 2009.
Natsagdorj Ulziibayar He received the BS degree from MUST Darkhan School of Technology in 2017. He is cur- rently a MS student at Pukyong National University. His re- search interests include em- bedded systems and biosignal processing.
Sanghoon Kang
He received the BS degree in electronics engineering from Pukyong National University in 2018. He is currently a MS stu- dent at Pukyong National Uni- versity. His research interests include image steganography and artificial intelligence.
Hanhoon Park
He received the B.S., M.S., and Ph.D. degrees in electrical and computer engineering from Han- yang University, Seoul, Korea, in 2000, 2002, and 2007, respec- tively. From 2008 to 2011, he was a post-doctoral researcher with NHK Science and Technology Research Labor- atories, Tokyo, Japan. In 2012, he joined the Depart- ment of Electronic Engineering, Pukyong National University, Busan, Korea, where he is currently a Professor. His current research interests include aug- mented reality, human–computer interaction, and af- fective computing.