• 검색 결과가 없습니다.

The Impact of COVID-19 Pandemic on Stock Markets: An Empirical Analysis of World Major Stock Indices

N/A
N/A
Protected

Academic year: 2021

Share "The Impact of COVID-19 Pandemic on Stock Markets: An Empirical Analysis of World Major Stock Indices"

Copied!
12
0
0

로드 중.... (전체 텍스트 보기)

전체 글

(1)

Print ISSN: 2288-4637 / Online ISSN 2288-4645 doi:10.13106/jafeb.2020.vol7.no7.463

1

First Author and Corresponding Author. School of Finance, Zhongnan University of Economics and Law, China [Postal Address: No. 182, Nanhu Avenue, Donghu New Technology Development Zone, Wuhan City, Hubei Province, 430073, China], Email: [email protected]

2

Henan University, Kaifeng city, Henan Province, China.

Email: zhhwcxf @hotmail.com

3

School of Finance, Zhongnan University of Economics and Law, China. Email: [email protected]

4

School of Finance, Zhongnan University of Economics and Law, China. Email: [email protected]

5

School of Finance, Zhongnan University of Economics and Law, China. Email: [email protected]

6

School of Economics, Zhongnan University of Economics and Law, China. Email: [email protected]

© Copyright: The Author(s)

This is an Open Access article distributed under the terms of the Creative Commons Attribution Non-Commercial License (http://Creativecommons.org/licenses/by-nc/4.0/) which permits unrestricted noncommercial use, distribution, and reproduction in any medium, provided the original work is properly cited.

The Impact of COVID-19 Pandemic on Stock Markets: An Empirical Analysis of World Major Stock Indices

Karamat KHAN

1

, Huawei ZHAO

2

, Han ZHANG

3

, Huilin YANG

4

, Muhammad Haroon SHAH

5

, Atif JAHANGER

6

Received: May 03, 2020 Revised: May 24, 2020 Accepted: June 07, 2020

Abstract

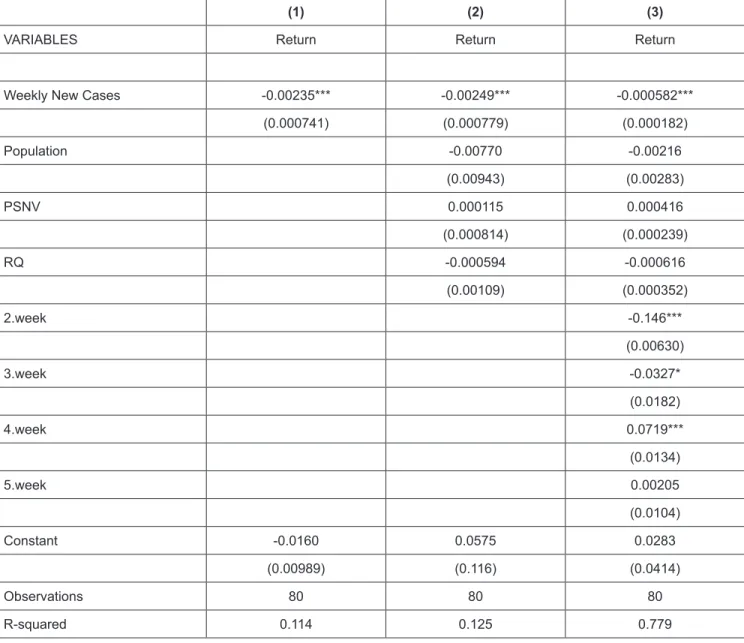
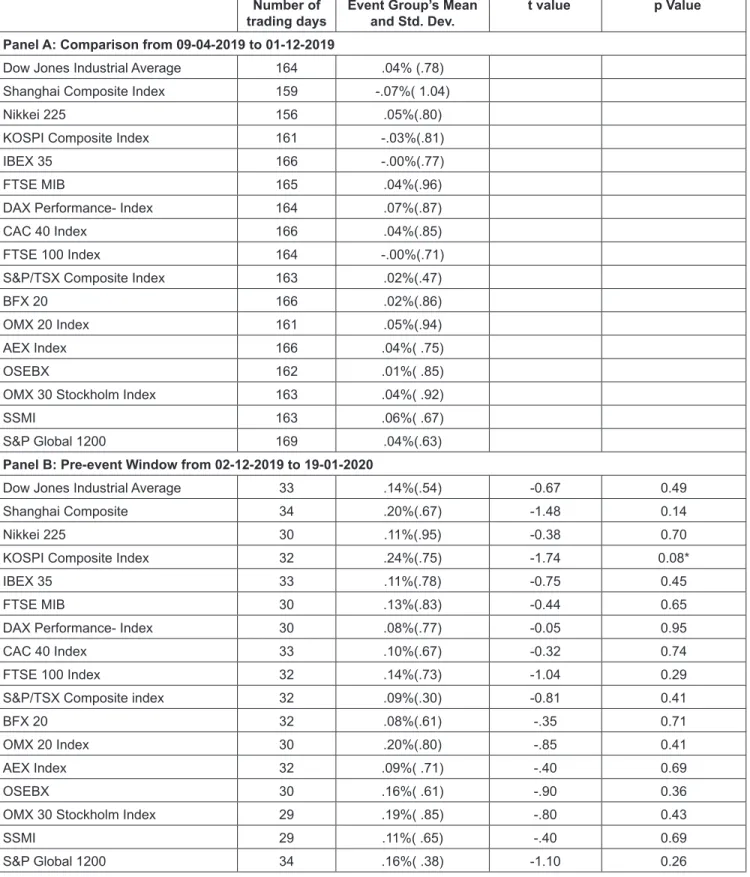
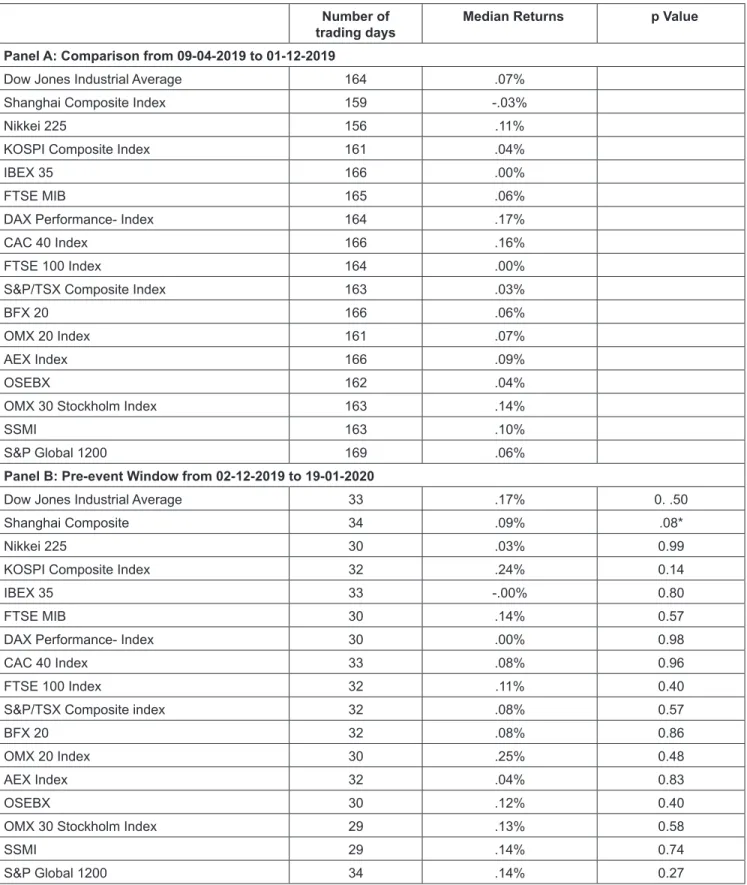
This study aims to investigate the impact of COVID-19 pandemic on the stock markets of sixteen countries. Pooled OLS regression, conventional t-test and Mann-Whitney test are used to estimate the results of the study. We construct a weekly panel data of COVID-19 new cases and stock returns. Pooled OLS estimation result shows that the growth rate of weekly new cases of COVID-19 negatively predicts the return in stock market. Next, the returns on leading stock indices of these countries during the COVID-19 outbreak period are compared with returns during the non-COVID period. We use a t-test and Mann-Whitney test to compare the returns. The results reveal that investors in these countries do not react to the media news of COVID-19 at the early stage of the pandemic. However, once the human-to-human transmissibility had been confirmed, all of the stock market indices negatively reacted to the news in the short- and long-event window.

Interestingly, we noticed that the Shanghai Composite Index, which was severely affected during the short-event window, bounced back during the long-event window. This indicates that the Chinese government’s drastic measures to contain the spread of the pandemic regained the confidence of investors in the Shanghai Stock Market.

Keywords : COVID-19, SARS, Pandemic, Stock Return, New Cases JEL Classification Code: G40, G41, I15, I18

1. Introduction

The future economic impact of the COVID-19 is extremely uncertain due to the spread of the disease as

the death rate, severity of the disease, the response from policymakers, and individual behavior are unknown (Baldwin & Mauro, 2020; McKibbin & Fernando, 2020;

OECD, 2020)this paper explores seven different scenarios of how COVID-19 might evolve in the coming year using a modelling technique developed by Lee and McKibbin (2003.

The disease also added fuel to the uncertainty by causing massive disruption in the lives of people around the world.

The phenomenon, which was not imaginable in the past, is happening in today’s world where more than a third of the world population live life under the curfew or curfews-like situations, fear, panic buying, closure of businesses, factories and educational institutions (Ramelli & Wagner, 2020). The governments are desperately making efforts to contain the health and economic effects of the COVID-19 pandemic (Fiscal Monitor, 2020)

Notwithstanding this situation, the Global Risks Report,

published on 15 of January 2020, said that the top five risks

that the world may face in the long term are all environmental

issues (WEF, 2020). The “infectious disease” because of its

rare occurrence is placed at number 10 in terms of its impact

(albeit the fact that the researchers at the Wuhan Institute of

(2)

Technology predicted the possibility of SARS-MERS like coronavirus outbreaks. For example, a study published in March 2019 concluded that “it is highly likely that future SARS- or MERS-like coronavirus outbreaks will originate from bats, and there is an increased probability that this will occur in China” Fan et al., 2019). Align with that report, the corporate decision-makers and politicians were also paying attention to the traditional sources of risks or at most the climate change issues that may affect the business and economic activities.

It was a few weeks after the World Economic Forum’s Global Risks Report when the WHO, on March 11, declared the COVID-19 as a pandemic (WHO, 2020c). The emergence of COVID-19 and its spread to more than 150 countries within two months brought worldwide attention to the fact that the disease is not only a medical health issue, but also halted the business and economic activities, and the outbreak could cause more severe threats to the global economy in the long run.

Since the appearance of the COVID-19, many leading business newspapers and articles in the popular press suggested that the disease would cause a tremendous setback to the economies of the affected countries. However, contrary to the logic, there is some research work related to the past epidemic of Severe Acute Respiratory Syndrome (SARS), which found that the outbreak had no effect on the investment and economy or it was minimal and temporary.

Keogh-Brown & Smith (2008) concluded that the economic impact of the SARS epidemic was far smaller than suggested by the studies or anticipated by the media at the time of the outbreak.

This study aims to investigate the impact of COVID-19 pandemic on the stock markets because the stock market provides an updated summary of what the investor believes that the effect of the COVID-19 pandemic eventually is.

Based on the theoretical framework derived from the efficient market theory and rational expectations intertemporal asset pricing theory (Chen et al., 1986; Merton, 1973) security prices always fully reflect all available information and whenever a particular asset is influenced by systematic economic news, no extra reward can be earned by bearing diversifiable risk. Therefore, we could expect that there must be a strong relationship between the COVID-19 pandemic and the return on the stock market indices.

To our knowledge, the studies by Chen, Lee, Lin and Chen (2018) and Nippani and Washer (2004) are the only articles that directly analyzed the impact of the SARS epidemic on the stock markets. Therefore, the significance of this study is threefold. First, the current study is the first which will examine the impact of the COVID-19 pandemic on stock market indices. Secondly, although the pandemic is still unfolding its effects on the lives of people and economy, this study will provide a baseline conclusion for future

research. Third, the study will extend the existing knowledge on the impact of epidemics/pandemics on the stock markets.

2. Literature Review

The recently published Financial Stability Report in April 2020 said that the pandemic has a significant impact on the financial systems, and further escalation of the crisis could affect the global financial stability (Global Financial Stability Report, 2020). As discussed in another recently published report, which named the crisis as “The Great Lockdown” the pandemic could contract the global economy by 3%, which is much worse than the global financial crisis of 2008-09 (World Economic Outlook, 2020). While commenting on the impact of the COVID-19 pandemic in the financial markets, the report said that the “Equity markets experienced the fastest drop in history ….” (Global Financial Stability Report, 2020). Amid all this COVID-19 pandemic crisis, the governments across the world, introducing support packages to protect the people and most affected firms from the economic impact of the COVID-19 Pandemic (Fiscal Monitor, 2020).

Wren-Lewis (2020), based on certain assumptions, claimed that the COVID-19 pandemic would significantly affect the GDP due to reduction in the production and change in consumer demands. Further, the pandemic will worsen the situation in case if the banks failed to meet the financing needs of the firms due to a sudden fall in demand. This will ultimately lead to the collapse of the stock markets around the world. Boon, Haugh, Pain and Salins (2020) described three channels through which the COVID-19 pandemic may affect the global economy. The closure of factories, cutbacks in the service sector, disruption in the worldwide supply chain will lead to an overall decline in the supply. On the other hand, the significant drop in travel and tourism, education and other entertainment services will affect the demand side.

Finally, increases in the uncertainty of the environment will lead to a rise in the opportunity cost of investment. Ramelli and Wagner (2020) examined the impact of COVID-19 pandemic on stock price reactions in US firms. They concluded that the pandemic led to an extremely negative and volatile aggregate market reactions. Notably, the firm exposure to China and the share of foreign revenues resulted is associated with substantially lower cumulated abnormal returns over the study period.

However, we also reviewed past literature about the impact of the SARS epidemic on the economy and stock markets. The results are still inconclusive in this regard that the SARS epidemics affected the economy or stock markets.

For example, Siu and Wong (2004) examined the impact of the

SARS epidemic on the Hong Kong economy. Overall, their

study found a significant, but temporary effect of the SARS

epidemic on the demand side, with domestic consumption and

(3)

service industries, specifically, travel and air industries severely effected in the short-run. However, findings showed no effect on the supply side. On the other hand, Chou, Kuo, and Peng (2004)the government’s measures to contain the outbreak, and the actual economic impacts of SARS on Taiwan’s economy, this paper presents the results of a multiregional computable general equilibrium model (Global Trade Analysis Project model version 6.2 provided evidence that the SARS epidemic affected the economies of Taiwan and China.

Nippani and Washer (2004), using a non-parametric Mann-Whitney test and heteroscedastic t-test, investigated the impact of the SARS epidemic 2003, on the stock market returns of eight countries. Their findings suggested no effect of the SARS epidemic on the stock markets of these countries. Surprisingly, they found that most of the stock market indices outperformed during the SARS period.

Wong (2008) explored the impact of the SARS epidemic on the Hong Kong real-estate market. The researcher found a negative effect of the SARS epidemic on the average prices. However, the study concluded the absence of the overreaction to the disease outbreak.

Chen et al. (2018) examined the effect of the SARS epidemic on the integration of China and four Asian stock markets. They concluded that the epidemic weakens the relationship between China and the Asian stock markets.

Ali, Nassir, Hassan and Abidin (2010) explored the short-run stock overreaction to the domestic and international events in the Malaysian stock market. They provided evidence of the Malaysian stock market overreaction behavior to the SARS outbreak. Chen, Jang, and Kim (2007) investigated the impact of the SARS epidemic on the stock prices of hotel companies traded at the Taiwan Stock Exchange. The research found a significantly negative effect of the outbreak on the performance of hotel stock. The study suggests that the tourism industry is the most vulnerable segment which could be severely affected during the epidemics.

Chen, Chen, Tang and Huang (2009), using an event study approach, examined the impact of the SARS epidemic on different sectors of the economy. The study indicated that the epidemic negatively affected the retail, wholesale and tourism industries, but the epidemic positively affected the stock prices associated with the biotechnology sector.

According to Chen, Chen and Lee (2013) the SARS outbreak affected the stock returns from the service industry in the Philippine and the basic material industry in Hong Kong. The findings of these empirical studies show that the investor would respond to the COVID-19 pandemic through the adjustment of stock prices in stock markets.

3. Research Methods and Materials

The study examines the impact of COVID-19 pandemic;

the following stock indices were chosen: The DJIA to

represent the United States, the Shanghai Composite Index to represent the PRC China, the Nikkei 225 to represent Japan, the KOSPI Composite Index to represent South Korea, the IBEX 35 to represent Spain, the FTSE MIB to represent Italy, the DAX Performance- Index to represent Germany, the CAC 40 Index to represent France, the FTSE 100 Index to represent the United Kingdom, the S&P/TSX Composite Index to represent Canada, the BFX 20 to represent Belgium, the OMX 20 Index to represent Denmark, the AEX Index to represent Netherland, the OSEBX to represent Norway, the OMX 30 Stockholm Index to represent Sweden and the SSMI to represent Switzerland. According to WHO, COVID-19 is a pandemic disease and till April 11, 2020, at least 203 countries or territories reported cases with COVID-19 (WHO, 2020c). We expect the impact of the pandemic on stock markets worldwide. Therefore, we included the S&P Global 1200 Index to represent the global equity market.

The S&P global 1200 index consists of almost 70% of global market capitalization and it is composed of 7 indices which are recognized as dominant and major indices in their regions.

The above indices are considered the most representative indices of these countries’ and region’s stock markets. The data for the daily closing value of each of these indices for the period 09 April 2019 to 03 April 2020 is obtained from Investing.com (2020), S&P Dow Jones Indices (2020) and Yahoo Finance (2020).

We use Wikipedia to find the exact chronology of the occurrence of COVID-19 and major events from the time- period 1st of December 2019 to 20th of January 2020 (Wikipedia, 2020). According to the South China Morning Post, the government records suggest that the first case of COVID-19 was a 55-year-old man reported on 17th November 2019, in the Hubei province of China (Ma, 2020).

However, this claim comes into contradiction with The Lancet, a peer-reviewed medical Journal’s date of December 1 (Cohen, 2020; Huang et al., 2020; Li et al., 2020)China, was caused by a novel betacoronavirus, the 2019 novel coronavirus (2019-nCoV.

It was late December when the COVID-19 began to appear in the popular press. The first public alert occurred on 31 December when the Wuhan Municipal Health Committee informed the World Health Organization (WHO) about the

“new pneumonia-like disease of unknown cause” detected

in the Wuhan, a capital city of Hubei province in PRC China

(WHO, 2020a) The Wuhan Municipal Health Committee on

its website issued an epidemiological alert about the new virus

and warned the general public to adopt preventive measure

(Wuhan Municipal Health Commission, 2019). The United

Nations agency activated its incident-management system in

anticipation of the potential spread of COVID-19 at a large

scale (Gale, 2020). The WHO, in a tweet on the 14th of

January 2020, said that no clear evidence of human to human

transmission is found during the preliminary investigation of

(4)

the novel coronavirus (World Health Organization, 2020.).

Six days later, the China National Health Commission, for the first time, confirmed the human to human transmission of the COVID-19 on the 20th of January, 2020 (Kuo, 2020).

South Korea and Japan and Thailand also reported first case of COVID-19 to the World Health Organization on the same date (WHO, 2020b).

Based on the above chronology of events, the entire period of study is divided into four periods to examine the impact of COVID-19 pandemic on financial stock markets. The first period is from 9th April 2019 to the 1st of December 2019.

We called this period as normal time and compared the stock market indices return in later three periods with a normal period. While considering the announcement of COVID-19 as a transmissible disease by human contact, a major event 20th of January, we called the second period from 2nd of December 2019 to 19th of January, 2020, a pre-event period.

We expect that during this time when the COVID-19 was not confirmed as a communicable disease but still appearing in the popular press all around the world, the stock market indices would react to the newspaper reports. However, the reaction may be negative but not as severe as the risk level was not yet identified during this period. The third sub-period is from the 20th of January, 2020 to 3th of February, 2020 is called a short-event window. This is the period when the COVID-19 was confirmed as human to human transmissible disease.

Therefore, we will examine the immediate impact of the NHC announcement of COVID-19 as communicable disease on the stock market indices, more specifically on the Chinese stock market index, as the disease was more prominent than other countries during this short time. Finally, the fourth sub- period is from 20th January 2020 to 3 April 2020. We called this period as long-event window and it examines the effect of COVID-19 pandemic on financial market indices during two months after the first announcement of COVID-19 as human to human transmissible disease.

This study would provide two-fold evidence of the effect of COVID-19 pandemic on the stock market indices.

Although currently the COVID-19 pandemic is affecting people in countries around the world and there is no publically available comprehensive data on the numbers of affected peoples in different countries, still we managed to create a small panel data of six weeks, on the number of new cases each week in sixteen countries (The first week starting from 17 February 2020 to 29 March 2020). The data comes from today’s headline real-time epidemic news (Today’s Headlines, 2020), which updates the data of the global epidemic situation every day. We used the weekly growth rate of new-cases of COVID-19 as the independent variable and regressed against the weekly stock market returns in next week for the sixteen mentioned economies while controlling for population, regulatory requirement, political stability and the time fixed effect. The data for the control variables

are taken from the world governance indicators and world development indicators. We performed the Hausman test and Breusch and Pagan Lagrangian multiplier test for random effects (xttest0) to select the appropriate panel data analysis technique, and results yield pooled OLS as proper estimation technique for our data.

Next, following the work of Nippani and Washer (2004), we used the Mann-Whitney test and heteroscedastic t-test to compare the difference in average daily return in the stock market indices of these countries during the COVID-19 period against the non-COVID or normal period. Contrary to Nippani and Washer (2004) work, where they compared the difference in the average daily return with the S&P Global 12000 index, we believe that the COVID-19 pandemic affecting more than 150 countries, therefore it will equally influence the S&P Global 1200 Index. Consequently, it would be inappropriate to compare the countries’ indices to the global index. However, we looked into the effect of COVID-19 pandemic on the S&P Global 1200 index as similar to country indices. Secondly, we used the date of first reported cases of COVID-19 and the date of announcement of COVID-19 as a human to human transmissible major events to divide the entire study period into four time-periods to compare the average daily returns. Third, the COVID-19 is still affecting people in many countries; therefore, instead of considering the end of the pandemic as a long event, we used almost two months after the announcement of human- human transmissibility as a long event.

The hypothesis for the panel data of sixteen countries is that the growth rate of weekly new cases would negatively predict the stock market return. However, using the heteroscedastic t-test and Mann-Whitney test, we estimated the impact of COVID-19 pandemic on the daily stock market returns of sixteen countries during the pre-event, short-event and long-event window. The performance of the stock market indices mentioned above is compared with the normal period. The daily returns are compared on these stock indices for the pre-event, short-event and long event window with the normal period daily returns.

4. Results and Discussion

The analysis begins by investigating whether weekly

new cases of COVD-19 significantly influence the weekly

return on stock market indices of sixteen countries. The

results are presented in three models. The model 1) uses

only Weekly New Cases as an independent variable, model

2) adds population, political stability and no violence and

regulatory requirements as control variables, model 3)

we expect that errors are correlated at a country level and

hence, robust standard errors that allow cluster correlation

is used. We reestimate our model with cluster errors in table

(5)

1, column 3 and added all control variables, including time fixed effects.

In light of interest to investigate the relationship between Weekly New Cases of COVID-19 and weekly stock market returns, we estimated a simple regression model. The results are provided in table 1, column 1.

We found that the growth rate of Weekly New Cases is negatively associated with stock market returns. The results are statistically significant at the level of p < .01.

This indicates that one unit change in Weekly New Cases decreases the stock market returns by a unit of .24%.

Note that the coefficient on Weekly New Cases reflects a percentage change of less than one percent.

In column 2, Table 1, we added control variables with Weekly New Cases to investigate the effect of our main independent variable on stock market returns. Once again, we found that Weekly New Cases negatively predicts return on stock market indices. The results are statistically significant at the level of p <. 01. We found that the coefficient on the Weekly New Cases increase by a small number from .24% to .25%. Finally, in model three, we added time fixed effect and clustered errors at the country level with all control variables. The results are robust, indicating a significantly negative impact of Weekly New Cases on stock market returns. However, the coefficients on Weekly New Cases decrease from .25% to only .06%.

We concluded from the results of linear regression, although the coefficient is very small but still significant for all three models. Therefore, the findings suggest that the COVIVID-19 pandemics affected the return on stock market indices.

Next, we estimated the extent to which the press reports and announcement of human-human transmissibility regarding the COVID-19 pandemic affected the return on stock market indices from sixteen countries. The results of the t-test comparing the performance of the countries’

financial market indices with a normal period are presented in Table 2. Panel A shows that all indices had a positive average daily return during the comparison period except for the Shanghai Composite Index, KOSPI Composite Index, IBEX 35 and FTSE 100 Index. Therefore, we expect that COVID-19 may affect the performance of these indices downward in the next three sub-periods when compared with the normal period. Panel B, in Table 2, compares the average daily return of the pre-event window with the normal period. It appears that none of these indices were affected during the pre-event window because of the newspaper reports of COVID-19.

All of the stock market indices, including the S&P Global 1200 Index outperformed the comparison period, suggesting that press reports on novel coronavirus did not affect these market indices shortly before the announcement

of new information that COVID-19 is a human to human transmissible disease. Panel C, in Table 2, clearly indicates this fact that all of the stock market indices underperformed during the short-event window when compared with the normal period. More specifically, the negative impact of COVID-19 Pandemic was more pronounced and sever for the Shanghai Composite Index in China, Nikkei 225 in Japan, KOSPI Composite Index in South Korea, CAC 40 Index in France and FTSE 100 Index in the United Kingdom.

The difference in average daily returns was statistically significant at the level of p < .01, .05 and .10 level of significance.

The results of the long event window are shown in Panel D of Table 2. Once again, we find that all of the indices, including the S&P Global, underperformed with the comparison period. The results are statistically significant for 13 stock indices out of 17 indices examined in this study. All results are statistically significant at the level of p < .01, p < .05 and p < .10. Surprisingly, the Composite Shanghai index which was statistically significant at p <

.01 level of significance in the short-event window, is found insignificant in the long event window. The results for the Shanghai Composite is unique and noticeable. It shows that investors in the Shanghai Composite Index negatively reacted to the news of transmissibility of the disease by human contact, in the short event window. However, the drastic measures taken by the Chinese government to contain the spread of the disease regained the confidence of the investors in China which explains the insignificant results in the long-event window (Global Financial Stability Report, 20).

We further investigated the impact of COVID-19 Pandemic on the financial market indices using the non- parametric Mann-Whitney test. The results of the Mann- Whitney test comparing the performance of the indices with a comparison period are presented in Table 3. Panel A shows that each index had a positive median return during the normal period except for the Shanghai Composite Index. Panel B compares the median return of the pre-event window with the comparison period. The results of the pre- event window in Panel B Table 3 are very similar to the heteroscedastic t-test in Table 2. It appears that some of the indices underperformed the comparison period, but none of these indices were severely affected during the pre-event window because of the newspaper reports of COVID-19.

Except for few indices like Nikkei 225, DAX Performance-

Index, CAC 40, AEX Index and OSEBX, all other indices

outperformed the comparison period. The findings show

that press reports on novel coronavirus disease did not

affect the stock market indices until the announcement of

the risk of human to human transmission on January 20,

2020.

(6)

Table 1: Linear Regression

(1) (2) (3)

VARIABLES Return Return Return

Weekly New Cases -0.00235*** -0.00249*** -0.000582***

(0.000741) (0.000779) (0.000182)

Population -0.00770 -0.00216

(0.00943) (0.00283)

PSNV 0.000115 0.000416

(0.000814) (0.000239)

RQ -0.000594 -0.000616

(0.00109) (0.000352)

2.week -0.146***

(0.00630)

3.week -0.0327*

(0.0182)

4.week 0.0719***

(0.0134)

5.week 0.00205

(0.0104)

Constant -0.0160 0.0575 0.0283

(0.00989) (0.116) (0.0414)

Observations 80 80 80

R-squared 0.114 0.125 0.779

Note: Standard errors in parentheses *** p<0.01, ** p<0.05, * p<0.1

The results of the Short-event window are presented in Panel C of Table 3. The result shows that after the announcement of COVID-19 as transmissible disease, most of the indices underperformed during the short-window period. However, no significant difference was found in the median returns of these indices. Next, we compared the median return of the long-event window with the comparison period. The results of the long-event window are reported in Panel D of Table 3. The finding suggests that the announcement of new information on 20th January negatively affected the performance of most of the indices in the long-event window. However, the difference in median

returns is significant only for the S&P Global 1200, Dow Jones Industrial Average and Nikkei 225 indices. The results are significant at the level of p < .01, and p < .05 level of significance. Once again, we found similar evidence that the Shanghai composite stock market index recovered during the long-event window.

5. Conclusions

The current study investigated the impact of COIVD-19

pandemic on the sixteen economies’ stock markets. Using

pooled OLS, t-test and Mann-Whitney test, we examined

(7)

Table 2: Differences in Mean Returns

Number of

trading days Event Group’s Mean

and Std. Dev. t value p Value Panel A: Comparison from 09-04-2019 to 01-12-2019

Dow Jones Industrial Average 164 .04% (.78)

Shanghai Composite Index 159 -.07%( 1.04)

Nikkei 225 156 .05%(.80)

KOSPI Composite Index 161 -.03%(.81)

IBEX 35 166 -.00%(.77)

FTSE MIB 165 .04%(.96)

DAX Performance- Index 164 .07%(.87)

CAC 40 Index 166 .04%(.85)

FTSE 100 Index 164 -.00%(.71)

S&P/TSX Composite Index 163 .02%(.47)

BFX 20 166 .02%(.86)

OMX 20 Index 161 .05%(.94)

AEX Index 166 .04%( .75)

OSEBX 162 .01%( .85)

OMX 30 Stockholm Index 163 .04%( .92)

SSMI 163 .06%( .67)

S&P Global 1200 169 .04%(.63)

Panel B: Pre-event Window from 02-12-2019 to 19-01-2020

Dow Jones Industrial Average 33 .14%(.54) -0.67 0.49

Shanghai Composite 34 .20%(.67) -1.48 0.14

Nikkei 225 30 .11%(.95) -0.38 0.70

KOSPI Composite Index 32 .24%(.75) -1.74 0.08*

IBEX 35 33 .11%(.78) -0.75 0.45

FTSE MIB 30 .13%(.83) -0.44 0.65

DAX Performance- Index 30 .08%(.77) -0.05 0.95

CAC 40 Index 33 .10%(.67) -0.32 0.74

FTSE 100 Index 32 .14%(.73) -1.04 0.29

S&P/TSX Composite index 32 .09%(.30) -0.81 0.41

BFX 20 32 .08%(.61) -.35 0.71

OMX 20 Index 30 .20%(.80) -.85 0.41

AEX Index 32 .09%( .71) -.40 0.69

OSEBX 30 .16%( .61) -.90 0.36

OMX 30 Stockholm Index 29 .19%( .85) -.80 0.43

SSMI 29 .11%( .65) -.40 0.69

S&P Global 1200 34 .16%( .38) -1.10 0.26

(8)

Number of

trading days Event Group’s Mean

and Std. Dev. t value p Value Panel C: Short-event window from 20-01-2020 to 03-02-2020

Dow Jones Industrial Average 10 -.32%(.90) 1.41 0.15

Shanghai Composite 5 -2.19%(3.38) 4.04 0.00***

Nikkei 225 11 -.41%(1.012) 1.79 0.07*

KOSPI Composite Index 9 -.66%(1.33) 2.17 0.03**

IBEX 35 11 -.26%(.92) 1.05 0.29

FTSE MIB 11 -.25%(1.51) 0.94 0.34

DAX Performance- Index 11 -.32%(1.19) 1.38 0.16

CAC 40 Index 11 -.40%(1.10) 1.67 0.09*

FTSE 100 Index 11 -.42%(1.02) 1.79 0.07*

S&P/TSX Composite index 11 -.09%(.43) .80 0.42

BFX 20 11 -.17%(1.02) .70 0.47

OMX 20 Index 11 -.01%(1.05) .20 0.84

AEX Index 11 -.34%( 1.13) 1.60 0.12

OSEBX 11 -.31%( .87) 1.25 0.22

OMX 30 Stockholm Index 11 -.21%( .90) .90 0.37

SSMI 11 -.15%( .84) .95 0.34

S&P Global 1200 11 -.27%(.66) 1.55 0.12

Panel D: Long-event window from 20-01-2020 to 03-04-2020

Dow Jones Industrial Average 53 -.54%(4.2) 1.68 .09*

Shanghai Composite 49 -.20%(1.92) .60 .54

Nikkei 225 52 -.54%(2.53) 2.56 0.01**

KOSPI Composite Index 53 -.46%(2.96) 1.65 0.09*

IBEX 35 55 -.64%(3.28) 2.34 0.02**

FTSE MIB 55 -.63%(3.67) 2.16 0.03**

DAX Performance- Index 55 -.59%(3.13) 2.41 0.01**

CAC 40 Index 55 -.65%(3.18) 2.56 0.01**

FTSE 100 Index 55 -.59%(2.91) 2.37 0.02**

S&P/TSX Composite index 54 -.48%(4.00) 1.60 0.11

BFX 20 55 -.56%(3.24) 2.10 .03**

OMX 20 Index 55 -.13%(2.09) .90 0.37

AEX Index 55 -.44%( 2.89) 1.97 .04**

OSEBX 55 -.48%( 3.73) 2.02 .04**

OMX 30 Stockholm Index 55 -.44%( 2.68) 1.98 .04**

SSMI 55 -.26%(2.56) 1.45 0.15

S&P Global 1200 55 -.50%( 3.12) 2.12 .035**

Notes: ***Significant at the 1% level, ** Significant at the 5% level and * Significant at the level of 10%

(9)

Table 3: Differences in Median Returns: Mann-Whitney Test

Number of

trading days Median Returns p Value Panel A: Comparison from 09-04-2019 to 01-12-2019

Dow Jones Industrial Average 164 .07%

Shanghai Composite Index 159 -.03%

Nikkei 225 156 .11%

KOSPI Composite Index 161 .04%

IBEX 35 166 .00%

FTSE MIB 165 .06%

DAX Performance- Index 164 .17%

CAC 40 Index 166 .16%

FTSE 100 Index 164 .00%

S&P/TSX Composite Index 163 .03%

BFX 20 166 .06%

OMX 20 Index 161 .07%

AEX Index 166 .09%

OSEBX 162 .04%

OMX 30 Stockholm Index 163 .14%

SSMI 163 .10%

S&P Global 1200 169 .06%

Panel B: Pre-event Window from 02-12-2019 to 19-01-2020

Dow Jones Industrial Average 33 .17% 0. .50

Shanghai Composite 34 .09% .08*

Nikkei 225 30 .03% 0.99

KOSPI Composite Index 32 .24% 0.14

IBEX 35 33 -.00% 0.80

FTSE MIB 30 .14% 0.57

DAX Performance- Index 30 .00% 0.98

CAC 40 Index 33 .08% 0.96

FTSE 100 Index 32 .11% 0.40

S&P/TSX Composite index 32 .08% 0.57

BFX 20 32 .08% 0.86

OMX 20 Index 30 .25% 0.48

AEX Index 32 .04% 0.83

OSEBX 30 .12% 0.40

OMX 30 Stockholm Index 29 .13% 0.58

SSMI 29 .14% 0.74

S&P Global 1200 34 .14% 0.27

(10)

Number of

trading days Median Returns p Value Panel C: Short-event window from 20-01-2020 to 03-02-2020

Dow Jones Industrial Average 10 -.06% 0.23

Shanghai Composite 5 -1.41% 0.15

Nikkei 225 11 -.55% 0.16

KOSPI Composite Index 9 -.93% 0.14

IBEX 35 11 -.39% 0.29

FTSE MIB 11 -.57% 0.38

DAX Performance- Index 11 .05% 0.30

CAC 40 Index 11 -.53% 0.15

FTSE 100 Index 11 -.51% 0.14

S&P/TSX Composite index 11 .06% 0.43

BFX 20 11 .14% 0.58

OMX 20 Index 11 .22% 0.83

AEX Index 11 -.22% 0.25

OSEBX 11 -.04% 0.31

OMX 30 Stockholm Index 11 -.21% 0.35

SSMI 11 .09% 0.60

S&P Global 1200 11 -.22% 0.13

Panel D: Long-event window from 20-01-2020 to 03-04-2020

Dow Jones Industrial Average 53 -.44% 0.04**

Shanghai Composite 49 .11% 0.89

Nikkei 225 52 -.59% 0.00***

KOSPI Composite Index 53 -.24% 0.13

IBEX 35 55 -.08% 0.47

FTSE MIB 55 .12% 0.57

DAX Performance- Index 55 -.12% 0.25

CAC 40 Index 55 -.23% 0.17

FTSE 100 Index 55 -.27% 0.28

S&P/TSX Composite index 54 .06% 0.38

BFX 20 55 0% 0.48

OMX 20 Index 55 .10% 0.99

AEX Index 55 -.05% 0.34

OSEBX 55 -.07% 0.45

OMX 30 Stockholm Index 55 -.07% 0.25

SSMI 55 .04% 0.70

S&P Global 1200 55 -.23% 0.04**

Notes: ***Significant at the 1% level, ** Significant at the 5% level and * Significant at the level of 10%

(11)

the effect of COIVD-19 Pandemic on weekly and daily stock price indices based on efficient market theory and intertemporal asset price theory. The research found evidence that COVID-19 negatively affected the main stock indices of representative countries in this study. Pooled OLS result shows that the growth rate in weekly new cases significantly reduced weekly return in the next week. For further analysis, to investigate the impact of press reports and specifically human to human transmissibility as a major event, we divided the one-year period into four windows of normal, pre-event, short event and long event window. We found that at the early stage of the pandemic, the stock markets do not react to the news reports, even, the stock markets were performing well during the pre-event window when compared to the normal period. However, the announcement of the human- human transmissibility significantly negatively impacted the stock returns.

Interestingly, we found that the Shanghai Composite Index which was severely affected after the announcement of human-human transmissibility in the short-event window showed recovery in the long event window. The results can be attributed to the effective measures taken by the Chinese government to contain the spread of the virus, which helped to regain the investors’ confidence in the stock market.

Finally, the S&P Global 1200 Index showed similar patterns as the national stock indices which indicates that the effect of the pandemic is not limited to the only economies included in our study. The purpose of the present study has been to examine the immediate impact of COIVD-19 pandemic on the affected nations’ stock markets. This study contributes to literature in that it examines the sudden impact of a dreaded disease on stock markets.

References

Ali, N., Nassir, A. M., Hassan, T., & Abidin, S. Z. (2010). Short run stock overreaction: Evidence from Bursa Malaysia.

International Journal of Economics and Management, 4(2), 319-333. http://www.ijem.upm.edu.my/vol4no2/bab07.pdf Baldwin, R., & Mauro, B. W. (2020). Economics in the Time of

COVID-19. In Economics in the Time of COVID-19. London, UK: CEPR Press. https://voxeu.org/content/economics-time- covid-19

Boon, L., Haugh, D., Pain, N., & Salins, V. (2020). Tackling the fallout from COVID-19. In Economics in the Time of COVID-19. London, UK: CEPR Press. https://voxeu.org/

content/economics-time-covid-19

Chen, C.-D., Chen, C.-C., Tang, W.-W., & Huang, B.-Y.

(2009). The Positive and Negative Impacts of the Sars Outbreak: A Case of the Taiwan Industries. The Journal of Developing Areas, 43(1), 281-293. https://www.jstor.org/

stable/40376284?seq=1#metadata_info_tab_contents

Chen, M. H., Jang, S. C., & Kim, W. G. (2007). The impact of the SARS outbreak on Taiwanese hotel stock performance:

An event-study approach. International Journal of Hospitality Management, 26(1), 200-212. https://doi.org/10.1016/j.

ijhm.2005.11.004

Chen, M. P., Chen, P. F., & Lee, C. C. (2013). Asymmetric effects of investor sentiment on industry stock returns: Panel data evidence. Emerging Markets Review, 14(1), 35-54. https://doi.

org/10.1016/j.ememar.2012.11.001

Chen, M. P., Lee, C. C., Lin, Y. H., & Chen, W. Y. (2018). Did the S.A.R.S. epidemic weaken the integration of Asian stock markets? Evidence from smooth time-varying cointegration analysis. Economic Research-Ekonomska Istrazivanja, 31(1), 908-926. https://doi.org/10.1080/1331677X.2018.1456354 Chen, N.-F., Roll, R., & Ross, S. A. (1986). Economic Forces and

the Stock Market. The Journal of Business, 59(3), 383-403.

https://doi.org/10.1086/296344

Chou, J., Kuo, N.-F., & Peng, S.-L. (2004). Potential Impacts of the SARS Outbreak on Taiwan’s Economy. Asian Economic Papers, 3(1), 84-99. https://doi.org/10.1162/1535351041747969 Cohen, J. (2020). Wuhan seafood market may not be source of novel

virus spreading globally. Science, 10. https://doi.org/10.1126/

science.abb0611

Ma, J. (2020). Coronavirus: China’s first confirmed Covid-19 case traced back to November 17. South China Morning Post. Retrieved April 29, 2020, from https://www.scmp.com/

news/china/society/article/3074991/coronavirus-chinas-first- confirmed-covid-19-case-traced-back

Fan, Y., Zhao, K., Shi, Z. L., & Zhou, P. (2019). Bat coronaviruses in China. In Viruses, 11(3), 210. https://doi.org/10.3390/

v11030210

Fiscal Monitor (2020, April). Chapter 1: Policies to Support People During the COVID-19 Pandemic. Retrieved April 29, 2020, from https://www.imf.org/en/Publications/FM/Issues/2020/04/17/

Fiscal-Monitor-April-2020-Chapter-1-Policies-to-Support- People-During-the-COVID-19-Pandemic-49278

Global Financial Stability Report. (2020). Global Financial Stability Report. Retrieved April 29, 2020, from https://www.imf.org/

en/Publications/GFSR/Issues/2020/04/14/global-financial- stability-report-april-2020

Huang, C., Wang, Y., Li, X., Ren, L., Zhao, J., Hu, Y., Zhang, L., Fan, G., Xu, J., Gu, X., Cheng, Z., Yu, T., Xia, J., Wei, Y., Wu, W., Xie, X., Yin, W., Li, H., Liu, M., … Cao, B. (2020). Clinical features of patients infected with 2019 novel coronavirus in Wuhan, China. The Lancet, 395(10223), 497-506. https://doi.

org/10.1016/S0140-6736(20)30183-5

Investing.com. (2020). Stock Market Quotes & Financial News.

Retrieved April 29, 2020, from https://www.investing.com/

Keogh-Brown, M. R., & Smith, R. D. (2008). The economic impact of SARS: How does the reality match the predictions?

Health Policy, 88(1), 110-120. https://doi.org/10.1016/j.

healthpol.2008.03.003

(12)

Li, Q., Guan, X., Wu, P., Wang, X., Zhou, L., Tong, Y., Ren, R., Leung, K. S. M., Lau, E. H. Y., Wong, J. Y., Xing, X., Xiang, N., Wu, Y., Li, C., Chen, Q., Li, D., Liu, T., Zhao, J., Liu, M., … Feng, Z. (2020). Early transmission dynamics in Wuhan, China, of novel coronavirus-infected pneumonia. In New England Journal of Medicine. https://doi.org/10.1056/NEJMoa2001316 McKibbin, W. J., & Fernando, R. (2020). The Global Macroeconomic Impacts of COVID-19: Seven Scenarios. SSRN Electronic Journal. https://doi.org/10.2139/ssrn.3547729

Merton, R. C. (1973). An Intertemporal Capital Asset Pricing Model. Econometrica. https://doi.org/10.2307/1913811 Gale, J. (2020). Mysterious China Pneumonia Outbreak Monitored

by UN Agency - Bloomberg. Retrieved April 29, 2020, from https://www.bloomberg.com/news/articles/2020-01-04/china- pneumonia-outbreak-spurs-who-action-as-mystery-lingers Nippani, S., & Washer, K. M. (2004). SARS: A non-event for affected

countries’ stock markets? Applied Financial Economics, 14(15), 1105-1110. https://doi.org/10.1080/0960310042000310579 OECD. (2020). Coronavirus: The world economy at risk. OECD

Interim Economic Assessment.

Ramelli, S., & Wagner, A. F. (2020). Feverish Stock Price Reactions to the Novel Coronavirus. SSRN Electronic Journal. https://doi.

org/10.2139/ssrn.3550274

S&P Dow Jones Indices. (2020). S&P Dow Jones Indices. Retrieved April 29, 2020, from https://us.spindices.com/

Siu, A., & Wong, Y. C. R. (2004). Economic Impact of SARS: The Case of Hong Kong. Asian Economic Papers, 3(1), 62-83.

https://doi.org/10.1162/1535351041747996

WEF. (2020). The Global Risks Report 2020 15th Edition. World Economic Forum.

WHO. (2020a). Novel Coronavirus (2019-nCoV) Situation Report 21 January 2020. https://www.who.int/docs/default-source/

coronaviruse/situation-reports/20200121-sitrep-1-2019-ncov.

pdf?sfvrsn=20a99c10_4

WHO. (2020b). Pneumonia of unknown cause – China. Retrieved April 29, 2020, from https://www.who.int/csr/don/05-january- 2020-pneumonia-of-unkown-cause-china/en/

WHO. (2020c). Director-General’s opening remarks at the media briefing on COVID-19 - 11 March 2020. Retrieved April 29, 2020, from https://www.who.int/dg/speeches/detail/who-director- general-s-opening-remarks-at-the-media-briefing-on-covid-19--- 11-march-2020

Wong, G. (2008). Has SARS infected the property market? Evidence from Hong Kong. Journal of Urban Economics, 63(1), 74-95.

https://doi.org/10.1016/j.jue.2006.12.007

World Economic Outlook. (2020, April). World Economic Outlook 2020 : The Great Lockdown. Retrieved April 29, 2020, from https://www.imf.org/en/Publications/WEO/

Issues/2020/04/14/World-Economic-Outlook-April-2020-The- Great-Lockdown-49306

World Health Organization. (2020). World Health Organization (WHO) on Twitter: “Preliminary investigations conducted by the Chinese authorities have found no clear evidence of human- to-human transmission of the novel #coronavirus (2019-nCoV) identified in #Wuhan, #China. https://t.co/Fnl5P877VG” / Twitter. Retrieved April 29, 2020, from https://twitter.com/

who/status/1217043229427761152?lang=en

Wren-Lewis, S. (2020). The economic effects of a pandemic. In Economics in the Time of COVID-19. London, UK:CEPR Press. https://voxeu.org/content/economics-time-covid-19 Wuhan Municipal Health Commission. (2019). Wuhan Municipal

Health Commission on the current situation of pneumonia in our city. Retrieved April 29, 2020, from https://www.yicai.com/

news/100452245.html

Yahoo Finance. (2020). Stock Market Live, Quotes, Business &

Finance News. Retrieved April 29, 2020, from https://finance.

yahoo.com/

Today’s Headlines. (2020). Special topic on combating pneumonia.

Retrieved April 29, 2020, from https://i.snssdk.com/ugc/

hotboard_fe/hot_list/template/hot_list/forum_tab.html

수치

Table 1: Linear Regression
Table 2: Differences in Mean Returns
Table 3: Differences in Median Returns: Mann-Whitney Test

참조

관련 문서

Given the detrimental effect of the pandemic on Malaysia’s stock market much like in other sectors and the continued period of economic contraction, this paper

The study reveals that current events affect the stock market of Bangladesh, and the DSE Broad index (DSEX) has an enormous ARCH effect, followed by the Sharia index (DSES)