Print ISSN: 2288-4637 / Online ISSN 2288-4645 doi:10.13106/jafeb.2020.vol7.no4.71
Effects of Corporate Governance and Earning Quality on Listed Vietnamese Firm Value
Hung Ngoc DANG*, Cuong Duc PHAM**, Thang Xuan NGUYEN***, Hoa Thi Thanh NGUYEN****
Received: February 7, 2020 Revised: March 1, 2020 Accepted: March 6, 2020.
Abstract
The paper examines the influence of corporate governance (CG) and earning quality (EQ) on corporate value (FV) of Vietnamese enterprises. The study uses GLS regression and linear structure model using data collected from companies listing on the stock market in Vietnam during 2008- 2018, with a total of 2,937 observations. The research results indicate that EQ and CG represented by the Integrated Board of Directors and the Integrated Supervisory Board have a positive effect on FV directly and indirectly. The results show that the Integrated Board of Directors has a positive effect on EQ, whereas the Integrated Supervisory Board has a negative effect on EQ. Based on the research results, we suggest that companies need to strictly comply and implement GC, so to bring down the agency cost and consequently to increase performance. The companies also should establish the Board of Director of a proper size, with financial and accounting specialty, and including women board members. The government also needs to improve the management mechanism asking for firms to prepare and publish financial statements with reliable company information, which could be provided to users. These recommendations are a useful basis to help businesses improve FV via changes in the corporate governance factors in each enterprise.
Keywords: Corporate Governance, Earning Quality, Firm Value, Vietnam
JEL Classification Code: M41, G32, G30
1. Introduction
1314Corporate value is a topic that attracts great attention from administrators and researchers. The studies about the effect of EQ on corporate value show similarities and differences when using metrics. According to Sucuahi and Cambarihan (2016) the assessment of EQ based on the stability of future revenue demonstrates the enterprise's EQ.
*First Author. Associate Professor, Dean, Accounting Faculty, Hanoi University of Industry, Vietnam.
Email: [email protected]
**Corresponding Author. Associate Professor, School of Accounting and Auditing, The National Economics University (NEU), Vietnam [Postal Address: 207 Giai Phong, Hai Ba Trung, Hanoi, 113068, Vietnam] Email: [email protected]
***Head, Training Department, Postgraduation School, The National Economics University, Vietnam
****Lecturer, Accounting Department, Economics Faculty, Vinh University, Vietnam
ⓒ Copyright: The Author(s)
This is an Open Access article distributed under the terms of the Creative Commons Attribution Non-Commercial License (http://Creativecommons.org/licenses/by-nc/4.0/) which permits unrestricted noncommercial use, distribution, and reproduction in any medium, provided the original work is properly cited.
Zhang (2002) defines EQ as an enterprise's ability to forecast future earnings. Investors or stakeholders in the capital market often rely on information from the financial statements to assess the future cash flow of the business from which to estimate the expected returns (Francis, LaFond, Olsson, & Schipper, 2004; Vo & Bui, 2017). Thus, in order to better predict the future cash flow, the profit announced on the financial statements should show a good profit.
Since the global economic crisis and the collapse of a
series of large corporations in the world such as Lehman
Brothers, Merrill Lynch, Enron, and the CIT Group. CG
issues have been frequently mentioned and become a
research focus of businesses around the world. This raises
doubts about the management system and the effective
disclosure of listed enterprises whether they are transparent,
honest and reasonable. Therefore, the relationship between
CG and FV has been an issue of great interest to many
researchers, especially in developed countries. Black, Jang,
and Kim (2006), when studying the impact of CG on the
value of companies, found that CG has a significant
positive effect on FV. This was also found in Brown and
Caylor (2004) when analyzing 2,327 businesses in the US, based on 51 CG factors provided by ISS (Institutional Shareholder Services). Research by Mashayekhi and Bazaz (2008) shows that the size of the Board of Directors, negatively correlated with FV, but when companies hire outside directors FV increases. The relationship between management structure and FV does not seem to be clear in this study. When the ownership of a business focuses largely on an individual or organization, it will reduce the agency's cost and increase FV. But when the CEO concurrently holds the position of chairman of the company, the impact on FV is negative. This conclusion is found in various studies, such as (Ehikioya, 2009). In developing countries, the relationship between CG and FV is also being studied and discussed widely by various authors like Arora and Sharma (2016), Dang, Vu, Ngo, and Hoang (2019), Vo and Bui (2017), Nguyen (2018), and Cha, Hwang, and Kim (2019).
Currently, CG and EQ studies have been conducted by many authors across the world, but mainly in two directions:
(1) Studying the individual characteristics of CG affecting EQ, and (2) Studying synthetic factors representing CG which impacts on EQ. Individual case studies are very popular, such as those by Klein (2002); Rahman, Meah, and Chaudhory (2019). One point to underline is that the results disagree when considering the impact of individual characteristics of the Board of Directors and the Supervisory Board on EQ. For example, the feature of Independent member in the Board of Directors in the research by Hassan and Ahmed (2012) increase EQ, while this characteristic has no effect on EQ in studies by Gulzar (2011), Soliman and Ragab (2014), and Vijayakumaran and Vijayakumaran (2019). The size of the Board of Directors has a positive relationship to EQ evidenced by Al-Othman and Al-Zoubi (2019), whereas research by Hashim and Devi (2008) show the size of the Board of Directors to negatively affect EQ. Therefore, in order to minimize the inconsistencies in the study, some authors did not look at individual characteristics to consider the impact of CG on EQ, but use a synthetic factor including some characteristics of CGs that impact on EQ, as do Kang and Liu (2014).
Thus, CG-to-FV or EQ-to-FV studes have been conducted by many researchers, but the focus on the relationship between GV, EQ to FV, where EQ is an intermediate variable, has not been comprehensive reviewed. Therefore, this study aims to examining the relationship between CG, EQ and FV to consolidate and supplement the results of previous studies. We, consider the Board of Directors and the Supervisory Board in terms of the combination of the individual characteristics that affect the EQ and FV in Vietnam, a developing economy, whic makes a lot of sense.
2. Literature Review
The relationship between CG and FV is a topic that many researchers are interested in. Some studies use a comprehensive set of CG indicators to measure the correlation between CG and FV. Core, Guay, and Rusticus (2006) have developed a management index (G-index) to study this issue. However, most studies analyze the correlation between firm value and a subset of corporate governance variables such as board composition, board size, and CEO duality (Vo & Bui, 2017). Determining the appropriate and optimal Board size in a company is a matter discussed in many previous studies.
To find the effect of corporate governance on the quality of profits, Qinghua, Pingxin, and Junming (2007) studied the relationship between audit committee, Board characteristics and EQ, as well as empirical research on the Chinese stock market. The authors measured the listed companies' EQ through the level of earning management (EM) using the adjusted Jones model. The factors affecting EQ were divided into three groups: (1) Characteristics of the Board of Directors; (2) Professional characteristics of the BOD and (3) Behavioral characteristics of the BOD. In addition, the study also analyzes the impact of other factors (control variables) on EQ such as firm size, financial leverage, etc. (Qinghua et al., 2007). Radzi, Islam, and Ibrahim (2011) have looked at this issue in Malaysia, Alves (2014) in Portugal, Waweru and Riro (2013) in Arab countries and Kenya, and Ahmed (2014) in Bursa Malaysia stock market, among others..
In addition to the individualized CG studies affecting EQ in each respect, there are also several studies using synthetic CGs such as that by Carcello, Hollingsworth, Klein, and Neal (2006). This study seeks to examine the impact of financial expertise of the IC, the effective CG and EM of 283 domestic non-financial companies listed in the US. The regression results found a positive and significant correlation between the finance and accounting expertise of the Supervisory Board with anomalous accumulation; the effective CG is negative and significant at 5%, showing that CG has a very important role in EM restriction, thereby improving EQ.
To study the effect of earning quality on firms‟ value, Gaio and Raposo (2011) conducted a study using a sample of more than 7,000 observations collected from 38 countries to consider the relationship between EQ and business value (Tobin‟s Q). The results show a positive and meaningful relationship between EQ and business value, in which the aggregate income quality measure is based on seven income attributes (cumulative quality, sustainability, predictability, stability, relevance, timeliness and prudence).
In that context, studies by Hutagaol, Valentincic, and
Warganegara (2019) show that EQ is inversely significant
to the market value of equity of companies listed on the Jakarta Stock Exchange. Latif, Bhatti, and Raheman, (2017) conducted a study of 214 non-financial listed companies in Pakistan between 2003-2014 that found that EQ affect is positive in maximizing the value of the company.
Finally, to study the relationship between Corporate Governance and the Earning Quality affects Firm Value, as mentioned above, much research examined the effects of GV or EV on FV, but there is little attention paid to the relationship between GV and EQ affecting FV. Recently, Latif et al. (2017) conducted a study on the relationship between GV and FV through an intermediate variable, EQ, which used a panel data of 214 non-financial listed companies in Pakistan between 2003-2014. The results show that CG improves EQ and FV. Moreover, EQ affects positively FV.
3. Theoretical Framework 3.1. Agency Theory
The agency theory (Jensen & Meckling, 1976) also called the theory of authorization, focuses on the relationship between the owner (called the principal) and the authorized party (called the agent). The agency inevitably creates a conflict between the principal party and the agent, between shareholders and creditors. To resolve these contradictions, the manager will impact on the accounting data and on the economic transactions to harmonize the interests of the parties. Specifically, the agency theory is used to explain the concurrent CEO position of the Chairman, the size of the Board, the independence of the Board of Directors, number of Board of Director meetings, number of Supervisory Board members, type of auditing company, state-owned percentage, and ownership of management affecting to earning quality.
3.2. Stakeholder Theory
Stakeholder theory is a view of management strategy and ethics, first introduced by Freeman (1984). The central idea of this theory is that the success of an organization depends on the relationship between the manager and stakeholders such as investors, creditors, workers, customers, suppliers, state and other entities involved in achieving the enterprise's goals. There are quite a few studies that apply stakeholder theory to justify research results. The stakeholder theory proposes that one company whose Board of Directors is large and diverse will be appropriate and has many advantages for linking the components. In addition to agency theory, the stakeholder
theory is also combined to explain how the factors of the Board of Directors affect the earning quality.
3.3. Signal Theory
Signal theory was introduced by Spence (1973). When studying the labor market, he said that hiring workers is an uncertain decision because they do not know the true competence of workers. Ross (1977) argues that the inherent contradictions of shareholders and managers cause the manager to focus on providing central signals, meeting the basic information needs of users. In the financial market, the principal relationship between the shareholder and the manager is expressed by return on investments, the investor makes economic decisions based on profitability indicators.
3.4. Resource Dependence Theory
Pfeffer and Salancik (1978) introduced the theory of resource dependence, which is a fundamental theory of the resource roles of the Board of Directors. They posit that the activities of organizations will depend on each other and the resources will contribute to strengthening the organizational and operational functions of the company. It is necessary for the Board of Directors to manage the interdependence between organizations and ensure the resources and information they need. Hillman and Dalziel (2003) suggested that an ideal BOD should consist of many individuals with external links, such as business professionals, support professionals and communities that affect access to the resources needed for the company. The theorists of resource dependence argue that a diverse and representative board of independent external members can improve the performance of businesses, especially when there is a major change in the operating environment (Nicholson & Kiel, 2007), (Hillman & Dalziel, 2003).
Enterprises with larger or more diversified BODs will have an advantage to enjoy and maintain important resources such as human capital, social capital, and legal knowledge (Peasnell, Pope, & Young, 2005).
3.5. Capital Market Efficiency of Quality Profit
Profits are of great interest to financial market
participants, especially investors and analysts. Recent
studies provide evidence that reported profits are the
company's top information (Francis et al., 2004), as they are
a good indicator of future cash flows, and there is more
information about a company's economic performance than
cash flow (Dechow, 1994). Francis et al. (2004) examined
the relationship between several attributes of profit and cost
of equity in the United States and found that the properties
of profit based on accounting (cumulative quality,
sustainability, predictability and stability) are more cost- effective than market-based attributes (relevance of value, timeliness and prudence) and cumulative quality are attributes with the highest vaae. Bhattacharya, Daouk, and Welker (2003) found that the increase in profits is defined as an aggregate measure of the positive level of income, avoiding losses and the stability of profits. This is related to an increase in the cost of equity and a decrease in transaction volume. In the US market, there have been some studies such as Bitner and Dolan (1996), Rountree, Weston, and Allayannis (2008) that focused on the relationship with EQ with corporate valuation (measured by Tobin'Q), meanwhile, Bitner and Dolan (1996) examined the relationship between profit stability and FV.
4. Research Methodology 4.1. Research Model
Based on the review of previous scholars, we use the following two models to clarify the impact of CG, EQ on FV, of companies as discussed in the literature review, as follows (see Figure 1):
Figure 1: Effects of CG, EQ on FV
Model 1:
TOBINQ i,t = β 0 + β 1 EQ i,t + β 2 BD i,t + β 3 AC i,t + ɛ i,t (1) Model 2:
In order to measure EQ, we rely on the quality of accruals according to Dechow and Dichev (2002) using current working capital accruals which are regressed with the operating cash flow of three-year values divided by beginning total assets of the period.
𝑊𝐶𝐴 𝑖𝑡
𝐴 𝑖𝑡;1 = 𝛼 1 𝐶𝐹𝑂 𝑖𝑡;1
𝐴 𝑖𝑡;1 + 𝛼 2 𝐶𝐹𝑂 𝑖𝑡
𝐴 𝑖𝑡;1 + 𝛼 3 𝐶𝐹𝑂 𝑖𝑡:1
𝐴 𝑖𝑡;1 (2)
In which, WCAit is the accumulated working capital of firm i in year t, calculated by the change in short-term assets (∆CA) minus the change of cash and cash equivalents, minus the changes in short-term debt and plus changes in short-term bank loans.
𝐶𝐹𝑂 𝑖𝑡;1 𝐶𝐹𝑂 𝑖𝑡 , , 𝐶𝐹𝑂 𝑖𝑡:1 respectively, is operating cash flow in year t-1, year t and year t+1. All variables are divided by beginning total assets of the period.
To measure the EQ, a representative variable is created from the remainder of equation (2) after performing the regression. The absolute value of the remainder for each observation is the opposite of the quality of the accruals. So, higher residual values represent a lower quality of accruals.
To ease the interpretation for this variable, the quality of residual accruals is determined by the negative value of the absolute value of the remainder. The variables in the model (1), are shown in Table 1, as follows.
Table 1: Description of variables used in the research model
Variable Name Description Measurement Expectation
TOBINQ Firm value Value of firm i at time t TOBINQ = (Market capitalization + Liabilities)/Total assets
EQ Earning quality Earning Quality of firm i at time t
The absolute residual value of the model estimates the quality of the accruals multiple with (-1).
CACC
it= α + β
1CFO
it-1+ β
2CFO
it+ β
3CFO
it+1+ ε
it+
BD This is a representative indicator for the BOD
BD = BSIZE+BIND +BEXP +BMEET +CEODUAL +
BSIZE Size of Board of Directors
Size of Board of Directors of firm i at time t
As a binary variable, get a value of 1 if the scale is larger than the median.
BIND Independence of the Board of Directors
The percentage (%) of independent members in the
Board of Directors
A binary variable that receives a value of 1 if the percentage (%) of independent members is greater than the median member of the Board of Directors otherwise
it receives a value of 0.
Variable Name Description Measurement Expectation
BMEET
Frequency of meetings of the
Board
Number of meetings during the year of the BOD
A binary variable whose value is 1 if the number of BOD meetings in the company is greater than the
sample median
CEODU
AL Part-time Chairman of the Board
Chairman of the company and chief executive officer of the same
person at company i in year t.
A binary variable that takes a value of 1 if there is no concurrency
BFEMALE The rate of women in the Board of
Directors
Ratio of women in the Board of Directors i in year t.
A binary variable receiving a value of 1 if the percentage of women in the BOD is greater than the
sample median AC This is a representative indicator for the summary of the Supervisory Board:
AC =ACSIZE +ACIND+ ACEXP +ACMEET +
ACSIZE Supervisory Board Number of members in the Supervisory Board of the
company i in year t
A binary variable whose value is 1 if there are at least 3 or 4 members in the Supervisory Board
ACEXP Financial expertise of Board of Supervisors
Supervisory Board member has financial expertise. Typically,
members of the Supervisory Board have degrees in accounting
and finance, and experience in financial accounting.
Binary variable gets value of 1 if the Supervisory Board has 1 member with expertise in finance and accounting.
ACMEET
Frequency of meeting of Board of Supervisors
Number of meetings of the Supervisory Board in the year of
the company i in year t.
Binary variable receives value of 1 if the number of meetings in the year of the Supervisory Board members
is greater than the sample median value, otherwise the value is 0.
Sources: The authors synthesize and build from the literature review
4.2. Data
Researching the influence of corporate governance on the EQ of businesses listed on the Vietnam stock market in the period of 2010-2018 with 2,162 observations. The data of these companies is collected from their financial statements and the data set from Vietstock, as well as aggregated from the data published on some reputable securities websites such as cafef.vn or cophieu68.com. The original data will be aggregated and recalculated in the correct way of identifying variables, in which some variables will be regressed to get the remainder and initialize the corresponding new variable through Stata 14.0.
4.3. Data Processing Methods
The study uses the Fixed Effect and Random Effect regression methods to estimate the impact of corporate governance on the EQ of listed companies in Vietnam. The research paper will use F-Test and Hausman tests to examine which models of Fixed Effect and Random Effect give better estimates. We, then, conduct the GLS test to examine the defects of the selected model and find approaches to overcome this issue. At the same time, we use linear structure model (SEM) with EQ as the intermediate variable.
5. Research Results and Discussions
Table 2 shows that the average number of members of the Board of Directors is 5.56, the highest is 13 members and the lowest is three ones. The average rate of independent non-executive members is 68.0%, the lowest is 20% and the highest is 100%. The average number of meetings held by the Board of Directors was 9,925 sessions, of which the lowest rate was one session and the highest was 78. On average, 24.8% of businesses have a Chairman of the Board concurrently holding the General Directorship.
The average proportion of female members on the BOD is 15.3%.
Table 3 shows that the TOBINQ index has an average of 1,133, the highest is 12,962 and the lowest is 0.121, the standard deviation is 0.843. The variable EQ has an average value of -0.068, with a standard deviation of 0.093.
Meanwhile, the aggregate variable of Board of Directors
(BD) is measured by the sum of separate factors
representing the Board's characteristics (described in Table
1). The BD index has the largest value of 5, the smallest
value is 1. The average value of the variable is 2,514 with
the standard deviation of 1,156. Thus, the synthesis factor
of BOD (Acronym as BD) in enterprises is very different,
there are companies with all the required characteristics to
express the Board effectively, while some companies are
effective. The variable of the Supervisory Board (AC) is a synthesis variable that represents all the individual factors showing the effectiveness of the Supervisory Board (as described in table 1). The AC variable has the highest value of 4 and the smallest value is 0, the average value of the observed sample is 1,651 with the standard deviation AC level is 0.875.
Table 2: Statistical description of the characteristics of the Board of Directors and Supervisory Board
Variable Obs. Mean Std.
Dev. Min Max
BOARDSIZE 2937 5.560 1.344 3 13
BOARDIND 2937 0.680 0.175 0.2 1
BOARDMEET 2937 9.925 9.435 1 78
BOARDDUAL 2937 0.248 0.432 0 1
BOARDGENR 2937 0.153 0.176 0 1
AUDITCSIZE 2937 2.969 0.475 1 6
AUDITCEXP 2937 0.176 0.252 0 1
AUDITCMEET 2937 3.647 4.236 1 65
AUDITCGENR 2937 0.489 0.329 0 1
Table 3: Statistical description for variables Variable Obs Mean Std.
Dev. Min Max
TOBINQ 2937 1.133 0.843 0.121 12.962
EQ 2937 -0.068 0.093 -0.913604 0
BD 2937 2.514 1.156 0 5
AC 2937 1.651 0.875 0 4
Table 4 presents the autocorrelation matrix, showing the direction of impact among the research variables. The correlation coefficient between the independent variables in the model does not have any pair greater than 0.8, so it is less likely to have multicollinearity, via VIF indicator.
Table 4: Autocorrelation matrix
TOBINQ EQ BD AC
TOBINQ 1
EQ 0.0552 1
BD 0.0786 0.0296 1
AC 0.0428 -0.0582 0.1347 1
Based on Table 5, EQ shows a positive relationship and statistical significant at 1% with firm value. Thus, a higher EQ will contribute to increase the firm value. This result is similar to Gaio and Raposo (2011) and Latif et al. (2017).
Looking at the regression results in Table 5, we can see that the integrated Board of Directors (BD) has a positive relationship with FV at a significance level of 1%, and this
research result is consistent with Lipton and Lorsch (1992), and Yermack (1996) and in contrast to the research by Dang, Pham & Vu (2018). While the variable integrated Supervisory Board (AC) is positively related to FV, however, it is only significant at the 5% level.
Table 5: Results from regression
VIF FEM model REM model GLS mode l
EQ 1.01 0.432*** 0.432*** 0.502***
BD 1.03 0.00305 0.00305 0.0526***
AC 1.02 -0.0167 -0.0167 0.0350**
_cons 1.183*** 1.183*** 0.978***
N 1.13 2937 2937 2937
R-sq 1.18 0.018 0.018
F test
F(3,2667) = 16.13 Prob > F =
0.0000
LM test
Wald chi2(3)
=48.79 Wald chi2 (3 = 30.45) Prob > chi2
= 0.0000
Prob > chi 2 = 0.00
00 Hausman
test
chi2(3) = 2.37 Prob>chi2 = 0.4994 Breusch an
d Pagan La grangian
chibar2(01) = 12493.43 Prob > chibar2 = 0.0000
Wooldridge test
F( 1, 266) = 60.318 Prob > F = 0.0327 t statistics in brackets * p<0.1, ** p<0.05,
*** p<0.01
Table 6: Results from SEM regression
Hypothesis Structural Coef. Std. Err. z P-value H
1TOBINQ <-
EQ 0.502 0.167 3 0.003
H
2TOBINQ <-
BD 0.053 0.014 3.89 0.000
H
3TOBINQ <-
AC 0.035 0.018 1.96 0.045
_cons 0.978 0.046 21.28 0.000
H
4EQ <-BD 0.003 0.001 2.05 0.04
H
5EQ <-AC -0.007 0.002 -3.41 0.001
_cons -0.065 0.005 -13.1
9 0.000
t statistics in brackets * p<0.1, ** p<0.05, *** p<0.01
Table 6 and Figure 2 show the regression results based on
the SEM structure model. The research results show that the
factors of CG including the Board of Directors (BD) and the summary of the Supervisory Board (AC) directly affect and indirectly (via variable EQ) to FV. This result agrees with Latif et al. (2017).
Figure 2: Estimated results according to SEM model The results in Table 7 show that the variable BD has a positive correlation with EQ. This supports the authors' expectations, with a coefficient of 0.502 and statistical significance at 1%. This is a new variable included in the model to test reliability as well as to examine the impact of BD on the EQ. With the results just mentioned from the multivariate regression, the synthetic board of directors (BD) has a positive correlation with the EQ with statistical significance, which means that the better the BOD, the higher the EQ of the business. This result is consistent with the agency theory that the effectiveness of the Board reduces conflicts between owners and managers and is consistent with Carcello et al. (2006).
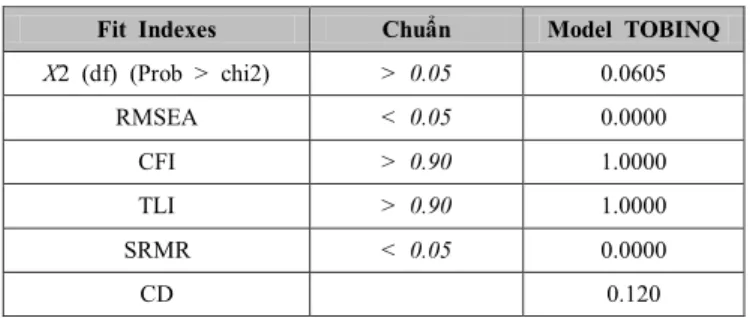
Table 7: Test results of model
Fit Indexes Chuẩn Model TOBINQ X2 (df) (Prob > chi2) > 0.05 0.0605
RMSEA < 0.05 0.0000
CFI > 0.90 1.0000
TLI > 0.90 1.0000
SRMR < 0.05 0.0000
CD 0.120
Therefore, the Board of Directors must be diversified and reach a value high enough to create an effective monitoring mechanism, potentially affecting the management activities.
According to good CG practices, the Board of Directors has all five characteristics that play a great role in supervising behavior of managers and resolving conflicts of interest based on agency theory. This result is entirely consistent with the theory of behavior when admitting the BOD is the
best monitoring mechanism. At the same time, this result supports the theory of resource dependence that the Board of Directors, as soon as it satisfies the requirements of resources (independent members, number of members, percentage of women in the Board, concurrence, and number of meetings), will increase the effectiveness of monitoring and as a result will improve the EQ. The results of this research are similar to the assessment of the diversity of the structure and functions of the Board of Directors to increase the EQ by Hoang, Abeysekera, and Ma (2018) or in accordance with the research results of Carcello et al. (2006) when arguing that strong CG increases EQ.
With the results from SEM regression the AC variable has the opposite effect on the change of EQ, and this is not in accordance with our initial expectations. At the same time, the results of this research do not support the agency theory and the theory of resource dependence when it is assumed that in joint-stock companies, the conflict of interest between the manager and the owner is controlled and managed by activities of the Supervisory Board.
Vietnam financial market is still young, companies have been privatized in a short time. Although, Circular 121/2012/TT-BTC and the Company Law 68/2014/QH13 have been issued requirements detailing the establishment of the Supervisory Board as well as the relevant requirements, however, the information of listed companies, the members of the Supervisory Board, professional qualifications, independent members and the number of meetings is very limited and still form over substance.
6. Conclusion and Recommendations
This research uses a sample of 2,973 observations from companies listed on Vietnam's stock market in the period of 2008-2018 to examine the effects of general CG, EQ to FV.
The research results of model 1 show that EQ has a positive effect on FV, and the research results show that the combination of Board of Directors (BD) and the aggregate Supervisory Board (AC) positively affect the FV. On the other hand, when considering regression according to the SEM structure model with the variable EQ as an intermediate variable, the research results of model 2 are similar to model 1. In addition, model 2, considers that the effect of the synthetic BOD (BD) factor has a positive effect on the EQ while the aggregate Supervisory Board (AC) factor has a negative relationship to the EQ. Based on the research results, the authors propose the following policy implications:
-There exists a relationship between CG and FV pointing to the importance of applying CG methods to businesses in developing countries like Vietnam. The analysis shows that
TOBINQ .98
1 .7 BD
1.3 2.5
AC .77 1.7
EQ -.065
2 .0086 .053
.035 .5 .0031
-.0067