• 검색 결과가 없습니다.

Optimization of Percutaneous Coronary Intervention Using Optical Coherence Tomography

N/A
N/A
Protected

Academic year: 2021

Share "Optimization of Percutaneous Coronary Intervention Using Optical Coherence Tomography"

Copied!
23
0
0

로드 중.... (전체 텍스트 보기)

전체 글

(1)

ABSTRACT

Compared to the luminogram obtained by angiography, intravascular modalities produce cross-sectional images of coronary arteries with a far greater spatial resolution. It is capable of accurately determining the vessel size and plaque morphology. It also eliminates some disadvantages such as contrast streaming, foreshortening, vessel overlap, and angle dependency inherent to angiography. Currently, the development of its system and the visualization of coronary arteries has shown significant advancement. Of those, optical coherence tomography (OCT) makes it possible to obtain high-resolution images of intraluminal and transmural coronary structures leading to navigation of the treatment strategy before and after stent implantations. The aim of this review is to summarize the published data on the clinical utility of OCT, focusing on the use of OCT in interventional cardiology practice to optimize percutaneous coronary intervention.

Keywords: Coronary artery disease; Percutaneous coronary intervention;

Optical coherence tomography

INTRODUCTION

Despite the development of many technologies in the era of percutaneous coronary intervention (PCI) since its introduction in 1977, coronary angiography (CAG) is still used as a gold standard to diagnose coronary artery disease, determine the treatment strategy, and evaluate the therapeutic effect. However, it is also true that CAG has several limitations.

Therefore, the intravascular imaging method has been introduced to overcome the drawbacks of CAG. Intravascular ultrasound (IVUS) has better resolution than CAG. It provides a cross-sectional image and more information than CAG. Thus, it can broaden the horizon and understanding of coronary artery disease. IVUS findings provide important information to physicians before and after coronary stenting. For example, the minimal stent area (MSA) among the IVUS parameters is known to be a predictor of a long-term major adverse cardiovascular event (MACE). 1)2) Until now, IVUS-guided PCI has been classified as Class IIa for a left main (LM) PCI or stent optimization in the American College of Cardiology/

American Heart Association (ACC/AHA) and European Society of Cardiology (ESC) guidelines. 3)4) However, since a meta-analysis has proven its hard endpoint reduction effect

Review Article

Received: Jun 27, 2019 Accepted: Jul 3, 2019 Correspondence to Seung-Ho Hur, MD, PhD, FACC

Division of Cardiology, Department of Internal Medicine, Keimyung University Dongsan Hospital, 1035 Dalgubeol-daero, Dalseo-gu, Daegu 42601, Korea.

E-mail: shur@dsmc.or.kr

Copyright © 2019. The Korean Society of Cardiology

This is an Open Access article distributed under the terms of the Creative Commons Attribution Non-Commercial License (https://

creativecommons.org/licenses/by-nc/4.0) which permits unrestricted noncommercial use, distribution, and reproduction in any medium, provided the original work is properly cited.

ORCID iDs Cheol Hyun Lee

https://orcid.org/0000-0003-4203-1457 Seung-Ho Hur

https://orcid.org/0000-0002-3895-1915 Conflict of Interest

The authors have no financial conflicts of interest.

Author Contributions

Writing - original draft: Lee CH, Hur SH;

Writing - review & editing: Hur SH.

Cheol Hyun Lee , MD and Seung-Ho Hur , MD, PhD, FACC

Division of Cardiology, Department of Internal Medicine, Keimyung University Dongsan Hospital, Daegu, Korea

Optimization of Percutaneous

Coronary Intervention Using Optical

Coherence Tomography

(2)

including mortality, it tends to be used more often in practice or complex PCI procedures. 5)6) Currently, IVUS is regarded as an essential tool for PCI optimization in complex lesions.

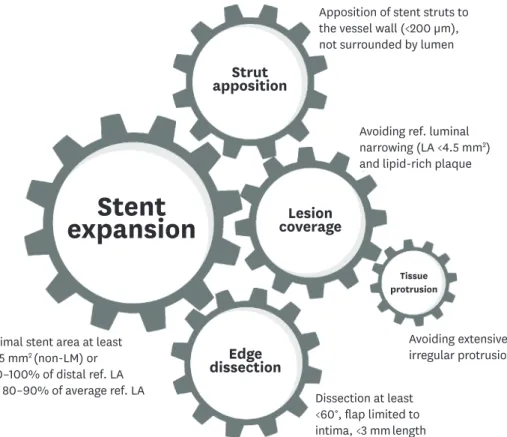
Although intravascular optical coherence tomography (OCT) has a shorter history than IVUS, it has a 10 times higher resolution and provides more information than IVUS. In addition, the development of a user interface for OCT has led to a more accurate approach for stent optimization, including information on the stent expansion, edge dissections, stent apposition, and tissue protrusions (TPs). As the experience of OCT-guided PCI accumulates, the recommendation level of OCT for stent optimization in 2018 ESC/European Association for Cardio-Thoracic Surgery (EACTS) guidelines has been upgraded from Class IIb to Class IIa. 7) Therefore, this article reviews the details, methods, and clinical implications of OCT for PCI optimization.

LIMITATIONS OF CORONARY ANGIOGRAPHY

CAG is still accepted as a gold standard for the diagnosis and treatment of coronary artery disease. 8)9) However, CAG has a limitation as a luminogram in that it can only reveal a change in the lumen. It is difficult to identify changes that appear in the early stage of coronary artery disease with CAG because it can only detect the late process of atherosclerosis such as luminal stenosis. Another serious limitation of CAG is that it is prone to functionally overestimating or underestimating the lesion because only a secondary shadow image is examined (Figure 1). 9-11) It is also difficult to judge the degree of the lesion severity, especially of complex lesions such as diffuse long lesions, bifurcation lesions, and calcified lesions. More importantly, the lesion has to be assessed through visual estimation. Thus, the evaluation of the lesion is inevitably subjective and is prone to have various errors in evaluating target lesions, selecting the treatment strategy, and determining the treatment results through CAG guidance only.

A B

10 20 30 40 mm

diagonal

distal << 53.8 mm, 20.0 mm/sec

Figure 1. A representative case demonstrating a discrepancy between coronary angiography and OCT. The right anterior oblique cranial projection of the left coronary angiogram showing mild stenosis at an LAD bifurcation lesion (A). However, OCT clearly demonstrates a focal (2 mm length) lotus root-like lesion consisting of multiple cavities with septation, which was not seen by coronary angiography (B). Modified from Korean J Intern Med 2016;31:807-808.

LAD = left anterior descending; OCT = optical coherence tomography.

(3)

INTRAVASCULAR IMAGING

To compensate for the limitations of CAG, imaging modalities including IVUS and OCT have been developed for use in clinical practice. IVUS can provide a cross-sectional image of the vessel wall similar to the histological findings using high ultrasound frequencies of 20 to 50 MHz. 12) Thus, IVUS allows a qualitative and quantitative assessment of the lumen, plaque, and vessel in coronary atherosclerotic lesions. On the other hand, OCT can generate a tomographic image using backscattered infrared light with an axial resolution of 12–15 μm. 13) Similar to IVUS, OCT can also provide qualitative and quantitative information for the lesion. However, OCT has several advantages for PCI optimization. First, OCT provides more detailed features (such as the presence of thrombi, plaque erosions, and the cap thickness) of the vascular wall that IVUS cannot detect. Thus, OCT is a better choice for detecting vulnerable plaque. Second, the pullback speed of OCT is faster than that of IVUS. In addition, OCT provides an automated analysis of the minimal and maximal diameters and lumen dimension of the entire area. Moreover, OCT can automatically point to the position of the minimal lumen area (MLA) in the lesion. Third, OCT can provide a more accurate assessment of the interaction with the vessel wall and stent (e.g., stent apposition, stent coverage, TPs, and edge dissections) due to its superior axial and lateral resolution power. The OPUS-CLASS study 14) performed measurements of the coronary arteries using OCT, IVUS, and CAG. The mean minimum lumen diameter (MLD) measured by CAG was significantly smaller than that measured by OCT while the MLD measured by IVUS was significantly greater than that measured by OCT. Using a phantom model, it was found that the mean lumen area measured by OCT was the same as the actual lumen area. However, IVUS overestimated the lumen area compared to OCT (relative reference 10%), suggesting that OCT might be more accurate for assessing coronary lesions than IVUS or CAG. Our previous study 15) had also shown discrepancies among OCT, IVUS, and CAG measurements for a phantom coronary model and human coronary arteries within and adjacent to stented segments. The discrepancy between IVUS and OCT was less prominent, with each measurement showing a stronger correlation for the stented segment than that for the reference segment. That was probably because the stent struts provided a clear landmark for the lumen discrimination in both OCT and IVUS for stented segments. For a phantom model and human coronary arteries, for IVUS as compared to OCT, the lumen area was larger, particularly for non-stented segments than for stented segments. The lumen diameter measured by CAG was smaller than that measured by IVUS or OCT. Based on these two studies, the lumen area measured by OCT is likely to be smaller than that measured by IVUS, particularly for non-stented segments than stented segments. The lumen diameter measured by CAG was smaller than that measured by IVUS or OCT. In addition, OCT could accurately and quantitatively measure the coronary artery dimensions in the clinical setting with a high reproducibility. However, in the post-stent evaluation, the discrepancy between IVUS and OCT was insignificant.

OPTICAL COHERENCE TOMOGRAPHY PARAMETERS FOR PERCUTANEOUS CORONARY INTERVENTION GUIDANCE

Pre-intervention

The role of OCT in pre-intervention is for the lesion evaluation. The plaque composition may

guide the implementation of a preparation strategy. For vulnerable plaque such as that with a

large lipid content or thin cap, and expansive remodeling lesions, direct stenting is an option

without predilatation. Since calcified lesions may not be detected by CAG, 16) an OCT-guided

(4)

PCI might be needed. For calcified lesions, OCT can accurately quantitate both its extent and severity. Thus, it can help physicians make a decision regarding the use of rotablation or cutting balloon for the lesion preparation and the selection of the device. Compared to IVUS, OCT can analyze the depth of calcified lesions in addition to a circumferential arc. Therefore, OCT can precisely measure the calcified lesion area that is known to be associated with underexpansion of stents. 17-19) In addition, the detailed information provided by OCT can be used to guide a calcified lesion preparation. For example, balloon dilatation for calcified plaques with a low thickness and wide arc on OCT (with cut-off values of 0.67 mm and 227°, respectively) can lead to calcium fractures that are known to be associated with a better stent expansion. 17) Similarly, an OCT-based study showed that calcified lesions with a maximum angle of >180°, maximum thickness of >500 μm, and length of >5 mm had increased the risk of stent underexpansion. 20) However, the effect of calcified lesions on the outcomes of a clinical PCI remains unclear.

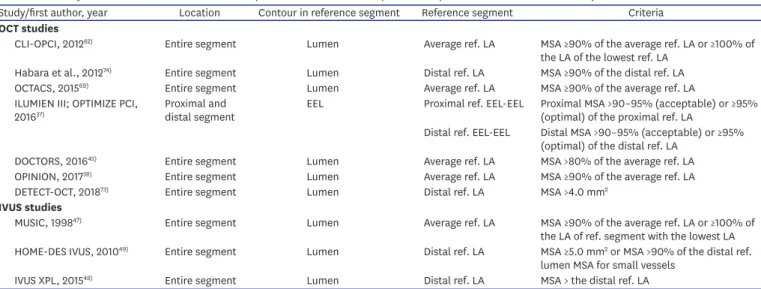
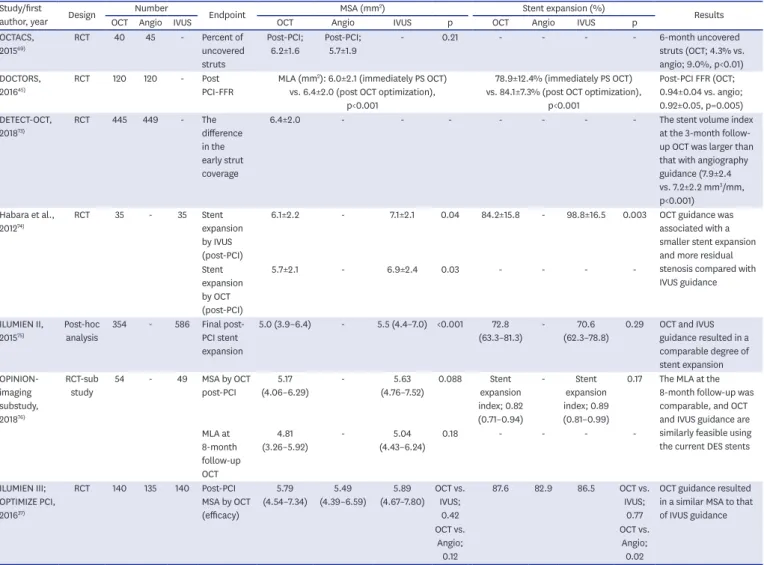
OCT-detected large proportions of lipid plaque and thin-cap fibroatheromas (TCFAs) are known to be associated with a peri-procedural myocardial infarction (MI). 21-27) Owing to the correlation between edge problems in-stent thrombosis (ST) and MACE, 26-34) it might be required to avoid reference segments with large proportions of lipid plaque, particularly those with TCFAs. If lipid is unavoidable in the reference segment, covering the entire lipid- rich plaque with a stent instead of ending the stent in the middle of a lipidic region has been suggested. 28-36) More importantly, either the external elastic lamina (EEL) or the lumen diameter at the reference segments measured by OCT can provide the roadmap for stent sizing. There are two representative studies related to stent sizing. The Observational Study of Optical Coherence Tomography in Patients Undergoing Fractional Flow Reserve and Percutaneous Coronary Intervention (ILUMIEN) III: OPTIMIZE PCI used an EEL-based stent sizing while the Optical Frequency Domain Imaging vs. Intravascular Ultrasound in Percutaneous Coronary Intervention (OPINION) used a lumen-based stent sizing (Table 1). In the ILUMIEN III trial, the maximum and minimum diameters of the EEL at the proximal and distal reference segments

Table 1. Summary of the absolute and relative stent expansion criteria for stent optimization (data from IVUS and OCT studies)

Study/first author, year Location Contour in reference segment Reference segment Criteria

OCT studies

CLI-OPCI, 2012

62)

Entire segment Lumen Average ref. LA MSA ≥90% of the average ref. LA or ≥100% of the LA of the lowest ref. LA

Habara et al., 2012

74)

Entire segment Lumen Distal ref. LA MSA ≥90% of the distal ref. LA

OCTACS, 2015

69)

Entire segment Lumen Average ref. LA MSA ≥90% of the average ref. LA

ILUMIEN III; OPTIMIZE PCI,

2016

37)

Proximal and

distal segment EEL Proximal ref. EEL-EEL Proximal MSA >90–95% (acceptable) or ≥95%

(optimal) of the proximal ref. LA

Distal ref. EEL-EEL Distal MSA >90–95% (acceptable) or ≥95%

(optimal) of the distal ref. LA

DOCTORS, 2016

45)

Entire segment Lumen Average ref. LA MSA >80% of the average ref. LA

OPINION, 2017

38)

Entire segment Lumen Average ref. LA MSA ≥90% of the average ref. LA

DETECT-OCT, 2018

73)

Entire segment Lumen Distal ref. LA MSA >4.0 mm

2

IVUS studies

MUSIC, 1998

47)

Entire segment Lumen Average ref. LA MSA ≥90% of the average ref. LA or ≥100% of

the LA of ref. segment with the lowest LA HOME-DES IVUS, 2010

49)

Entire segment Lumen Distal ref. LA MSA ≥5.0 mm

2

or MSA >90% of the distal ref.

lumen MSA for small vessels

IVUS XPL, 2015

48)

Entire segment Lumen Distal ref. LA MSA > the distal ref. LA

Average ref. LA = (proximal + distal) reference LA/2; CLI-OPCI = Centro per la Lotta Contro L'Infarto-Optimization of Percutaneous Coronary Intervention;

DETECT-OCT = DETErmination of the Duration of the Dual Antiplatelet Therapy by the Degree of the Coverage of The Struts on Optical Coherence Tomography;

DOCTORS = Does Optical Coherence Tomography Optimize Results of Stenting; EEL = external elastic lamina; ILUMIEN = Observational Study of Optical Coherence Tomography in Patients Undergoing Fractional Flow Reserve and Percutaneous Coronary Intervention; HOME-DES IVUS = Long-Term Health Outcome and Mortality Evaluation After Invasive Coronary Treatment using Drug Eluting Stents with or without the IVUS Guidance; IVUS = intravascular ultrasound; IVUS XPL = The Impact of Intravascular Ultrasound Guidance on Outcomes of Xience Prime Stents in Long Lesions; LA = lumen area; MLA, minimal lumen area; MSA

= minimal stent area; MUSIC = Multicenter Ultrasound Stenting in Coronaries; OCT = optical coherence tomography; OCTACS = Optical Coherence Tomography

Guided Percutaneous Coronary Intervention With Nobori Stent Implantation in Patients With Non–ST-Segment–Elevation Myocardial Infarction; OPINION =

Optical Frequency Domain Imaging vs. Intravascular Ultrasound in Percutaneous Coronary Intervention; PCI = percutaneous coronary intervention.

(5)

were measured and the mean EEL diameter of each reference was calculated. The smaller of the two mean EEL diameters was rounded down to the nearest 0.25 mm to derive the stent diameter (e.g., 3.40 mm round down to 3.25 mm). 37) In the OPINION trial, the cross-sections that were close to the target lesion with the most normal appearance that had no lipidic plaque were set as the proximal and distal reference sites. After measuring the lumen diameter at the proximal and distal reference sites, the stent diameter was then calculated. The stent length was determined as the distance between the proximal and distal reference segments. 38) A representative case and illustration of the stent sizing are shown in Figures 2 and 3, respectively.

Intriguingly, the OPTIS integrated (OPTISi) angiographic co-registration system consists of the tracking radiopaque lens marker of the OCT catheter on a cine acquired during the OCT pullback. The software of the OPTISi system directly displays a matched side-by-side view of the OCT and angiography in the cath lab and eliminates the need for the currently used stand- alone, mobile OCT carts. A small white marker is directly projected onto the angiogram to pinpoint the corresponding site of the displayed OCT frame. Co-registration allows “mapping”

of coronary lesions on the angiographic roadmap (error margin approximately 1 mm). By using the OPTIS system, the stent length and location of the plaque can be linked to the angiography findings. It can be performed to carry out a more accurate intervention (Figure 4). 39)

Post-intervention

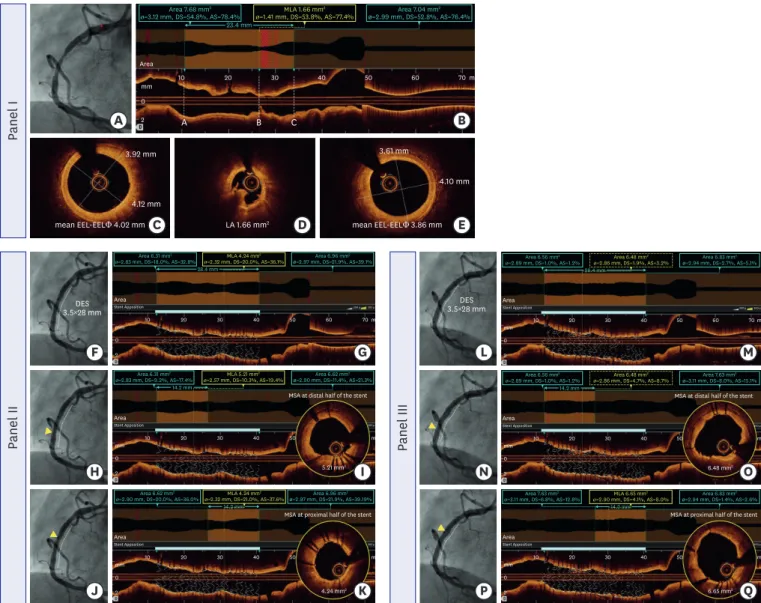
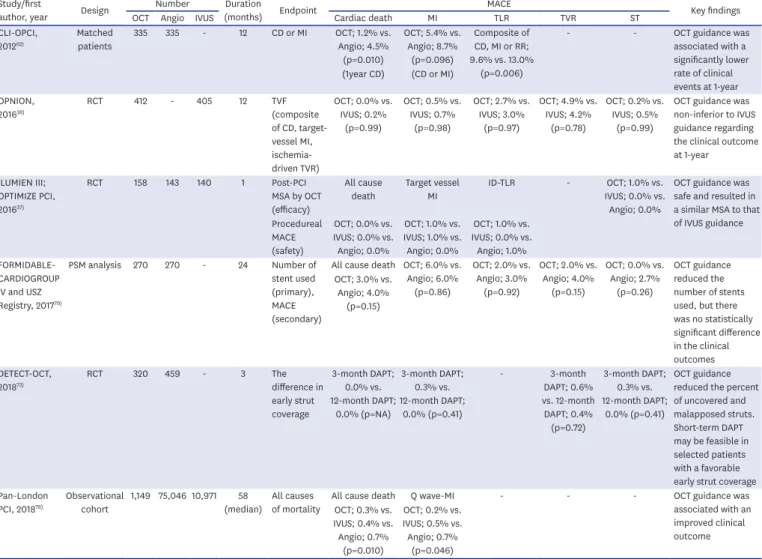
Stent underexpansion is an important risk factor of stent failure. 40)41) Stent expansion refers to the minimum cross-sectional area (CSA) of a stent as an absolute measurement (absolute stent expansion) or compared to a predetermined reference site that can be the proximal, distal, largest, or average reference site (relative stent expansion). In principle, a greater absolute stent expansion is associated with better stent-related clinical outcomes and a lower risk of stent failure. 41-43) Compared to the relative stent expansion, the absolute stent expansion appeared to be able to better predict the stent patency. Regarding the absolute stent expansion, some studies have shown strong evidence that IVUS is useful for non-left main (non-LM) lesions and the drug-eluting stent (DES) era with a cut-off of >5 mm 2 . 41)44) IVUS studies with second-generation DESs demonstrated that a stent CSA of 5.5 mm 2 is the best cut-off for subsequent events in non-LM lesions. 41)44) IVUS studies with second- generation DESs have relatively consistently demonstrated that a stent CSA of 5.5 mm 2 is the best cut-off for subsequent events in non-LM lesions. 41)44) However, the cut-offs values for LM lesions are larger than that for non-LM lesions (by IVUS: distal LM >7 mm 2 ; proximal LM

>8 mm 2 ). With OCT, the optimal cut-off to predict a post-procedural fractional flow reserve

(FFR) of >0.90 was consistently found to be >5.44 mm 2 in the Does Optical Coherence

Tomography Optimize Results of Stenting (DOCTORS) trial. 45) However, the results from the

Centro per la Lotta Contro L'Infarto-Optimization of Percutaneous Coronary Intervention

(CLI-OPCI) II registries have revealed that an MLA of 4.5 mm 2 is the best cut-off value for

OCT to identify patients with MACEs. 46) The current OPTIS OCT system enables the easy

detection of the relative stent expansion and automated measurements after the stent

deployment. The MSA and percentage of the stent expansion can be automatically calculated

and highlighted after assigning markers for the site of interest that are close to the proximal

and distal edges of the stent translating into a user-friendly tool during PCI. In terms of the

relative stent expansion, the Multicenter Ultrasound Stenting in Coronaries (MUSIC) study

criteria used a MSA of >90% of the average reference lumen area or >100% of a smaller

reference lumen area with a complete apposition and symmetric expansion as the cut-off

for IVUS. 47) The Impact of Intravascular Ultrasound Guidance on Outcomes of Xience Prime

Stents in Long Lesions (IVUS XPL) criteria used a MSA ≥ the distal reference lumen area. 48)

Although the absolute stent expansion criteria have been commonly used in several studies

(6)

Panel I A B

C D E

mean EEL-EELΦ 4.02 mm LA 1.66 mm

2

4.10 mm 3.61 mm

4.12 mm 3.92 mm

0 10

A B C

20 30 40 50 60 70

2 Area

mm m

mean EEL-EELΦ 3.86 mm 23.4 mm

Area 7.68 mm

2

ø=3.12 mm, DS=54.8%, AS=78.4% Area 7.04 mm

2

ø=2.99 mm, DS=52.8%, AS=76.4%

MLA 1.66 mm

2

ø=1.41 mm, DS=53.8%, AS=77.4%

Panel II

F G

H I

J K

5.21 mm2

4.24 mm2

3.5×28 mm DES

MSA at proximal half of the stent

0

10 20 30 40 50

2 Area

Stent Apposition 300 µ

mm

m 14.2 mm

Area 6.96 mm2 ø=2.97 mm, DS=21.9%, AS=39.19%

Area 6.62 mm2

ø=2.90 mm, DS=20.0%, AS=36.0% MLA 4.24 mm2 ø=2.32 mm, DS=21.0%, AS=37.6%

MSA at distal half of the stent

0

10 20 30 40 50

2 Area

Stent Apposition 300 µ

mm m

14.2 mm Area 6.31 mm2

ø=2.83 mm, DS=9.2%, AS=17.4% MLA 5.21 mm2

ø=2.57 mm, DS=10.3%, AS=19.4% Area 6.62 mm2 ø=2.90 mm, DS=11.4%, AS=21.3%

0

10 20 30 40 50 60 70

2 Area

Stent Apposition 200 µ 300 µ

mm

m 28.4 mm

Area 6.31 mm2

ø=2.83 mm, DS=18.0%, AS=32.8% MLA 4.24 mm2

ø=2.32 mm, DS=20.0%, AS=36.1% Area 6.96 mm2 ø=2.97 mm, DS=21.9%, AS=39.1%

Panel III

L M

N O

P Q

6.48 mm2

6.65 mm2

3.5×28 mm DES

MSA at proximal half of the stent

0

10 20 30 40 50

2 Area

Stent Apposition 300 µ

mm

m 14.2 mm

Area 7.63 mm2

ø=3.11 mm, DS=6.8%, AS=12.8% MLA 6.65 mm2

ø=2.90 mm, DS=4.1%, AS=8.0% Area 6.83 mm2 ø=2.94 mm, DS=1.4%, AS=2.6%

14.2 mm

MSA at distal half of the stent

0

10 20 30 40 50

2 Area

Stent Apposition 300 µ

mm

m Area 6.56 mm2

ø=2.89 mm, DS=1.0%, AS=1.2% Area 6.48 mm2

ø=2.86 mm, DS=4.7%, AS=8.7% Area 7.63 mm2 ø=3.11 mm, DS=8.0%, AS=15.1%

0

10 20 30 40 50 60 70

2 Area

Stent Apposition 200 µ 300 µ

mm m

28.4 mm Area 6.56 mm2

ø=2.89 mm, DS=1.0%, AS=1.2% Area 6.48 mm2

ø=2.86 mm, DS=1.9%, AS=3.2% Area 6.83 mm2 ø=2.94 mm, DS=2.7%, AS=5.1%

Figure 2. A representative case of an OCT-guided PCI (stent sizing and post-stent optimization). A 57-year old female patient with a non-ST segment myocardial infarction underwent CAG and an OCT examination before the intervention (panel I, A-E), after the stent implantation (panel II, F-K) and after additional balloon dilatation (panel III, L-Q). The baseline CAG revealed significant stenosis in the proximal right coronary artery (A). A longitudinal OCT image revealed a lesion length of 23.3 mm (B) and the cross-sectional OCT image revelaed a 1.66 mm

2

lumen area with a red thrombus (C). Because the EEL contours were identifiable in both the proximal (C) and distal (D) reference segments, the mean EEL to EEL diameter was calculated. Of these, the lowest EEL to EEL diameter was 3.89 mm in the proximal reference segment (E). Thus a 3.5×28 mm Xience stent was chosen based on downsizing to the nearest stent diameter (3.5 mm) from the lowest EEL to EEL diameter (3.89 mm) and was implanted with a 12 atmospheric pressure. After the stent implantation, a CAG showed a mild residual stenosis at the proximal portion within the stented segments (F) and the longitudinal OCT image showed that the MSA was 4.24 mm

2

and was located at the proximal one-third portion within the stented segments (G). Because a long stent (≥28 mm) was implanted in the proximal right coronary artery, the entire stented segments were divided by the stent length of 14 mm, half the stent length, and the reference bar was moved to each distal and proximal stented segment for an evaluation of the optimal relative stent expansion. Then, the residual AS was manually calculated by the OPTIS system: [[{1−(proximal (or distal) MSA/proximal (or distal) reference lumen area)}×100]=residual proximal (or distal) AS (%)]. The longitudinal and cross-sectional OCT images showed that the MSA in the distal half of the stented segments was 5.21 mm

2

, which calculated that the residual distal AS value was 17.4% relative to distal reference lumen area: [{1−(5.21/6.31)×100}=17.4%

of AS] (I). Similarly, the MSA in the proximal half of the stented segments was 4.24 mm

2

, which calculated that the residual proximal AS value was 39.1%

relative to proximal reference lumen area [{1−(4.24/6.96)×100}=39.1% of AS] (K). Stent underexpansion was confirmed by these AS results (an acceptable stent expansion is defined as an AS of at least <10% relative to each reference lumen area). The post-dilatation balloon size was determined by the EEL to EEL diameter of the proximal reference segment. Thus, post-dilatation was performed using a 3.75×8 mm non-compliant balloon throughout the stented segments.

After additional balloon dilatation, a CAG showed no residual stenosis within the stented segments (L). The longitudinal and cross-sectional OCT images showed that the MSA in the distal half of the stented segments improved from 5.21 mm

2

to 6.48 mm

2

, which calculated that the residual distal AS value had reduced from 17.4% to 1.2% relative to the distal reference lumen area [{1−(6.48/6.56)×100}=1.2% of AS] (O). Similarly, the MSA in the proximal half of the stented segments improved from 4.24 mm

2

to 6.65 mm

2

, suggesting that the residual proximal AS value had decreased from 39.1% to 2.7% relative to the proximal reference lumen area [{1−(6.65/6.83)×100}=2.6% of AS] (Q). Based on the AS results post-dilatation, the stent optimization was confirmed without any complications.

AS = area stenosis; CAG = coronary angiography; DS = diameter stenosis; EEL = external elastic lamina; Φ = diameter; MSA = minimal stent area; MLA = minimal

lumen area; OCT = optical coherence tomography; PCI = percutaneous coronary intervention.

(7)

(cut-off of the MSA of >6.5mm 2 for bare-metal stents [BMSs] 42) and >5 mm 2 for DESs 49) ), it is not easy to achieve this cut-off value for small vessel disease (<2.5 mm). The relative stent expansion can be effectively applicable under these circumstances for both OCT and IVUS. The relative expansion for stent optimization includes that the MSA is either >90%

to 100% of the distal reference lumen area or >80% to 90% of the average (proximal and distal) reference lumen area. 37)45)48)74) A recent IVUS study demonstrated that the presence of a MSA greater than the distal reference lumen area was correlated with a low adverse event rate (1.5% during 1 year). 48) Interestingly, the ILUMIEN III proposed that the stented segment

(+) (+)

Split

2 parts Not met

Met

(−) (−) (+) (−)

Pre-PCI OCT

Downsizing to the nearest stent Φ

Upsizing by 0.25 mm to derive the stent Φ Calculated mean EEL Ф at distal

(or smallest) ref. segment (if EEL contour <180°, use 1 EEL to EEL Φ)

Calculated mean lumen Ф at distal (or smallest) ref. segment Step 1

Step 2

Step 3

Step 4

Identifying EEL or lumen border at both ref. segments

Determination of stent length based on the automated OCT system If heavy calcified (arc ≥180°, length >5 mm, thickness >0.5 mm) lesion (+) in the culprit lesion: use of rotablator or cutting/scoring balloon inflation Stent

implantation Stent deployment with moderate to high pressure inflation

Post-dilatation using non-compliant balloon Post-PCI OCT evaluation

Post-PCI angiography

Post-PCI OCT

Repeated post-dilatation using NC balloon

Repeated post-dilatation using NC balloon Proximal MSA ≥

90% of proximal ref. LA and distal MSA ≥ 90% of distal ref. LA MSA ≥4.5 mm 2 (not small vessel) MSA ≥90–100% of distal ref. LA or

≥80–90% of average ref. LA

Procedure complete

Procedure complete Residual stenosis

Long stent length (≥28 mm or overlapped) tapered vessel Less long stent length (<28 mm) non-tapered vessel MSA

Larger balloon or NC balloon with high-pressure inflation Procedure complete

Additional stent implantation Procedure complete

Consider additional stent implantation Consider potent P2Y12 inhibitor Malapposition (≥200 µm)

Edge dissection (arc ≥60°, length ≥3 mm)

Lesion coverage Tissue protrusion (extensive, irregular)

(+) (−) EEL (+)

EEL (−)

Met Not met

Not met Met

Figure 3. Stepwise procedure for the stent optimization under OCT guidance.

EEL = external elastic lamina; PCI = percutaneous coronary intervention; OCT = optical coherence tomography; Φ = diameter; MSA = minimal stent area; ref. =

reference; LA = lumen area; NC = noncompliant.

(8)

can be halved to attain >90% of the average reference (proximal and distal) lumen area for the MSA in each proximal and distal stent segment based on considering natural vessel tapering. 37) Another study suggested that a MSA of >80% of the average reference lumen area can predict a FFR of >0.90. 45) Considering these data, the relative stent expansion criteria seem to be reasonable when the MSA is > 90% to 100% of the distal reference lumen area or

>80% to 90% of the average reference lumen area.

TP is an intra-stent protrusion of the tissue into the lumen between the stent struts. 50) Some investigators have suggested an arbitrary definition of TP as an intraluminal mass (100–500 μm) without any communication with the vessel wall or protruding tissue with a circular arc connecting adjacent struts (Table 2). 51-55) Our small study showed that TPs were present in 95% of stented segments as viewed by OCT and in 45% of the stented segments as viewed by IVUS with the best cut-off values for the area, depth, and burden of the TP on the OCT to detect a TP on IVUS of 0.17 mm 2 , 0.17 mm, and 1.98%, respectively. 56) Therefore, IVUS could not detect TPs in half of the patients. This is probably due to its limited resolution

Panel I Panel II

0

10 20 30 40 50 60 70

mm 2

0

10 20 30 40 50 60 70

1 mm

mm

Intimal flap

Intimal flap GW

2

3.0×35 mm DES

A

C

D

1 mm

1 mm B 1 mm E

F

Panel III

0

10 20 30 40 50 60 70

1 mm

mm 2

Additional DES 3.5×15 mm

3.0×35 mm DES

G 1 mm H

I

Figure 4. A representative case of an OCT-angiography coregistration. Preinterventional OCT-angiography coregistration (panel I, A-C). Angiographic coregistration (A) shows diffuse significant disease in the proximal portion of the LAD. The red arrowheads indicate the proximal reference segment. The corresponding cross-sectional OCT image (B) demonstrates a fibrous plaque with a preserved lumen area at the proximal reference segment, and the longitudinal OCT image (C) also shows diffuse significant disease in the proximal portion of the LAD. Post-stenting OCT-angiography coregistration (panel II, D-F). In the angiographic coregistration (D), the 2nd red arrowhead and sky-blue arrowhead indicate the stented segments (1st DES 3.0×35 mm). The 1st red arrowhead indicates the location of the proximal edge dissection. The corresponding cross-sectional OCT image (E) and longitudinal OCT image (F) show a severe dissection with an intimal flap. Thus, a 2nd DES (3.5×15 mm) was implanted and the final OCT-angiography coregistration shows that the additional DES completely covered the prior proximal edge dissection (panel III, G-I).

OCT = optical coherence tomography; DES = drug-eluting stent; GW = guide wire; LAD = left anterior descending.

(9)

compared to OCT. One registry reported that OCT-detected TPs can be classified into three categories based on the extent of the vessel injury: smooth protrusions with minimal vessel injury, disrupted fibrous TPs with mild vessel injury, and irregular protrusions with moderate to severe vessel injury and a high possibility of medial disruption and a lipid core penetration. 57) Among these different patterns, the irregular protrusions may be associated with adverse outcomes in a large cohort. 57) The OCT findings of TPs after stent implantations have been reported to be associated with early stent thrombosis and a poor short-term prognosis after PCI. 30)54)58)59) The volume of the protruding tissue as viewed by OCT is associated with an unstable plaque feature and peri-procedural MIs. 60) The CLI-OPCI and Harmonizing Outcomes with Revascularization and Stents in Acute Myocardial Infarction (HORIZONS-AMI) sub-studies showed that TPs during acute coronary syndrome (ACS) are more likely to have consequences than those in non-ACS patients in the clinical setting. 30) Nevertheless, numerous IVUS and OCT studies have reported that the presence of a TP may not be associated with unfavorable long-term clinical outcomes in both ACS and non-ACS patients. 54)55)61) Given the lesser evidence of its clinical relevance, the physician may attempt to avoid an extensive irregular TP after a stent implantation at the present time.

Stent edge dissections can usually be detected by OCT. However, they may not be detected by CAG. 37) Edge dissection is defined as a linear rim of tissue adjacent to a stent edge (<5 mm) with a width of ≥200 μm. 62) Different factors can affect the edge dissection, including the dissection depth/location/length, dissection flap angle, and residual lumen area at the dissection site. 37)62)63) In ILUMIEN III, edge dissections were defined as being major by OCT when they extend in an arc of >60° and were >3 mm in length based on the Assessment of Dual Antiplatelet Therapy With Drug-Eluting Stents (ADAPT-DES) registry data. 35) Edge dissections at the distal stent edge as viewed by OCT, but not the proximal stent edge, were revealed to be an independent predictor of a MACE (hazard ratio [HR], 2.5) in the CLI-OPCI Table 2. Summary of the stent apposition, edge dissection, tissue protrusion, and reference luminal narrowing for stent optimization (data from OCT studies)

Study, year Stent apposition Edge dissection Tissue protrusion Reference luminal narrowing

Imola et al.,

2010

70)

The distance between a strut and vessel wall of ≤200 µm and a length <600 µm

No disruption in the luminal vessel surface at the edge segments (within 5 mm proximal and distal to the stent)

The distance from the stent struts to the greatest extent of a protrusion of ≤100 µm

NA

CLI-OPCI,

2012

62)

A stent lumen distance

≤200 µm The presence of a linear rim of tissue, with a width of <200 µm and a clear separation from the vessel wall or plaque (<5 mm) to the stent edge

Intraluminal mass of <200 µm with no direct continuity with the vessel wall or a highly back scattered luminal protrusion in continuity with the vessel wall

LA ≥4.0 mm

2

CLI-OPCI II,

2015

46)

A stent-adjacent vessel

lumen distance ≤200 µm The presence of a linear rim of tissue with a width <200 µm and a clear separation from the vessel wall or underlying plaque <5 mm to the stent edge

Tissue prolapsing between stent struts with a circular arc connecting adjacent struts or intraluminal mass of <500 µm, with no continuity with the vessel wall

LA ≥4.5 mm

2

in the presence of significant residual plaque adjacent to the stent endings

OCTACS,

2015

69)

<3 struts per CSA detached

≤140 µm from the underlying vessel wall

Insignificant (causing MLA ≥4 mm

2

) NA Insignificant residual

stenosis (MLA ≥4 mm

2

) ILUMIEN III;

OPTIMIZE PCI, 2016

37)

Struts clearly separated from

the vessel wall by <200 µm Minor: any visible edge dissection of

<60° of the circumference of the vessel and <3 mm in length

A protrusion is defined as any mass at <200 µm beyond the luminal edge of a strut

Untreated mean LA of ≤60%

of the adjacent reference segment LA of up to 10 mm from both stent edges OPINION,

2017

38)

Complete apposition over

the entire length No edge dissection with the potential

to provoke a flow disturbance No tissue protrusion with the potential to provoke a flow disturbance

NA

CLI-OPCI = Centro per la Lotta Contro L'Infarto-Optimization of Percutaneous Coronary Intervention; CSA = cross-sectional area; ILUMIEN = Observational

Study of Optical Coherence Tomography in Patients Undergoing Fractional Flow Reserve and Percutaneous Coronary Intervention; LA = lumen area; MLA =

minimal lumen area, NA = not available; OCT = optical coherence tomography; OCTACS = Optical Coherence Tomography Guided Percutaneous Coronary

Intervention With Nobori Stent Implantation in Patients With Non–ST-Segment–Elevation Myocardial Infarction; OPINION = Optical Frequency Domain Imaging

vs. Intravascular Ultrasound in Percutaneous Coronary Intervention; PCI = percutaneous coronary intervention.

(10)

study. 62) Overall, additional intervention may not be needed unless there is an extensive edge dissection with or without a flow limitation.

Stent malapposition refers to the lack of contact of the stent struts with the vessel wall of

≥200 μm as viewed by OCT. Underexpansion and stent malapposition can co-exist and can also occur independently. Moreover, malapposition can appear in different stages (acute, post-procedural, or late stage) possibly due to the underlying vascular process of inflammation and/or positive remodeling of the vessel wall. A malapposition indicator can be accessed with the OPTIS OCT system as it can highlight areas of the stent that have become disconnected from the vessel wall (Figure 5). Although an acute stent malapposition can be easily detected with OCT, its clinical outcomes remain controversial. Several

studies have reported that an acute stent malapposition is not associated with adverse clinical outcomes, 64)65) whereas a high frequency of malappositions has been observed in patients with acute and late stent thromboses. 66)67) Thus, when a malapposition is greater than 500 μm, (particularly when it is continuous with a length of >1 mm) and the malapposition exhibits an underexpansion that can deteriorate into a turbulent flow, and when a malapposition occurs in the proximal stented segments that may make the re-entry in the vessel difficult, an additional procedure might be needed. 68) Nevertheless, several studies have addressed that stent malappositions of <200 μm may be acceptable for stent optimization. 46)62)69)

OPTIMIZATION OF PERCUTANEOUS CORONARY INTERVENTION UNDER OPTICAL COHERENCE TOMOGRAPHY GUIDANCE

The concept of an IVUS guided PCI, including an absolute and relative stent expansion, stent apposition, edge dissection, and lesion coverage, has also been introduced in the DES era for stent optimization through the BMS era. In the Long-Term Health Outcome and Mortality Evaluation After Invasive Coronary Treatment using Drug Eluting Stents with or without the IVUS Guidance (HOME-DES IVUS) study, 49) an optimal stent deployment was defined as a complete apposition of the stent struts without any edge dissections, and an adequate stent expansion was defined as either a MSA of >5.0 mm 2 or >90% of the distal reference lumen area. In the IVUS XPL study, an optimal stent expansion was defined as having an MLA of greater than the lumen area in the distal reference segments. 48) With the development of the OCT system, the OCT criteria began to be based on the previous IVUS studies. In the Optical Coherence Tomography Guided Percutaneous Coronary Intervention With Nobori Stent Implantation in Patients With Non–ST-Segment–Elevation Myocardial Infarction (OCTACS) study, 69) the stent optimization criteria were: 1) MSA of ≥90% of the average reference lumen area; 2) avoiding any significant stent malapposition (defined as a strut that had detached

≤140 μm from the underlying vessel wall); 3) no significant edge dissection (causing an MLA of ≥4.0 mm 2 ); and 4) no significant residual stenosis (causing an MLA of ≥4.0 mm 2 ).

Prati F and colleagues reported the CLI-OPCI and CLI-OPCI II studies for evaluating the

effect of OCT-guided PCI on the clinical outcomes. The criteria for stent optimization in the

CLI-OPCI study were: 1) MSA of ≥90% of the average reference lumen area or ≥100% of the

lumen area of the lowest reference lumen area; 2) distance of the stent to the lumen of <200

μm; 3) edge dissection with a width of <200 μm; 4) TP of <200 μm; and 5) reference luminal

narrowing of ≥4.0 mm 2 . Similarly, the CLI-OPCI II study suggested the following criteria:

(11)

1) MSA of ≥4.5 mm 2 ; 2) MSA of ≥70% of the average reference lumen area; 3) stent-adjacent vessel lumen distance of ≤200 μm; 4) edge dissection with a width of <200 μm adjacent (<5 mm) to a stent edge; 5) intrastent plaque/thrombus protrusion of <500 μm in thickness; and 6) reference luminal narrowing of ≥4.5 mm 2 . Of those, the MSA, distal edge dissection, and

Panel I Panel II Panel III Panel IV

3.5×23 mm DES

2.5×28 mm DES 1,050 µm

Strut malapposed

segments

20 30 40 50

20

10 30 40 50

20

10 30 40 50

60

Stent Apposition 200 µ 300 µ

Stent Apposition 200 µ 300 µ

0 2 mm

A B C

D E F

G H I

K L M

J

Figure 5. A representative case demonstrating a stent malapposition viewed by OCT. Preinterventional angiography and OCT images (panel I, A-C).

Interventional images of pre-dilatation and stent implantation (panel II, D-F). Pre-dilatation was performed using a 2.5×20 mm compliant balloon (D) followed by stent implantation in the LAD (1st DES 2.75×28 mm, 2nd DES 3.5×23 mm) (E-F). A post-PCI stent malapposition was detected by OCT images (panel III, G-I).

Post-PCI angiography did not detect any stent malappositions (G). In the OCT cross-sectional view, the maximal stent to vessel wall distance was 1,050 µm (H). In the OCT longitudinal view, a critical stent malapposition (red line) was detected in the stent proximal segment and the stent malapposition length was approximately 5 mm (I). Additional high-pressure dilatation using a NC 4.5×8 mm balloon (J). Final angiography and OCT images after the NC ballooning (panel IV, K-M). Slight expansion of the stent proximal segment on angiography (K). No evidence of a stent malapposition in the OCT cross-sectional view (L). No visible automatic detected critical stent malappositions in the OCT longitudinal view (M).

OCT = optical coherence tomography; DES = drug-eluting stent; LAD = left anterior descending; NC = noncompliant; PCI = percutaneous coronary intervention.

(12)

reference luminal narrowing were independent predictors of MACE. 46)62) Recently, two OCT randomized control trials have also reported stent optimization criteria. The OPINION trial 38) suggested the following criteria: 1) MSA of >90% of the average reference lumen area; 2) stent expansion defined by a MLD/maximum lumen diameter of >0.7; 3) a stent malapposition (distance between stent and lumen) of ≤350 μm through the entire segments; 4) no flow- limiting protrusions; and 5) no flow-limiting edge dissections. The ILUMIEN III trial 37) has proposed the following stent optimization criteria using OCT: 1) an acceptable stent expansion with MSA of >90% in both the proximal and distal halves of the stent relative to the closest reference segment; 2) no tissue or thrombus protrusions with untreated reference segment disease; 3) no edge dissections that are ≥60° of the circumference of the vessel at the site of the dissection, ≥3 mm in length, or any visible edge dissection of <60° of the circumference of the vessel of <3 mm in length; and 4) stent apposition with struts clearly separated from the vessel wall by <200 μm.

Overall, most studies have defined five important factors (stent expansion, stent apposition, TP, edge dissection, and lesion coverage) for stent optimization when using OCT. The acceptable criteria are summarized as shown in Figure 6. We also summarized the algorithm of the stent optimization under OCT guidance with a stepwise approach as shown in Figure 3 based on recent OCT studies. 37)38)46)62)70) During the pre-PCI OCT (Step 1), the stent size can be determined by the mean EEL diameter or mean lumen diameter based on the identification of the EEL contour in the reference segments while the stent length can be determined by the OCT measurements. If the lesion is heavily calcified, a lesion modification is needed.

During the stent implantation (Step 2), the stent deployment is accompanied by a moderate

Avoiding ref. luminal narrowing (LA <4.5 mm 2 ) and lipid-rich plaque

Minimal stent area at least - 4.5 mm 2 (non-LM) or - 90–100% of distal ref. LA

or 80–90% of average ref. LA Dissection at least

<60°, flap limited to intima, <3 mm length

Avoiding extensive irregular protrusion

Strut apposition

Stent

expansion coverage Lesion

Tissue protrusion

dissection Edge

Apposition of stent struts to the vessel wall (<200 µm), not surrounded by lumen

Figure 6. Acceptable criteria of stent optimization by OCT.

LA = lumen area; LM = left main; OCT = optical coherence tomography; ref. = reference.

(13)

to high-pressure balloon inflation. After the stent implantation, residual stenosis within the stented segments should be evaluated by CAG. If residual stenosis exits, a post-dilatation using a non-compliant balloon should be performed. If there is no residual stenosis, a repeat OCT examination should be performed. During the post-PCI OCT (Step 4), at least the MSA, stent malapposition, edge dissection, lesion coverage, and TP should be evaluated and the following strategy can be decided according to the post-PCI OCT findings. An automated OCT-angiography co-registration system can be used to detect the landing zones of the stent edge and measure the optimal stent length. However, CAG has ambiguity as it visually selects

“normal-appearing” reference segments in which lipid-rich plaque may be extensive. 16) Future studies are required to compare the anatomic lesion length by OCT with the physiologic lesion length measured by a FFR pull-back or using automated instantaneous wave-free ratio maps 71) in tandem or with diffuse stenosis to investigate the effect of using both OCT imaging and physiologic guidance in the stent optimization of such lesions. An OCT-angiography co-registration system can be used for a quick detection and targeted post-dilatation of underexpanded stent segments without any unnecessary post-dilatation, especially near the proximal and distal stent edges where post-dilatation might lead to an edge complication. 72)

IMAGING OUTCOMES OF THE OPTICAL COHERENCE TOMOGRAPHY-GUIDED PERCUTANEOUS CORONARY INTERVENTION

Any change within stented segments can be clearly evaluated through repeated OCT examinations after PCI. Many studies have reported the imaging outcome after stent implantations immediately and at follow-up using OCT examinations (Table 3). 37)45)69)73-76)

Two OCT studies have addressed the imaging outcomes between the OCT-guided PCI and angio-guided PCI. The DETErmination of the Duration of the Dual Antiplatelet Therapy by the Degree of the Coverage of The Struts on Optical Coherence Tomography (DETECT-OCT) trial 73) reported that the stent and lumen volume index in the OCT-guided PCI group at the 3-month follow-up are larger than those of the angio-guided PCI group (7.9±2.4 mm 3 vs.

7.2±2.2 mm 3 , p<0.001 and 7.4±2.3 mm 3 vs. 6.8±2.2 mm 3 , p=0.001, respectively). In addition,

the maximal axial length of a malapposed strut and percent of uncovered struts in the

OCT-guided group were lower than those in the angio-guided group (0.2 mm vs. 1.0 mm,

p=0.021 and 7.5% vs. 9.9%, p=0.009, respectively). In the OCTACS trial, 69) the MSA and stent

malapposition did not significantly differ between the OCT-guided and angio-guided PCI

groups (6.2±1.6 vs. 5.7±1.9, p=0.21 and 48.4% vs. 51.6%, p=0.85, respectively). However, the

percentage of uncovered struts was significant lower in the OCT-guided group than angio-

guided group (4.3% vs. 9.0%, p<0.01). On the other hand, several studies have addressed

the imaging outcomes between the OCT versus IVUS imaging modalities. Habara et al. 74)

reported that the MSA is smaller (6.1±2.2 mm vs. 7.1±2.1 mm, p<0.05) and the frequency

of a significant residual reference segment stenosis at the proximal edge is higher in the

OCT-guided group (p<0.05) than IVUS-guided group. However, the malappositions were

similar (p=0.34) between the two groups. The OPINION-imaging substudy 76) showed that

immediately after the PCI, the OCT-guided PCI group had a smaller trend of the MSA (5.28

mm 2 vs. 6.12 mm 2 , p=0.088), fewer proximal stent-edge hematomas (p=0.04), and fewer

irregular protrusions (p=0.014) than the IVUS-guided PCI group. The MLA, edge dissections,

and malappositions were comparable between the two groups. The ILUMIEN II study 75)

reported the results of the final post-PCI stent expansion according to the type of imaging

(14)

guidance. After a matched-pair analysis, the degree of stent expansion did not significantly differ between the OCT and IVUS guidance groups (72.8% vs. 70.6%, p=0.29). Although the incidences of any stent malapposition, any TP, and any edge dissection after PCI were higher in the OCT guidance group, major malapposition, major TP, and major dissection were similar between the OCT and IVUS guidance groups. The ILUMIEN III trial 37) showed a post-PCI MSA according to three imaging modalities. The MSA did not significantly different among the 3 groups and the minimum and mean stent expansion rates did not differ between the OCT-guided and IVUS-guided groups (87.6% vs. 86.5%, p=0.77 and 105.8% vs. 106.3%, p=0.63, respectively). However, the minimum and mean stent expansion rates were higher in the OCT-guided PCI group than angio-guided PCI group (87.6% vs. 82.9%, p=0.02 and 105.8% vs. 101.4%, p=0.001, respectively) and the major dissection and major malapposition rates were lower in the OCT-guided PCI group than IVUS-guided PCI group (14% vs. 26%, p=0.009 and 11% vs. 21%, p=0.02, respectively).

Table 3. Comparison of the OCT studies for the imaging outcome Study/first

author, year Design OCT Angio IVUS Number Endpoint OCT Angio MSA (mm

2

) IVUS p OCT Stent expansion (%) Angio IVUS p Results OCTACS,

2015

69)

RCT 40 45 - Percent of

uncovered struts

Post-PCI;

6.2±1.6 Post-PCI;

5.7±1.9 - 0.21 - - - - 6-month uncovered

struts (OCT; 4.3% vs.

angio; 9.0%, p<0.01) DOCTORS,

2016

45)

RCT 120 120 - Post

PCI-FFR

MLA (mm

2

): 6.0±2.1 (immediately PS OCT) vs. 6.4±2.0 (post OCT optimization),

p<0.001

78.9±12.4% (immediately PS OCT) vs. 84.1±7.3% (post OCT optimization),

p<0.001

Post-PCI FFR (OCT;

0.94±0.04 vs. angio;

0.92±0.05, p=0.005) DETECT-OCT,

2018

73)

RCT 445 449 - The

difference in the early strut coverage

6.4±2.0 - - - - - - - The stent volume index

at the 3-month follow- up OCT was larger than that with angiography guidance (7.9±2.4 vs. 7.2±2.2 mm

3

/mm, p<0.001)

Habara et al.,

2012

74)

RCT 35 - 35 Stent

expansion by IVUS (post-PCI)

6.1±2.2 - 7.1±2.1 0.04 84.2±15.8 - 98.8±16.5 0.003 OCT guidance was

associated with a smaller stent expansion and more residual stenosis compared with IVUS guidance Stent

expansion by OCT (post-PCI)

5.7±2.1 - 6.9±2.4 0.03 - - - -

ILUMIEN II, 2015

75)

Post-hoc analysis

354 - 586 Final post- PCI stent expansion

5.0 (3.9–6.4) - 5.5 (4.4–7.0) <0.001 72.8 (63.3–81.3)

- 70.6

(62.3–78.8)

0.29 OCT and IVUS guidance resulted in a comparable degree of stent expansion OPINION-

imaging substudy, 2018

76)

RCT-sub

study 54 - 49 MSA by OCT

post-PCI 5.17

(4.06–6.29) - 5.63

(4.76–7.52) 0.088 Stent expansion index; 0.82 (0.71–0.94)

- Stent

expansion index; 0.89 (0.81–0.99)

0.17 The MLA at the 8-month follow-up was comparable, and OCT and IVUS guidance are similarly feasible using the current DES stents MLA at

8-month follow-up OCT

4.81

(3.26–5.92) - 5.04

(4.43–6.24) 0.18 - - - -

ILUMIEN III;

OPTIMIZE PCI, 2016

37)

RCT 140 135 140 Post-PCI MSA by OCT (efficacy)

5.79 (4.54–7.34)

5.49 (4.39–6.59)

5.89 (4.67–7.80)

OCT vs.

IVUS;

0.42

87.6 82.9 86.5 OCT vs.

IVUS;

0.77

OCT guidance resulted in a similar MSA to that of IVUS guidance OCT vs.

Angio;

0.12

OCT vs.

Angio;

0.02

DES = drug-eluting stent; DETECT-OCT = DETErmination of the Duration of the Dual Antiplatelet Therapy by the Degree of the Coverage of The Struts on Optical

Coherence Tomography; DOCTORS = Does Optical Coherence Tomography Optimize Results of Stenting; FFR = fractional flow reserve; IVUS = intravascular

ultrasound; MLA = minimal lumen area; MSA = minimal stent area; OCT = optical coherence tomography; OCTACS = Optical Coherence Tomography Guided

Percutaneous Coronary Intervention With Nobori Stent Implantation in Patients With Non–ST-Segment–Elevation Myocardial Infarction; PCI = percutaneous

coronary intervention; PS = polarization sensitive; RCT = randomized controlled trial.

(15)

According to the imaging outcomes of the OCT studies, the OCT-guided PCI had an equal or larger MSA stent expansion and better strut coverage at the follow-up as compared to the angio-guided PCI. 69)73) In contrast, the OCT-guided PCI had a smaller or equal MSA with a lower or similar incidence of major dissections and major malappositions as compared to the IVUS guided PCI.

OPTICAL COHERENCE TOMOGRAPHY-GUIDED

PERCUTANEOUS CORONARY INTERVENTION AND THE FRACTIONAL FLOW RESERVE

The relationship between the OCT-guided PCI and FFR has been evaluated in a few studies. In the DOCTORS study, 45) post-PCI OCT revealed that 42% of the patients had stent underexpansions and 32% of patients had stent malappositions, leading to a more frequent use of post-stent high-pressure dilatation in the OCT-guided PCI than angio-guided PCI (43% vs. 12.5%, p<0.001). Consequently, the OCT-guided group had a significantly higher FFR value than the anigo-guided group (0.94±0.04 vs. 0.92±0.05, p=0.005).

ILUMIEN I study, 77) and in contrast, the post-PCI OCT imaging revealed 14.5% rate of stent malappositions, 7.6% rate of stent underexpansions, and 2.7% rate of edge dissections.

Regardless of the OCT optimization sequences, the final FFR values did not show any significant differences. These observations suggested that the effect of the OCT-guided PCI on the final FFR value is not clear yet.

CLINICAL OUTCOMES OF THE OPTICAL COHERENCE TOMOGRAPHY-GUIDED PERCUTANEOUS CORONARY INTERVENTION

Several OCT studies have addressed the clinical outcomes of the OCT-guided versus IVUS- guided PCI or OCT-guided versus IVUS-guided versus angio-guided PCI (Table 4). The ILUMIEN I 77) study reported that OCT-guided PCI (single arm) had a low MACE rate at 30 days (death, 0.25%; repeat PCI, 1.7%; and stent thrombosis, 0.25%). In a retrospective analysis of 670 patients in the CLI-OPCI study, 62) OCT-guided PCI was associated with improved outcomes compared to angio-guided PCI. In addition, a suboptimal OCT stent deployment was confirmed as an independent predictor of MACE at 12-months of follow-up (HR, 3.53;

95% confidence interval [CI], 2.2–5.8; p<0.001) in the CLI-OPCI II study. 46) In the Pan-London PCI registry, 78) a large national observation registry, the mortality of patients who underwent OCT-guidance was 7.7%, which was significantly lower than that of patients with either IVUS- guidance (12.2%) or angiography-guidance (15.7%; p<0.001). It was also significantly different from that of the patients in the elective (p<0.001) or emergent subgroup (p=0.002). Moreover, this difference remained significant after an adjustment (HR, 0.48; 95% CI, 0.26–0.81;

p=0.001) and propensity score matching (HR, 0.39; 95% CI, 0.21–0.77; p<0.001; OCT vs.

angiography-guidance). On the contrary, a total of 285 patients in the OCT-guided group and

1,547 patients in the angio-guided group were enrolled in the FORMIDABLE-CARDIOGROUP

IV and USZ Registry, 79) resulting in 270 patients for each cohort after propensity score

matching. After a follow-up of 700 days, there was no significant difference in the risk of

an MI, target vessel revascularization, or stent thrombosis between the two groups. In the

(16)

OPINION trial, target vessel failures occurred in 5.2% of 401 patients undergoing an OCT- guided PCI and in 4.9% of 390 patients undergoing an IVUS-guided PCI, demonstrating the non-inferiority of the OCT-guided PCI to the IVUS-guided PCI over 1 year (HR, 1.07; the upper limit of one-sided 95% CI, 1.80; P non-inferiority =0.042). 38)76) Our retrospective study also reported a one-year cumulative incidence of MACE in those who underwent a second-generation DES implantation under OCT (122 patients) or IVUS (168 patients) guidance. In adjusted comparisons between the OCT-guided and IVUS-guided PCI groups, there was no significant difference in the rate of MACE or ST at 1-year follow-up. 80) In the ILUMIEN III 37) trial, the procedural MACE rate did not significantly differ among these three groups: four (3%) of 158 patients in the OCT-guided group, one (1%) of 146 in the IVUS-guided group, and one (1%) of 146 in the angio-guided group (OCT vs. IVUS, p=0.37; OCT vs. angiography, p=0.37). Taken together, the OCT-guided PCI was at least non-inferior or superior to the angio-guided PCI and non-inferior to the IVUS-guided PCI in terms of the mid-term clinical outcomes.

Table 4. Comparison of the OCT studies for the clinical outcome Study/first

author, year Design Number Duration

(months) Endpoint MACE Key findings

OCT Angio IVUS Cardiac death MI TLR TVR ST

CLI-OPCI,

2012

62)

Matched

patients 335 335 - 12 CD or MI OCT; 1.2% vs.

Angio; 4.5%

(p=0.010)

OCT; 5.4% vs.

Angio; 8.7%

(p=0.096)

Composite of CD, MI or RR;

9.6% vs. 13.0%

(p=0.006)

- - OCT guidance was

associated with a significantly lower rate of clinical events at 1-year (1year CD) (CD or MI)

OPNION, 2016

38)

RCT 412 - 405 12 TVF

(composite of CD, target- vessel MI, ischemia- driven TVR)

OCT; 0.0% vs.

IVUS; 0.2%

(p=0.99)

OCT; 0.5% vs.

IVUS; 0.7%

(p=0.98)

OCT; 2.7% vs.

IVUS; 3.0%

(p=0.97)

OCT; 4.9% vs.

IVUS; 4.2%

(p=0.78)

OCT; 0.2% vs.

IVUS; 0.5%

(p=0.99)

OCT guidance was non-inferior to IVUS guidance regarding the clinical outcome at 1-year

ILUMIEN III;

OPTIMIZE PCI, 2016

37)

RCT 158 143 140 1 Post-PCI

MSA by OCT (efficacy)

All cause

death Target vessel

MI ID-TLR - OCT; 1.0% vs.

IVUS; 0.0% vs.

Angio; 0.0%

OCT guidance was safe and resulted in a similar MSA to that of IVUS guidance Procedureal

MACE (safety)

OCT; 0.0% vs.

IVUS; 0.0% vs.

Angio; 0.0%

OCT; 1.0% vs.

IVUS; 1.0% vs.

Angio; 0.0%

OCT; 1.0% vs.

IVUS; 0.0% vs.

Angio; 1.0%

FORMIDABLE- CARDIOGROUP IV and USZ Registry, 2017

79)

PSM analysis 270 270 - 24 Number of

stent used (primary), MACE (secondary)

All cause death OCT; 6.0% vs.

Angio; 6.0%

(p=0.86)

OCT; 2.0% vs.

Angio; 3.0%

(p=0.92)

OCT; 2.0% vs.

Angio; 4.0%

(p=0.15)

OCT; 0.0% vs.

Angio; 2.7%

(p=0.26)

OCT guidance reduced the number of stents used, but there was no statistically significant difference in the clinical outcomes OCT; 3.0% vs.

Angio; 4.0%

(p=0.15)

DETECT-OCT, 2018

73)

RCT 320 459 - 3 The

difference in early strut coverage

3-month DAPT;

0.0% vs.

12-month DAPT;

0.0% (p=NA)

3-month DAPT;

0.3% vs.

12-month DAPT;

0.0% (p=0.41)

- 3-month

DAPT; 0.6%

vs. 12-month DAPT; 0.4%

(p=0.72)

3-month DAPT;

0.3% vs.

12-month DAPT;

0.0% (p=0.41)

OCT guidance reduced the percent of uncovered and malapposed struts.

Short-term DAPT may be feasible in selected patients with a favorable early strut coverage Pan-London

PCI, 2018

78)

Observational cohort

1,149 75,046 10,971 58 (median)

All causes of mortality

All cause death Q wave-MI - - - OCT guidance was

associated with an improved clinical outcome OCT; 0.3% vs.

IVUS; 0.4% vs.

Angio; 0.7%

(p=0.010)

OCT; 0.2% vs.

IVUS; 0.5% vs.

Angio; 0.7%

(p=0.046)

CD = cardiac death; CLI-OPCI = Centro per la Lotta Contro L'Infarto-Optimization of Percutaneous Coronary Intervention; DAPT = dual antiplatelet therapy;

DETECT-OCT = DETErmination of the Duration of the Dual Antiplatelet Therapy by the Degree of the Coverage of The Struts on Optical Coherence Tomography;

ILUMIEN = Observational Study of Optical Coherence Tomography in Patients Undergoing Fractional Flow Reserve and Percutaneous Coronary Intervention;

IVUS = intravascular ultrasound; MACE = major adverse cardiovascular event; MI = myocardial infarction; MSA = minimal stent area; OCT = optical coherence

tomography; OPINION = Optical Frequency Domain Imaging vs. Intravascular Ultrasound in Percutaneous Coronary Intervention; PCI = percutaneous coronary

intervention; PSM = propensity-score matching; RCT = randomized control trial; RR = repeat revascularization; ST = stent thrombosis; TLR = target lesion

revascularization; TVF = target vessel failure; TVR = target vessel revascularization.

(17)

LIMITATIONS OF OPTICAL COHERENCE TOMOGRAPHY

The current OCT technology has several limitations. Since its penetration power (1 to 2 mm) has a lower depth than IVUS (8 to 10 mm), the plaque volume and morphology of plaques in the deep layers of the vessel wall might be invisible by OCT. In addition, it might be difficult to differentiate calcifications from lipid-rich lesions, especially when there is a large plaque burden. As noted above, under certain circumstances, signal attenuation by lipidic plaques can lead to an ambiguous EEL and preclude the EEL-based stent sizing. In addition, the analysis of the structures below a red thrombus is limited by a high signal attenuation that can cast a shadow on the vessel wall. To make the correct interpretation of the OCT images, several types of artifact due to the light propagation, OCT catheter location and movement, and artifact associated with stents need to be considered. 81) In the case of renal dysfunction, contrast should be used discreetly. Although dextran can be used in OCT as an alternative flush material, it is not recommended for patients with chronic renal insufficiency. 82) Lastly, two-dimensional OCT imaging has limitations, particularly for bifurcation lesions during the PCI and for evaluating stent deformations and fractures. To mitigate these limitations, a three-dimensional analysis is promising. 83)84)

UPCOMING STUDIES

Although the concept of OCT-guided PCI has been well established, data on its clinical impact are still lacking. Compared to angio-guided PCI or IVUS-guided PCI, a few studies have shown a positive signal in OCT-guided PCI, but not other studies. Therefore, further investigation is inevitable to evaluate whether the OCT-guided PCI can improve the clinical outcomes, especially for complex lesions. Recently, two Korean studies on OCT-guided PCI are ongoing to evaluate their clinical effects. The Optical CoherenCe Tomography-gUided Coronary Intervention in Patients With Complex lesIons (OCCUPI) trial is a prospective, multicenter, randomized study to prove the superiority of OCT-guided PCI for the clinical outcome as compared to angio-guided PCI for complex lesions. The Optical Coherence Tomography Versus Intravascular Ultrasound Guided Percutaneous Coronary Intervention (OCTIVUS) trial (NCT03394079) is a prospective, open-label, multicenter, dual arm, and randomized trial to establish that OCT-guided PCI is non-inferior to IVUS-guided PCI regarding target vessel failures at 1 year. On the other hand, the ILUMIEN IV trial (NCT03507777) is a prospective, multinational, multicenter, superiority designed, single- blind clinical trial that randomizes subjects to OCT-guided versus angio-guided coronary stent implantations with high-risk clinical characteristics and/or with high-risk angiographic lesions. The objective of this clinical trial is to demonstrate that OCT-guided PCI can achieve larger post-PCI lumen dimensions and improve the clinical cardiovascular outcomes. The results of these studies are expected to reveal the effect of IVUS and OCT on the clinical outcome of contemporary DES implantations in an environment close to the real world of an elective PCI.

CONCLUSIONS

With the technical development of OCT systems, the use of OCT during PCI has been rapidly

increasing in daily practice. Similar to IVUS, OCT provides quantitative and qualitative

information on the inside of the vessel wall before the PCI as well as the stent optimization

수치

Figure 1. A representative case demonstrating a discrepancy between coronary angiography and OCT
Table 1. Summary of the absolute and relative stent expansion criteria for stent optimization (data from IVUS and OCT studies)
Figure 2. A representative case of an OCT-guided PCI (stent sizing and post-stent optimization)
Figure 3. Stepwise procedure for the stent optimization under OCT guidance.
+6

참조

관련 문서

MP Yousef Al-Fadalah, Supervisor of Parliament Business Environment Committee declared that the Public Institution for Housing Care intends to dedicate nearly 150

The main objective of the Bi Regional Center for SMES Development is oriented towards generating the conditions of cooperation among the countries which

Current Tokyo is rich in green compared to other metro cities. In some parts, the greenery has been contributed by the many inherited gardens from the Edo era to today which

In a statement to Kuwait News Agency (KUNA) on the sidelines of a meeting of the Arab Parliament's Foreign Affairs Political and National Security

The meeting was attended by Assistant Foreign Minister for GCC Affairs, Ambassador, Nasser Al-Muzayyen, and Deputy Assistant Foreign Minister for the Office of the

“ Sheikh Nasser has a written message from HH the Amir, Sheikh Sabah Al-Ahmad Al-Jaber Al-Sabah to the Chinese President, Chi Gen Beng related to enhancing mutual

On his part, CEO of Express Roads Authority, Saud Al-Naqqi said that the heavy rains of the previous day led to clogging parts of the express

Kuwait will celebrate on Sunday the fourth anniversary of the UN honoring and proclamation of His Highness the Amir, Sheikh Sabah Al-Ahmad Al-Jaber Al-Sabah as