Diagnostic Accuracy of the Quidel Sofia Rapid Influenza Fluorescent Immunoassay in Patients with Influenza-like Illness:
A Systematic Review and Meta-analysis
Jonghoo Lee, M.D., Ph.D.
1,* , Jae-Uk Song, M.D., Ph.D.
2,* and Yee Hyung Kim, M.D., Ph.D.
31
Department of Internal Medicine, Jeju National University Hospital, Jeju National University School of Medicine, Jeju,
2Division of Pulmonary and Critical Care Medicine, Department of Internal Medicine, Kangbuk Samsung Hospital, Sungkyunkwan University School of Medicine, Seoul,
3Department of Pulmonary and Critical Care Medicine, Kyung Hee University Hospital at Gangdong, Kyung Hee University School of Medicine, Seoul, Republic of Korea
Background: Although the Quidel Sofia rapid influenza fluorescent immunoassay (FIA) is widely used to identify influenza A and B, the diagnostic accuracy of this test remains unclear. Thus, the objective of this study was to determine the diagnostic performance of this test compared to reverse transcriptase-polymerase chain reaction.
Methods: A systematic literature search was performed using MEDLINE, EMBASE, and the Cochrane Central Register.
Pooled sensitivity, specificity, diagnostic odds ratio (DOR), and a hierarchical summary receiver-operating characteristic curve (HSROC) of this test for identifying influenza A and B were determined using meta-analysis. A sensitivity subgroup analysis was performed to identify potential sources of heterogeneity within selected studies.
Results: We identified 17 studies involving 8,334 patients. Pooled sensitivity, specificity, and DOR of the Quidel Sofia rapid influenza FIA for identifying influenza A were 0.78 (95% confidence interval [CI], 0.71–0.83), 0.99 (95% CI, 0.98–
0.99), and 251.26 (95% CI, 139.39–452.89), respectively. Pooled sensitivity, specificity, and DOR of this test for identifying influenza B were 0.72 (95% CI, 0.60–0.82), 0.98 (95% CI, 0.96–0.99), and 140.20 (95% CI, 55.92–351.54), respectively. The area under the HSROC for this test for identifying influenza A was similar to that for identifying influenza B. Age was considered a probable source of heterogeneity.
Conclusion: Pooled sensitivities of the Quidel Sofia rapid influenza FIA for identifying influenza A and B did not quite meet the target level (≥80%). Thus, caution is needed when interpreting data of this study due to substantial between- study heterogeneity.
Keywords: Influenza, Human; Diagnosis; Point-of-Care Testing; Fluorescence Polarization Immunoassay
Address for correspondence: Jonghoo Lee, M.D., Ph.D.
Department of Internal Medicine, Jeju National University Hospital, Jeju National University School of Medicine, Aran 13 gil 15, Jeju 63241, Republic of Korea
Phone: 82-64-717-1601, Fax: 82-64-717-1131, E-mail: [email protected]
*These authors contributed equally to this work.
Received: Feb. 24, 2021, Revised: Apr. 4, 2021, Accepted: May. 3, 2021, Published online: May. 13, 2021
cc It is identical to the Creative Commons Attribution Non-Commercial License (http://creativecommons.org/licenses/by-nc/4.0/).
Copyright © 2021
The Korean Academy of Tuberculosis and Respiratory Diseases.
Introduction
Influenza, an acute respiratory viral infection caused by influenza A or B virus, occurs mainly in the winter months throughout the world. It causes significant morbidity and mortality worldwide
1,2. Adequate antiviral therapy can shorten the time of illness and reduce the duration of hospitalization and the risk of complications from influenza infections
3. Clini- cal benefit of antiviral therapy is the greatest when it is started soon after the onset of influenza illness
4. Therefore, rapid and accurate diagnosis of influenza infection is necessary in clini- cal practice.
Although polymerase chain reaction (PCR) has been used as the reference standard for diagnosing viral infections, per- forming PCR is relatively expensive. In addition, it requires technical expertise
5. Alternatively, point-of-care rapid influ- enza diagnostic tests (RIDTs) can detect viral antigens by im- munoassay and provide quick results within 30 minutes. They can facilitate antiviral therapy, reduce additional diagnostic tests and hospitalization therapy, and induce appropriate infection control measures
6,7. A recent systematic review and meta-analysis for 162 diagnostic accuracy studies of RIDTs has revealed that traditional RIDTs have specificities higher than 98% with poor sensitivities (54.4% for influenza A and 53.2% for influenza B)
5. Two classes of RIDTs, automated immunochromatographic antigen detection tests (digital im- munoassays [DIAs]) and rapid nucleic acid amplification tests (NAATs), have been used since 2011
5. Pooled sensitivities for DIAs (80.0% for influenza A and 76.8% for influenza B) and rapid NAATs (91.6% for influenza A and 95.4% for influenza B) are significantly higher than those for traditional RIDTs
5.
As a type of DIA, the Quidel Sofia rapid influenza fluores- cent immunoassay (FIA) (Quidel Corp., San Diego, CA, USA) is a point-of-care test to detect influenza A and B in less than 15 minutes using a compact instrument (Sofia analyzer). Al- though the performance characteristics of this test to detect seasonal influenza virus strains have been established, the diagnostic accuracy of the Quidel Sofia rapid influenza FIA is not yet fully known. Thus, the objective of this systematic re- view and meta-analysis of clinical trial data was to investigate diagnostic properties of the Quidel Sofia rapid influenza FIA in patients with influenza like illness.
Materials and Methods
1. Data sources and search strategy
This meta-analysis is reported in accordance with the Preferred Reporting Items for Systematic reviews and Meta- Analyses of Diagnostic Test Accuracy Studies statement
8. A comprehensive search of three electronic databases (MED- LINE, EMBASE, and the Cochrane Central Register) up to July
of 2020 was performed. Search terms for influenza included
“Influenza, Human” [MeSh] OR “Influenza A virus” OR “In- fluenza B virus” OR “influenza” OR “flu”. Search terms for the tests included “rapid test*” OR “rapid diagnos*” OR “point-of- care test*” OR “immunoassay*” OR “immunochromatographic test*” OR “influenza FIA” OR “Quidel Sofia Influenza” OR “Rapid Detection Flu”. As this study was a systematic review of pub- lished articles, neither informed consent nor ethics approval was required. A manual search of references listed in relevant review articles was also conducted.
2. Study selection
We included studies that met the following inclusion crite- ria: (1) full-length reports published in peer-reviewed English language journals; (2) studies that evaluated the performance of the Quidel Sofia rapid influenza FIA, compared to a refer- ence standard; (3) studies that included patients with influ- enza-like illness; and (4) studies that provided sufficient data to calculate absolute numbers of true-positive, false-positive, false-negative, and true-negative results. Review articles, case reports, commentaries, and studies reporting outcomes with- out raw data or peer review were excluded. Demographics and underlying diseases of participants were not restricted.
Influenza-like illness was defined as fever ≥38°C and any signs/symptoms of respiratory tract infection (e.g., cough, spu- tum, sore throat, wheezing, etc.). We allowed the followings as specimens: nasopharyngeal aspirates, swabs, or washes;
nasal aspirates, swabs, or washes; saliva; and throat swabs. A reference standard was either a commercial reverse transcrip- tase–polymerase chain reaction (RT-PCR) or a laboratory- developed RT-PCR.
3. Data extraction and quality assessment
Two authors independently reviewed potentially relevant
studies and each study according to predefined eligibility cri-
teria, after which data were extracted. Any disagreements that
arose during the process of study selection or data extraction
were resolved by discussion. A predefined form was used to
extract data from each study. The following data from each
study included in the meta-analysis were extracted: author,
year of publication, study design, place of study, number of
participants, age, proportion of children, sex, study period,
type of reference standard, type of specimens, and type of
population. As recommended by the Cochrane Collabora-
tion, the Quality Assessment of Diagnostic Accuracy Studies
(QUADAS)-2 tool was used to assess the risk of bias in diag-
nostic test accuracy
9. Discrepancies were resolved by consen-
sus between the two authors.
4. Data synthesis and statistical analysis
For diagnostic meta-analysis, random effects meta-analyses were performed to generate pooled estimates with 95% con- fidence intervals (CIs). Numbers of patients were extracted with true-positive, false-positive, false-negative, and true nega- tive test results either directly or indirectly through a recalcula- tion based on reported measures of accuracy in combination with the prevalence and sample size of the included study.
Pooled sensitivity and specificity, positive likelihood ratio (PLR), negative likelihood ratio (NLR), diagnostic odds ratio (DOR), and area under the receiver-operating characteristic curve (AUC) were calculated as pooled estimates with a 95%
CI
10. Hierarchical summary receiver-operating characteristic curves (HSROCs) were also constructed. The heterogeneity was evaluated using the Higgins I
2statistics on a scale of 0–1.
An I
2>0.5 indicated a substantial level of between-study het- erogeneity. To assess effects of potential sources of heteroge- neity, subgroup analyses were performed using the following covariates to the model: study design (single vs. multicenter), number of participants (≥250 vs. <250), study period (influenza
vs. non-specific season), and study population (children vs.
adult). Pooled sensitivity and specificity estimates were calcu- lated for each covariate. To investigate the effect of study qual- ity, sensitivity analyses were performed. A p-value <0.05 was considered statistically significant. All statistical analyses were performed with Stata statistical software version 14.2 (Stata Corp LP, College Station, TX, USA) and Review Manager ver- sion 5.3 (Nordic Cochrane Centre, The Cochrane Collabora- tion, Copenhagen, Denmark).
Results
1. Study search, characteristics of included studies, and quality of included studies
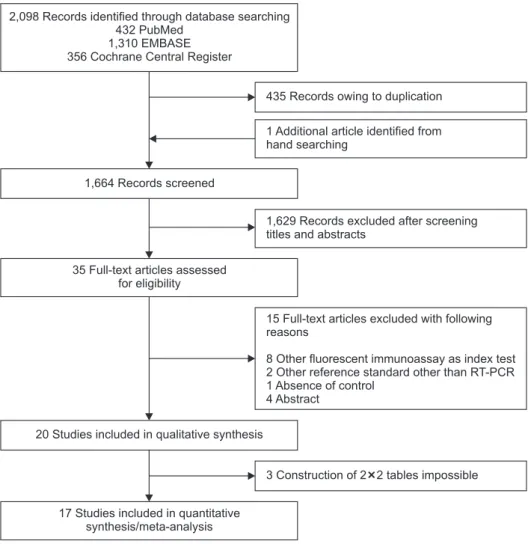
The literature search process is shown in Figure 1. Initially, 432 articles from PubMed, 1,310 articles from EMBASE, 356 articles from the Cochrane library, and an additional article from hand-searching were identified. After removing dupli- cate articles, 1,664 potentially eligible articles were screened.
15 Full-text articles excluded with following reasons
8 Other fluorescent immunoassay as index test 2 Other reference standard other than RT-PCR 1 Absence of control
4 Abstract
3 Construction of 2 2 tables impossible 1,629 Records excluded after screening titles and abstracts
435 Records owing to duplication
1 Additional article identified from hand searching
2,098 Records identified through database searching 432 PubMed
1,310 EMBASE 356 Cochrane Central Register
1,664 Records screened
35 Full-text articles assessed for eligibility
20 Studies included in qualitative synthesis
17 Studies included in quantitative synthesis/meta-analysis
Figure 1. Flow diagram showing the identification of eligible studies. RT-PCR:
reverse transcription polymerase chain
reaction.
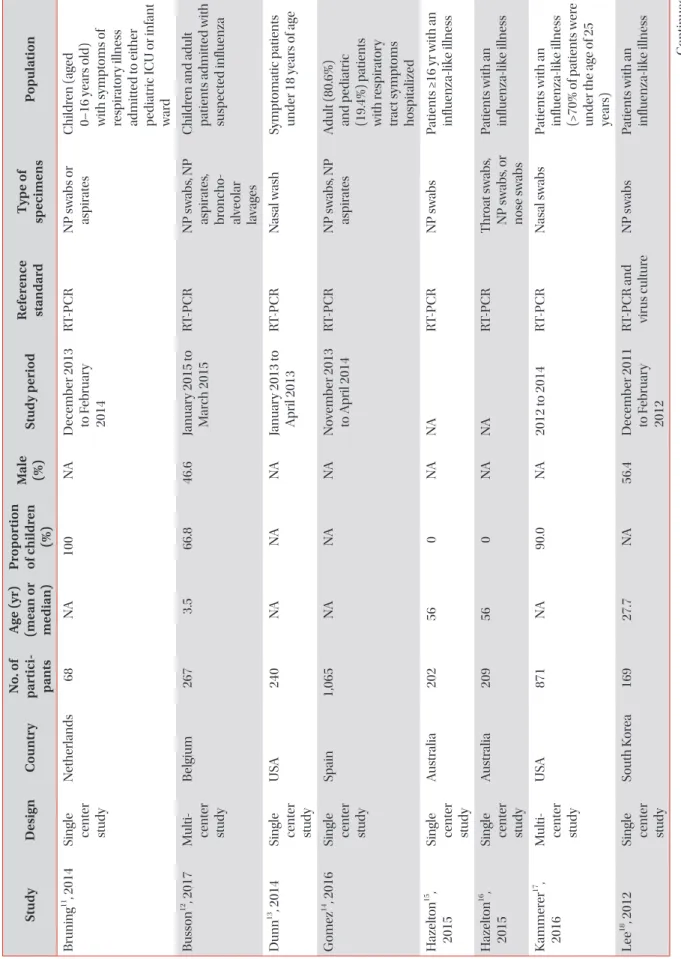
Ta ble 1. Ch ar act er is tic s of s tu d ie s in clu de d in th e m et a-an al ysis Stu dy D es ig n Co un tr y N o. of p ar tic i- p an ts A ge (yr) (m ean or m ed ian) Pr op or tion of childr en (%)
M ale (%) St u dy p er io d R efer en ce st an da rd T yp e of sp ec im ens P op ul ation Bruning
11, 2014 Single cent er stu dy
N ether lands 68 NA 100 NA D ecem ber 2013 to F ebruar y 2014
R T-P CR NP s w abs or as pir at es C hildr en (ag ed 0–16 ye ar s old) with s ympt oms of res pir at or y illnes s admit te d t o either pe di atric IC U or infant wa rd Bus son
12, 2017 M ulti- cent er stu dy
B elgium 267 3.5 66.8 46.6 Januar y 2015 t o M ar ch 2015 R T-P CR NP s w abs , NP as pir at es , br onc ho- alve ol ar lava ge s
C hildr en and adult patients admit te d with sus pe ct ed influenza Dunn
13, 2014 Single cent er stu dy
U SA 240 NA NA NA Januar y 2013 t o A pril 2013 R T-P CR N as al w ash Sympt omatic p atients under 18 ye ar s of ag e G ome z
14, 2016 Single cent er stu dy
Sp ain 1,065 NA NA NA N ovem ber 2013 to A pril 2014 R T-P CR NP s w abs , NP as pir at es A dult (80.6%) and p edi atric (19.4%) p atients with r es pir at or y tr act s ympt oms hos pitalize d H azelt on
15, 2015 Single cent er stu dy
A us tr ali a 202 56 0 NA NA R T-P CR NP s w abs Patients ≥16 yr with an influenza-lik e illnes s H azelt on
16, 2015 Single cent er stu dy A us tr ali a 209 56 0 NA NA R T-P CR T hr oat s w abs , NP s w abs , or nose s w abs
Patients with an influenza-lik e illnes s K ammer er
17, 2016 M ulti- cent er stu dy
U SA 871 NA 90.0 NA 2012 t o 2014 R T-P CR N as al s w abs Patients with an influenza-lik e illnes s (>70% of p atients wer e under the ag e of 25 ye ar s) Le e
18, 2012 Single cent er stu dy
South K or ea 169 27.7 NA 56.4 D ecem ber 2011 to F ebruar y 2012
R T-P CR and virus c ult ur e NP s w abs Patients with an influenza-lik e illnes s C ontinue d
Ta ble 1. Con tin u ed Stu dy D es ig n Co un tr y N o. of p ar tic i- p an ts A ge (yr) (m ean or m ed ian) Pr op or tion of childr en (%)
M ale (%) St u dy p er io d R efer en ce st an da rd T yp e of sp ec im ens P op ul ation Le onar di
19, 2013 Single cent er stu dy
U SA 141 NA 48.0 NA Influenza se asons fr om 2006 t o 2011 and the 2011–2012
R T-P CR NP s w abs Fr ozen original influenza- pos itive sp ecimens and pr os pe ctive sp ecimens Lew andr ows ki
20, 2013 M ulti- cent er stu dy
U SA 2,047 NA 93.1 52.9 NA R T-P CR or virus cult ur e N as al s w abs and NP s w abs or as pir at es
Patients with an influenza-lik e illnes s No h
21, 2015 M ulti- cent er stu dy
South K or ea 391 40 NA 37.6 D ecem ber 2012 to A pril 2013 R T-P CR NP s w abs A dult p atients with influenza-lik e illnes s Ry u
22, 2016 Single cent er stu dy
South K or ea 314 30.4 NA 51.9 Januar y 2014 t o Fe bruar y 2015 R T-P CR NP s w abs Patients showing influenza-lik e sympt oms Ry u
23, 2018 Single cent er stu dy
South K or ea 158 23.8 58.7 NA 2016 R T-P CR NP s w abs Patients with an influenza-lik e illnes s bet we en ne onat es and 90 ye ar s old Selove
24, 2016 Single cent er stu dy
U SA 1,649 57 15.3 50 Sept em ber 2014 to M ay 2015 R T-P CR N as al as pir at es Patients with an influenza-lik e illnes s Tut tle
25, 2015 Single cent er stu dy G erman y 686 3.5 for me an, 1.8 for me - di an
100 55 D ecem ber 2012 to A pril 2013 R T-P CR or virus cult ur e NP or nas al swa bs Patients ag ed 0–18 ye ar s with an influenza-lik e illnes s Yang
26, 2018 Single cent er stu dy
Taiw an 109 38.8 0 56.9 Januar y 2012 to D ecem ber 2013
R T-P CR and/or virus c ult ur e NP or thr oat swa bs Patients who pr esent ed at out -p atient c linics or the emer genc y dep artment with influenza-lik e illnes s Yo on
27, 2017 Single cent er stu dy
South K or ea 385 46 NA 46.5 D ecem ber 2014 to A pril 2015 R T-P CR NP s w abs or saliv a Patients with an influenza-lik e illnes s N A: not a vail able; R T-P CR : r ever se tr anscription p ol ymer ase c hain r eaction; IC U: int ens ive c ar e unit.
After reviewing titles and ab stracts, 1,629 search records were removed and the remaining 35 articles were eligible for full text reading. Fifteen articles were excluded for reasons shown in Figure 1. With quantitative synthesis, seventeen studies were included in our final analysis
11-27.
Features of included studies are summarized in Table 1. For influenza A, we identified 17 studies involving 8,334 partici- pants. For influenza B, sixteen studies involving 7,909 subjects met the defined inclusion criteria. One study assessed influ- enza A infection only
21. The number of patients in each trial ranged from 68 to 1,649. All studies were published between 2012 and 2018. Most studies evaluated combined populations of adults and children.
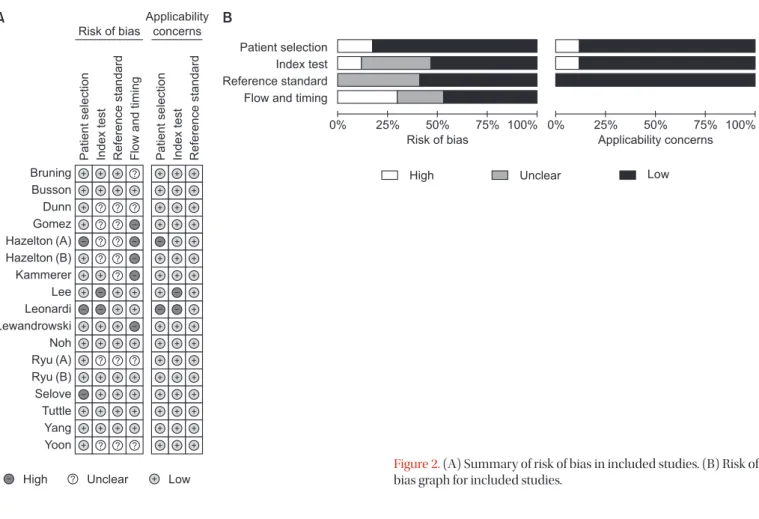
Results of the QUADAS-2 assessment are shown in Figure 2. For patient selection, the index test, and the reference stan- dard domain, more than 50% of included studies were judged to have a low risk of bias. However, for the study flow and the timing domain, the risk of bias was high or unclear for 52.9%
of the included studies because of unclear intervals between the index test and the reference standard. Considering our inclusion criteria, we had little concern for the applicability of results from selected studies for each domain.
2. Diagnostic accuracy of the Quidel Sofia rapid influenza FIA to identify influenza A and B
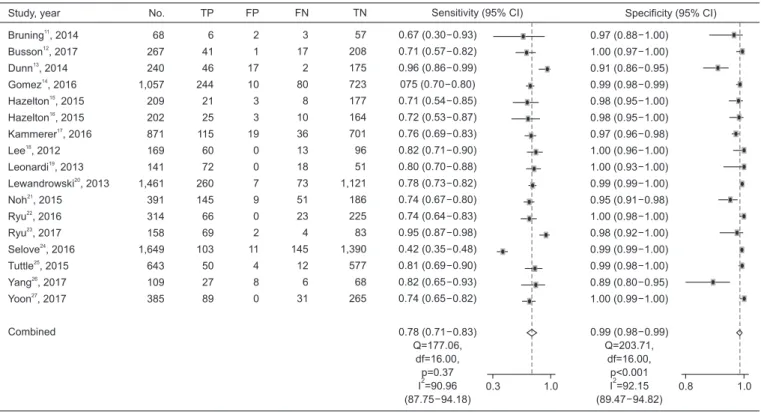
Figures 3 and 4 show paired forest plots of sensitivity and specificity of the Quidel Sofia rapid influenza FIA for detecting influenza A and B. The pooled sensitivity across studies of the Quidel Sofia rapid influenza FIA for identifying influenza A was 0.78 (95% CI, 0.71–0.83), with a pooled specificity of 0.99 (95% CI, 0.98–0.99). The pooled PLR and NLR were 56.99 (95%
CI, 31.87–101.90) and 0.23 (95% CI, 0.18–0.29), respectively.
The DOR for influenza A was 251.26 (95% CI, 139.39–452.89).
The pooled sensitivity across studies for identifying influ- enza B was 0.72 (95% CI, 0.60–0.82), with a pooled specificity of 0.98 (95% CI, 0.96–0.99). The pooled PLR and NLR were 40.08 (95% CI, 17.26–93.07) and 0.29 (95% CI, 0.19–0.42), respectively. The DOR for influenza B was 140.20 (95% CI, 55.92–351.54). The pooled sensitivity and specificity of the Quidel Sofia rapid influenza FIA for identifying influenza A and B were not significantly different (p=0.341 for sensitivity and p=0.206 for specificity). Figure 5 shows HSROCs for the index test. AUCs of the Quidel Sofia rapid influenza FIA for identifying influenza A and influenza B were similar (0.96 with 95% CI of 0.94–0.98 for influenza A vs. 0.95 with 95% CI of 0.92–0.96 for influenza B, p=0.166).
Figure 2. (A) Summary of risk of bias in included studies. (B) Risk of bias graph for included studies.
Patientselection Indextest Referencestandard Flowandtiming Bruning
Busson Dunn Gomez Hazelton (A) Hazelton (B) Kammerer Lee Leonardi Lewandrowski Noh Ryu (A) Ryu (B) Selove Tuttle Yang Yoon
Patientselection Indextest Referencestandard Risk of bias
Applicability concerns
High Unclear Low
Patient selection Index test Reference standard Flow and timing
0% 25% 50% 75% 100%
Risk of bias
High Unclear Low
0% 25% 50% 75% 100%
Applicability concerns
A B
Study, year Bruning , 2014 Busson , 2017 Dunn , 2014 Gomez , 2016 Hazelton , 2015 Hazelton , 2015 Kammerer , 2016 Lee , 2012 Leonardi , 2013 Lewandrowski , 2013 Ryu , 2016 Ryu , 2017 Selove , 2016 Tuttle , 2015 Yang , 2017 Yoon , 2017
Combined
11 12
13 14
15 16
17 18
19 20
22 23
24 25
26 27
No.
68 267 240 1,057 209 202 871 168 78 1,461 314 145 1,649 686 109 385
TP 4 6 51 8 2 4 92 56 22 211 85 55 18 64 5 22
FP 6 3 55 79 2 1 74 0 0 19 0 4 7 6 12 1
FN 6 5 1 8 4 8 45 16 5 34 18 5 30 25 2 7
TN 52 253 133 962 201 189 660 96 51 1,197 211 81 1,594 591 90 355
Sensitivity (95% CI) 0.40 (0.12 0.74) 0.55 (0.23 0.83) 0.98 (0.90 1.00) 0.50 (0.25 0.75) 0.33 (0.10 0.65) 0.33 (0.04 0.78) 0.67 (0.59 0.75) 0.78 (0.66 0.87) 0.81 (0.62 0.94) 0.86 (0.81 0.90) 0.83 (0.74 0.89) 0.92 (0.82 0.97) 0.38 (0.24 0.53) 0.72 (0.61 0.81) 0.71 (0.29 0.96) 0.76 (0.56 0.90)
0.72 (0.60 0.82) Q=116.12,
df=15.00, p<0.001 I =87.08 (81.82 92.34)
2 0.0 1.0 0.6 1.0
0.90 (0.79 0.96) 0.99 (0.97 1.00) 0.71 (0.64 0.77) 0.91 (0.92 0.94) 0.99 (0.97 1.00) 0.99 (0.96 1.00) 0.90 (0.88 0.92) 1.00 (0.96 1.00) 1.00 (0.93 1.00) 0.98 (0.98 0.99) 1.00 (0.98 1.00) 0.95 (0.88 0.99) 1.00 (0.99 1.00) 0.99 (0.98 1.00) 0.88 (0.80 0.94) 1.00 (0.98 1.00)
0.98 (0.96 0.99) Q=701.37,
df=15.00, p<0.001 I =97.86 (97.36 98.36)
2
Specificity (95% CI)
Figure 4. Paired forest plots of sensitivity and specificity of the Quidel Sofia rapid influenza fluorescent immunoassay for detecting influenza B.
TP: true positive; FP: false positive; FN: false negative; TN: true negative; CI: confidence interval.
Study, year Bruning , 2014 Busson , 2017 Dunn , 2014 Gomez , 2016 Hazelton , 2015 Hazelton , 2015 Kammerer , 2016 Lee , 2012 Leonardi , 2013 Lewandrowski , 2013 Noh , 2015 Ryu , 2016 Ryu , 2017 Selove , 2016 Tuttle , 2015 Yang , 2017 Yoon , 2017
Combined
11
12 13
14 15
16 17
18 19
20 21
22 23
24 25
26 27
No.
68 267 240 1,057 209 202 871 169 141 1,461 391 314 158 1,649 643 109 385
TP 6 41 46 244 21 25 115 60 72 260 145 66 69 103 50 27 89
FP 2 1 17 10 3 3 19 0 0 7 9 0 2 11 4 8 0
FN 3 17 2 80 8 10 36 13 18 73 51 23 4 145 12 6 31
TN 57 208 175 723 177 164 701 96 51 1,121 186 225 83 1,390 577 68 265
Sensitivity (95% CI) 0.67 (0.30 0.93) 0.71 (0.57 0.82) 0.96 (0.86 0.99) 075 (0.70 0.80) 0.71 (0.54 0.85) 0.72 (0.53 0.87) 0.76 (0.69 0.83) 0.82 (0.71 0.90) 0.80 (0.70 0.88) 0.78 (0.73 0.82) 0.74 (0.67 0.80) 0.74 (0.64 0.83) 0.95 (0.87 0.98) 0.42 (0.35 0.48) 0.81 (0.69 0.90) 0.82 (0.65 0.93) 0.74 (0.65 0.82)
0.78 (0.71 0.83) Q=177.06,
df=16.00, p=0.37 I =90.96 (87.75 94.18)
2 0.3 1.0 0.8 1.0
0.97 (0.88 1.00) 1.00 (0.97 1.00) 0.91 (0.86 0.95) 0.99 (0.98 0.99) 0.98 (0.95 1.00) 0.98 (0.95 1.00) 0.97 (0.96 0.98) 1.00 (0.96 1.00) 1.00 (0.93 1.00) 0.99 (0.99 1.00) 0.95 (0.91 0.98) 1.00 (0.98 1.00) 0.98 (0.92 1.00) 0.99 (0.99 1.00) 0.99 (0.98 1.00) 0.89 (0.80 0.95) 1.00 (0.99 1.00)
0.99 (0.98 0.99) Q=203.71,
df=16.00, p<0.001 I =92.15 (89.47 94.82)
2
Specificity (95% CI)
Figure 3. Paired forest plots of sensitivity and specificity of the Quidel Sofia rapid influenza fluorescent immunoassay for detecting influenza A.
TP: true positive; FP: false positive; FN: false negative; TN: true negative; CI: confidence interval.
3. Subgroup and sensitivity analyses for the Quidel Sofia rapid influenza FIA to identify influenza A and B
The Higgins I
2statistics proved significant heterogeneity for both the sensitivity (0.91 with 95% CI of 0.88–0.94 for influen- za A and 0.87 with 95% CI of 0.82–0.92 for influenza B) (Figure 3) and specificity (0.92 with 95% CI of 0.90–0.95 for influenza A and 0.98 with 95% CI of 0.97–0.98 for influenza B) (Figure 4).
Subgroup analyses were also performed to investigate poten- tial sources of heterogeneity (Table 2). The sensitivity of the Quidel Sofia rapid influenza FIA was significantly increased when tests were performed in children (0.86 with 95% CI of 0.78–0.92 for influenza A and 0.79 with 95% CI of 0.71–0.85 for influenza B) than when tests were performed in adults (0.74 with 95% CI of 0.67–0.79 for influenza A and 0.33 with 95% CI of 0.10–0.65 for influenza B).
In sensitivity analysis to investigate the influence of each individual study on the overall analysis estimate, one study had a significantly different sensitivity than other studies on influenza A
24. Even after exclusion of that study
24, the pooled sensitivity across studies on influenza A was similar to that of overall studies (0.79 with 95% CI of 0.75–0.82). Instead, the heterogeneity decreased (0.51 with 95% CI of 0.23–0.79).
Discussion
According to the rule set by the Food and Drug Adminis- tration (FDA), RIDTs for influenza A and B are required to have a sensitivity of at least 80% and a specificity of at least 95% compared to an FDA-cleared nucleic acid based-test or other currently appropriate tests and FDA accepted compara- tor methods other than a correctly performed viral culture method
28. A recent systematic review and meta-analysis per- formed a search up to May 2017 and compared accuracies of traditional RIDTs, rapid NAATs, and DIAs in patients with sus-
pected influenza
5. For diagnosis of influenza A and B, pooled sensitivities of DIAs and the Quidel Sofia rapid influenza FIA were 80.0% and 76.8%, respectively
5. In the present study, compared to RT-PCR, the pooled sensitivity of the Quidel So- fia rapid influenza FIA to identify influenza A and B were 78%
and 72%, respectively. Our findings did not quite reach the target level of sensitivity required by the FDA. Therefore, some patients with negative results on the Quidel Sofia rapid influ- enza FIA might still need be confirmed to have an influenza infection by an alternative diagnostic method that is more sensitive.
Influenza type could affect the accuracy of RIDTs. A previ- ous meta-analysis has revealed that overall RIDTs show an increased sensitivity for detecting influenza A than for detect- ing influenza B (64.6% vs. 52.2%; p=0.05)
29. Influenza A virus can cause more severe disease, higher influenza-associated hospitalization, and more death than influenza B virus
29. Higher virulence of influenza A might lead to higher viral bur- den, which can result in a relatively higher sensitivity
19. In the present study, although the pooled sensitivity of the Quidel Sofia rapid influenza FIA for identifying influenza A tended to be higher than that for identifying influenza B, the difference between the two was not statistically significant.
The type of specimen might also lead to difference in diag- nostic performances. Although we tried to perform subgroup analyses according to specimens, we could only find two suitable studies
26,27. One study compared the results of test- ing throat and NP swabs specimens
26. The sensitivity for each type of specimens was 72% and 100% for detecting influenza A and 71% and 100% for detecting influenza B, respectively
26. In the other study, sensitivities of the Quidel Sofia rapid in- fluenza FIA with saliva specimens were comparable to those with NP swabs specimens
27. The sensitivity of the test with NP swabs samples was significantly higher than that with saliva samples for detecting influenza A (74.2% vs. 59.2%, p=0.014) and similar between two samples in influenza B (75.9% vs.
65.5%, p=0.387)
27. Based on results of these two studies regard-
0.0 1.0
0.8
0.6
0.4
0.2
0.0
Sensitivity
Specificity
1.0 0.8 0.6 0.4 0.2
Observed data Summary operating point Sensitivity=0.78 (0.71 0.83) Specificity=0.99 (0.98 0.99) HSROC curve
AUC=0.96 (0.94 0.98) 95% Confidence contour 95% Prediction contour
0.0 1.0
0.8
0.6
0.4
0.2
0.0
Sensitivity
Specificity
1.0 0.8 0.6 0.4 0.2
Observed data Summary operating point S =0.72 (0.60 0.82) S =0.98 (0.96 0.99)
ensitivity pecificity HSROC curve AUC=0.95 (0.92 0.96) 95% Confidence contour 95% Prediction contour