• 검색 결과가 없습니다.

Job Stress of Mobile Communication Network Construction Workers

N/A
N/A
Protected

Academic year: 2021

Share "Job Stress of Mobile Communication Network Construction Workers"

Copied!
13
0
0

로드 중.... (전체 텍스트 보기)

전체 글

(1)

JESK J Ergon Soc Korea 2015; 34(6): 549-561 http://dx.doi.org/10.5143/JESK.2015.34.6.549 http://jesk.or.kr eISSN:2093-8462

Job Stress of Mobile Communication Network Construction Workers

Dong-Gu Lee

1

, Hoon-Yong Yoon

2

1

LG Communication Mobile Network, Busan, 49409

2

Department of Industrial & Management Systems Engineering, Dong-A University, Busan, 49315

Corresponding Author Hoon-Yong Yoon

Department of Industrial & Management Systems Engineering, Dong-A University, Busan, 49315

Mobile : +82-10-2369-9535 Email : [email protected]

Received : July 17, 2015 Revised : July 31, 2015 Accepted : October 12, 2015

Copyright@2015 by Ergonomics Society of Korea. All right reserved.

ccThis is an open-access article distributed under the terms of the Creative Commons Attribution Non-Commercial License (http://

creativecommons.org/licenses/by-nc/3.0/), which permits unrestricted non-commercial use, distribution, and reproduction in any medium, provided the original work is properly cited.

Objective: The purpose of this study was to investigate the job stress factors of mobile communication network construction workers using survey based on 'Job stress factors evaluation tool for Koreans' that was developed by KOSHA in 2003.

Background: Due to the rapid growth of penetration rate of smartphone, the necessity of LTE service changing from 3G network was brought up. The demand of LTE network construction in a short period of time leads to the aggravation of the job stress of mobile communication network construction workers.

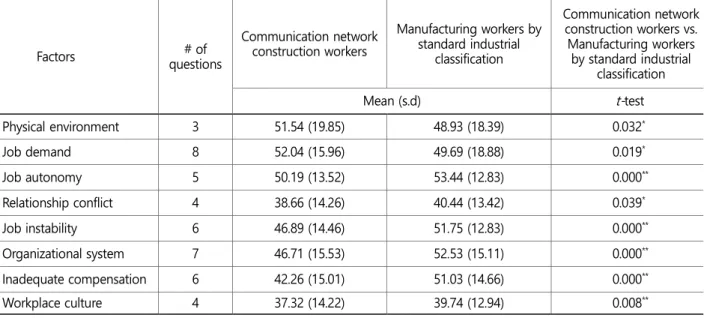
Method: Two hundred and fifty workers who were in the mobile communication network industry participated in this study, and among them 206 responses were analyzed for this study due to the unreliability and insincerity of responses. The eight job stress factors which are physical environment, job demand, job autonomy, relation conflict, job instability, organizational system, inadequate compensation, workplace culture were analyzed.

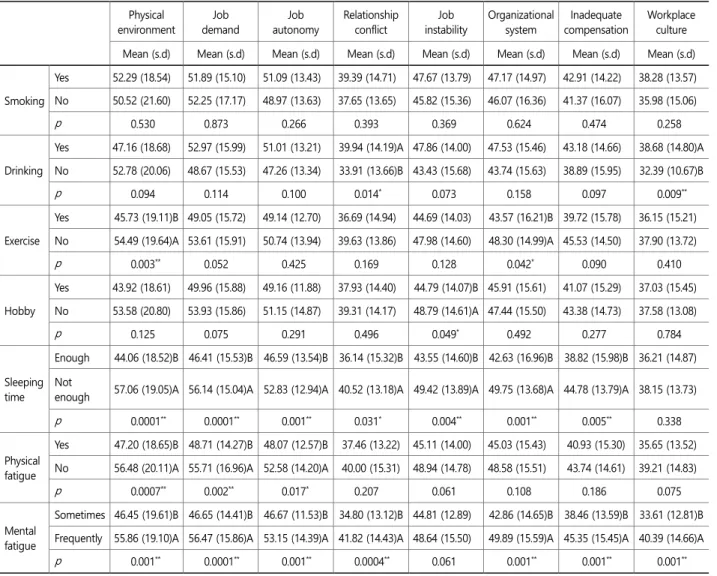
Results: The job stress factors of mobile communication network construction workers were compared to those of other industry workers, and other work related characteristics were analyzed. The results showed that the stress level of a physical environment and job requirement were relatively higher than those of manufacturing industry workers, meaning that mobile communication network construction workers have rough working conditions and increased amount of work due to the demand of LTE network construction. The stress level of physical environment for outdoor job workers was relatively higher than that of indoor job workers. With the analytical result for level of job satisfaction, significant difference was observed ( p <0.05) with every factor, and the job stress was found the highest with those not satisfied with every factor

Conclusion: From the results of this study, the work loss due to the job stress could be prevented, and accurate stress factors could be removed at the workplace.

Application: The results of this study may not represent the whole mobile network construction workers, the effort for job stress management is needed to improve the work efficiency and the workers' quality of life.

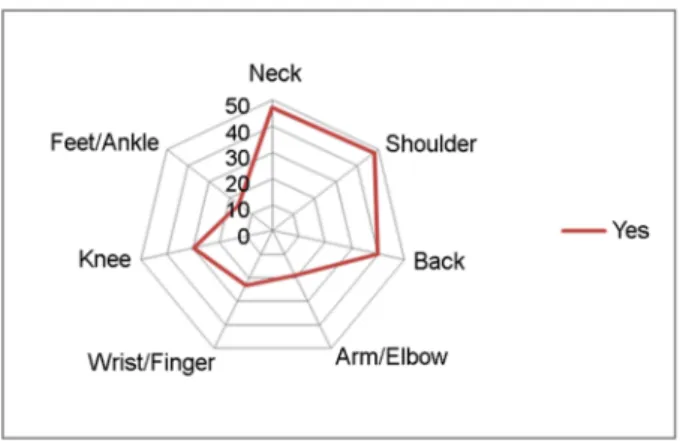
Keywords: Job stress, Mobile communication network construction workers, Body part discomfort

1. Introduction

The mobile communication industry enables information exchange through the use

(2)

of electromagnetic wave. The industry also enables people to overcome the spatial restrictions of wire communication using limited electromagnetic wave resources, and enables to exchange information with anyone anywhere, anytime. The mobile communication industry is a capital-intensive equipment industry requiring large scale facility investment such as the construction of exchange stations or base stations.

Korea's mobile communication technology offers new services to subscribers in every eight years, and the need to convert 3G network service to LTE (long term evolution) service emerged urgently, due to the data speed limit of 3G network. The reason is that the penetration of smartphones rapidly grew, and the construction of LTE network in a short period of time has become more necessary. The job stress that mobile communication network construction workers can have becomes more severe. Because they need to construct wireless and wire network construction in and outside of buildings using various parts of human body, operate relevant equipment, and carry out various types of work aboveground and underground installation work in view of the work-related characteristics, there are diverse types of work burdening human body parts. Therefore, those workers complain pain on neck, shoulder, back, arm, wrist, knee and foot/ankle, and they have a huge risk that such a pain can be linked with musculoskeletal disorders. Since the job stress and burden on body may affect the stable service of mobile communication network construction and work safety, they need to be examined and analyzed, and should be prevented.

NIOSH (1999) defined job stress as harmful physical and emotional response generated, when job requirements do not match worker's ability, resources and demand. Job stress-related diseases emerge as a major factor of industrial accidents. Concerning the previous studies on job stress conducted in Korea, they have been slightly concentrated on specific fields (teachers, nurses, office workers and production workers). However, in the study of job stress and social and psychological health state of communication industry workers by Park et al. (2005), 18 people or 3% of the 470 people survey subjects were surveyed as a healthy group, 135 people or 28% as a stress risk group, and the remaining 371 people or 67% as a potential stress group. Partial correlations between job stress and social and psychological stress were revealed according to job characteristics, health-related characteristics and personality characteristics.

In 2003 and 2004, the Korea Occupational Safety and Health Agency and Occupational Safety and Health Research Institute developed the Job stress factors evaluation tool for Koreans suitable for Korean organizational structure and cultural characteristics through two times of research. According to this evaluation tool, job stress factors are divided into physical environment, job demand, job autonomy, relation conflict, job instability, organizational system, inadequate compensation and workplace culture.

The institute reports that job stress is caused by the factors within such categories, and that diseases, disease burden and economic loss are caused in relation with job stress. The job stress evaluation tool for Koreans was used in many previous studies. In a study of Lee (2001), "The effects of job stress on industrial accidents", the job stress centered on workers in the construction and manufacturing industries was used to analyze the effects of job stress on industrial accidents. According to a study on job stress of workers in the distribution industry by Yoon et al. (2008), their job autonomy was lower than the workers in other industries, and they received more job stress than other industries. In the analysis of Yoon et al. (2010) on job stress of workers in the airplane complex parts manufacturing industry, they compared the workers in the manufacturing industry and those in the airplane complex parts manufacturing industry in terms of the job standard classification, and the study results have been used to analyze job stress by characteristics. In a study of Jung (2006) on relationship between job stress of subway engine drivers and musculoskeletal disorders and mental nervous disease, and a study of Song et al. (2007) on job stress of airplane mechanics, the job stress factors evaluation tool for Koreans was used for analysis.

This study identifies the factors causing job stress of network communication construction workers using the investigation chart

of job stress factors evaluation tool for Koreans, analyzes differences according to the characteristics, examines job stress factors,

and tries to help in devising measures to prevent the effects of job stress factors on individuals and organizations. This study

examined discomfort of each body part including neck, shoulder, back, arm/elbow, finger/wrist, knee, foot/ankle according to

(3)

individual characteristics of the mobile communication network construction workers. Through the results, this study aims to be helpful to the prevention of pain on each body part and musculoskeletal disorders.

2. Method

2.1 Subjects and period of study

This study performed a questionnaire survey targeting 250 mobile communication network construction workers of L Company, one of the Korea's communication carriers. In view of work characteristics, the ratio of women is very low, and therefore this study targeted only men. The survey period was for about four months from March 2012 to July 2012. Among 250 survey subjects, 206 questionnaire responses, excluding no responses and insincere responses (Respondents, whose reliability was low in response results, such as those who answered insincerely on personal details, and whose response per factor was different in terms of discomfort factor by body part) were analyzed.

2.2 Research method and content 2.2.1 Job stress

This study used "Job stress factors evaluation for Koreans" developed in consideration of Korean industrial sites and cultural characteristics by referring to various job stress evaluation tools of previous studies in order to find out job stress of the mobile communication network construction workers. The questionnaire consisted of 43 questions, and was classified into eight job stress factors: physical environment, job demand, job autonomy, relation conflict, job instability, organizational system, inadequate compensation and workplace culture. Using this questionnaire, a comparative analysis is possible with other industries and occupations on job stress study results. The details of each job stress factor are as follows:

1) Physical environment (three questions): This refers to general physical environment that can affect job stress of a worker, and it is generally the risk of work type, air pollution and burden on body.

2) Job demand (eight questions): This means the burden of job. Time constraint, workload increase, responsibility and excessive job burden belong to job demand.

3) Job autonomy (five questions): This means the right for decision making on job and discretion use level on one's job. Technical discretion, autonomy, work predictability and job performing right belong to job autonomy.

4) Relation conflict (four questions): This is to evaluate personal relationship such as help from seniors or between colleagues or the lack of support. Peer support, superior's support and overall support belong to relation conflict.

5) Job instability (six questions): This refers to the degree of stability on one's occupation or job. Job seeking opportunity and employment instability belong to job instability.

6) Organizational system (seven questions): This is to evaluate job stress factors including organizational politics and operating system, organization's resources, conflicts within the organization and rational communication.

7) Inadequate compensation (six questions): This is to evaluate whether the compensation expected on job is adequate. Respect, internal motive and inadequate expectation belong to inadequate compensation.

8) Workplace culture (four questions): This is to evaluate whether Korean collectivism culture, irrational communication system and informal workplace culture function as stress factors unlike the Western worlds' formal rationalism workplace culture.

The Korea Occupational Safety and Health Agency and Occupational Safety and Health Research Institute (2004) has a method

to simply add actual score of each section, based on the questionnaire result on each item in job stress evaluation, and a

method to equally convert eight sections into 100 points. Because the number of questions in each section is different in the

(4)

first method, and also some section's score may be reflected excessively, when job stress factor is expressed as one score, this study used the method to convert each section into 100 points as shown in Equation 1.

For example, relation conflict consists of four questions, and the highest and lowest scores of each question are four and one, and therefore the predictable highest score is 16 points, and the number of questions is four. Based on these, the converted score can be calculated. If actual score is 16 points, the converted score will be 100 points.

This study conducted a result analysis using SAS 9.3 through the collected data, and identified correlations between the social demographic characteristics, job characteristics and health characteristics and job stress of the survey subjects.

3. Results 3.1 Job stress

3.1.1 Social demographic features and general matters

The mean age of 206 survey subjects was 33.5, and 40s and older accounted for 17.0%, the lowest, and the late 30s was 23.9%

(35~39 years old), and 20s was 27.7% (29 years old and younger). Early 30s was 31.6% (30~34 years old), the highest according to distribution by age bracket. As for service period, one year and less was 32.0%, the highest, followed by 2~5 years (30.6%), 5~10 years (18.9%) and ten years and more (18.5%). Concerning position, employee was the highest at 42.7%, followed by deputy section chief and section chief at 38.7%, deputy department manager and department manager at 18.6%. As for work type, outdoor job (ground equipment operation, in-building equipment operation, optimization and subminiature demolition) was 49.5%, followed by facility task (in-building facility installation, ground facility installation, facility management and administration and subminiature installation) at 32.0% and indoor job (operation support team, network monitoring and civil complaints) at 18.6%.

Among the survey subjects, smokers were 57.8%, higher than the non-smokers (42.2%). Regarding drinking, drinkers were 78.3%, three times higher than non-drinkers (21.8%). Looking at exercise, the respondents not exercising regularly were 66.0%, two times higher than the respondents regularly exercising (34.0%). The respondents not doing hobby or leisure activities were 51.9%, higher than those doing hobby and leisure activities (48.1%). As for sleeping time, the respondents having no enough sleeping time were 57.8%, higher than those having enough sleeping time (42.2%).

3.1.2 Job stress factors for mobile communication network construction workers

Table 1 shows the job stress analytical results of the survey subjects. As score is higher in each factor item, job stress is evaluated higher. The job stress of manufacturing industry workers and mobile communication network construction workers by standard industrial classification was compared ( t -test).

For t -test, two assumptions are needed. First, the parent group should have regular distribution or sample size should be large.

Second, the variances of the two groups should be the same. In the survey data to be dealt with in this study, only the mean, distribution and the number of samples are just known. According to Howell (2007), the first assumption is established, because the number of samples is sufficiently large (the number of samples in this study: 206, number of samples to be compared: 7079,

Converted score for each section =

(Actual score - No. of questions) × 100

(1)

Predictable highest score - No. of questions

(5)

1831). Concerning the second assumption, the t -test is possible by the Welch-Satterthwaite solution, despite no same variance of the two groups, and this was used in a study of Yoon et al. (2010), which was also referred to.

According to a result of t -test, statistically significant differences ( p <0.05) were shown in all factor items, as a result of comparison of mobile network communication construction workers and manufacturing industry workers. The job stress of the mobile network communication construction workers was lower in such factor items as job autonomy, relation conflict, job instability, organizational system, inadequate compensation and workplace culture than the manufacturing industry workers. However, job stress of the mobile network communication construction workers was higher than manufacturing industry workers in physical environment and job demand. The result is considered to be derived from the fact that working environment is not good, compared to the manufacturing industry, and that demand for communication network increases.

3.1.3 Job stress factors according to job-related characteristics

Table 2 shows job stress analytical results according to job-related characteristics, and job stress was analyzed from the age, work details, work evaluation, service years, position and work satisfaction aspects.

As a result of job stress analysis according to age, significant differences ( p <0.05) were shown in physical environment, job demand, job instability and workplace culture. In the physical environment and job demand aspects, a difference was shown in the 30s and older age group, compared to those in 20s, which can be regarded as the physical environment, namely stress on the physical environment that workers were faced with continuously accumulated, as age increased. Also, burden on job is considered to increase, according to higher age in terms of job demand item. Concerning job instability, workers' complaints on their job or job stability increased, as age increased. Regarding workplace culture, different results were confirmed between the early 30s and the middle 30s. Based on the criteria at the time of starting point of this study (2013), the different birth years of those younger than the middle 30s (born after 1980) and those older than the middle 30s (born before 1980) revealed workplace culture Table 1. The mean (s.d) and t -test analysis for mobile communication network workers by job stress factors (converting score)

Factors # of

questions

Communication network construction workers

Manufacturing workers by standard industrial

classification

Communication network construction workers vs.

Manufacturing workers by standard industrial

classification

Mean (s.d) t- test

Physical environment 3 51.54 (19.85) 48.93 (18.39) 0.032

*

Job demand 8 52.04 (15.96) 49.69 (18.88) 0.019

*

Job autonomy 5 50.19 (13.52) 53.44 (12.83) 0.000

**

Relationship conflict 4 38.66 (14.26) 40.44 (13.42) 0.039

*

Job instability 6 46.89 (14.46) 51.75 (12.83) 0.000

**

Organizational system 7 46.71 (15.53) 52.53 (15.11) 0.000

**

Inadequate compensation 6 42.26 (15.01) 51.03 (14.66) 0.000

**

Workplace culture 4 37.32 (14.22) 39.74 (12.94) 0.008

**

*: p <0.05, **: p <0.01

(6)

differences. In other aspects (job demand, job autonomy, relation conflict, organizational system and inadequate compensation), no significant difference by age ( p >0.05) was not revealed.

As a result of analysis of work details, significant differences ( p <0.0.5) were revealed in the physical environment and inadequate compensation factor items. From the physical environment, the stress level of the outdoor job workers was higher than those of indoor job and facility task workers. According to the analytical results, the outdoor job workers have higher risks such as risk of work type, air pollution and burden on body than the other type job workers. From the inadequate compensation aspect, the outdoor job workers' stress level was higher than that of indoor job and facility task workers. Based on such two results, the correlation between satisfaction and inadequate compensation can be ascertained from the physical environment aspect, and those results can be revealed when compensation is the same, despite the lack of the physical environment aspect. Significant differences ( p >0.05) were not revealed in the remaining job stress factor items ( job demand, job autonomy, job instability, organizational system and workplace culture).

Concerning the subjective work evaluation item, significant differences ( p <0.05) were shown in all items, and one's own subjective work evaluation criteria can have quite a correlation with job stress.

Significant differences ( p <0.05) were shown in all factor items from the service years aspect. Namely, job stress increased, as service years were longer. The mobile communication network construction workers worked for ten years and more showed a difference from those worked for different years. Actually, job stress difference was confirmed between those worked for ten years and more and those for less than ten years.

Regarding position, significant differences ( p <0.05) were shown in all factor items except relation conflict. Differences were confirmed between general employees and those with title in such factor items as physical environment, job demand, job instability, organizational system, inadequate compensation and workplace culture. From the job autonomy aspect, there were differences among the employees, deputy department managers and department managers.

All these are interpreted that job stress decreases, as job autonomy increases for higher positions. In other factor items except job autonomy, it was confirmed that job stress was not always higher for lower positions.

Table 2. The comparison of job stress factors according to job related characteristics (converting score) Physical

environment

Job demand

Job autonomy

Relationship conflict

Job instability

Organizational system

Inadequate compensation

Workplace culture Mean (s.d) Mean (s.d) Mean (s.d) Mean (s.d) Mean (s.d) Mean (s.d) Mean (s.d) Mean (s.d)

Age

20s 42.69

(21.29)B

44.01 (16.02)B

48.19 (15.69)

36.16 (18.28)

40.51 (14.80)B

42.52 (17.44)

37.90 (46.07)

32.14 (14.25)B

30~34 54.02

(21.29)A

51.06 (12.16)AB

49.33 (17.77)

38.17 (13.96)

47.35 (11.28)AB

549.69 (14.57)

43.65 (13.64)

36.51 (13.25)AB

35~39 58.50

(20.00)A

58.84 (16.66)A

52.52 (14.25)

40.48 (13.07)

50.34 (16.21)A

47.52 (15.37)

44.56 (14.56)

41.50 (14.88)A

Over 40s 51.63 (18.73)AB

57.38 (15.16)A

51.81 (11.44)

40.95 (7.11)

51.27 (13.48)A

47.07 (13.16)

43.63 (15.42)

41.19 (12.45)A

p 0.003

**

0.0001

**

0.327 0.324 0.0006

**

0.0883 0.0817 0.002

**

(7)

In the work satisfaction level, this study classified the satisfaction level into satisfied, average, dissatisfied variables, and significant differences ( p <0.05) were shown in all factor items of job stress. All these were evaluated by workers subjectively regarding job Table 2. The comparison of job stress factors according to job related characteristics (converting score) (Continued)

Physical environment

Job demand

Job autonomy

Relationship conflict

Job instability

Organizational system

Inadequate compensation

Workplace culture Mean (s.d) Mean (s.d) Mean (s.d) Mean (s.d) Mean (s.d) Mean (s.d) Mean (s.d) Mean (s.d)

Task types

Indoor job

44.75 (20.83)B

51.39 (15.69)

50.56 (12.38)

38.33 (13.74)

39.52 (18.45)

47.46 (16.24)

45.03 (16.38)AB

42.38 (16.62) Facility

tasks

47.67 (17.00)B

50.34 (13.25)

47.63 (11.76)

36.96 (12.68)

36.83 (12.22)

46.33 (13.11)

42.06 (12.34)B

39.62 (11.98) Outdoor

job

56.96 (19.33)A

54.43 (16.81)

51.81 (14.40)

40.44 (15.17)

37.98 (13.41)

47.58 (14.31)

51.25 (15.56)A

44.56 (15.92)

p 0.0007

**

0.247 0.155 0.318 0.066 0.859 0.0007

**

0.133

Job evaluation

Adequate 47.21 (18.33)B

45.20 (14.28)B

47.30 (12.87)B

34.78 (12.64)B

43.30 (13.82)B

40.73 (14.68)B

36.71 (13.48)B

33.15 (13.51)B

Hard 57.88

(18.98)A

57.77 (15.06)A

52.67 (13.63)A

41.89 (14.78)A

49.90 (14.36)A

51.85 (14.42)A

46.94 (14.69)A

40.83 (13.91)A

p 0.001

**

0.0001

**

0.004

**

0.001

**

0.001

**

0.0001

**

0.0001

**

0.0001

**

No. of years worked

< 1yr 47.14 (21.62)B

47.37 (16.18)B

47.88 (13.98)B

35.55 (13.79)B

42.71 (15.46)B

41.00 (15.36)B

37.01 (14.77)C

32.48 (15.79)B

2~5 yrs 50.00 (17.97)AB

50.13 (16.03)B

48.68 (13.53)B

36.90 (14.57)B

43.92 (13.26)B

46.08 (14.45)AB

41.09 (14.08)BC

37.04 (12.32)B

5~9 yrs 54.70 (18.80)AB

54.17 (14.66)AB

50.26 (13.92)AB

41.00 (16.12)AB

48.05 (12.23)B

51.29 (17.48)A

46.45 (14.37)AB

37.61 (13.41)B

> 10 yrs 58.48 (18.93)A

61.07 (12.86)A

56.67 (10.37)A

44.52 (10.48)A

57.75 (11.00)A

53.13 (12.05)A

49.40 (14.09)A

46.27 (10.73)A

p 0.025

*

0.0002

**

0.009

*

0.009

*

0.0001

**

0.0003

**

0.0001

**

0.0001

**

Rank

Junior staff

46.14 (20.96)B

45.63 (15.48)B

47.69 (14.53)B

35.55 (15.98)

40.76 (14.25)B

43.20 (16.54)

38.02 (15.44)B

32.94 (14.91)B Deputy

chief &

Chief

55.85 (17.40)A

55.42 (14.75)A

50.74 (13.60)AB

39.04 (14.48)

49.93 (13.68)A

49.87 (15.73)

46.42 (15.12)A

39.47 (13.15)A

Deputy head &

Head

56.76 (19.38)A

61.15 (12.31)A

55.68 (7.41)A

42.79 (8.82)

54.65 (9.84)A

49.34 (10.25)

44.60 (10.33)A

43.24 (12.24)A

p 0.002

**

0.0001

**

0.009

**

0.087 0.0001

**

0.015

*

0.001

**

0.0003

**

Job satisfaction

Satisfy 35.19 (16.81)C

41.67 (16.13)C

43.81 (14.59)B

32.14 (15.89)B

42.33 (15.90)B

38.78 (15.87)C

33.60 (14.36)C

33.53 (15.01)B

Average 54.48 (18.60)B

53.61 (14.96)B

51.90 (12.67)A

39.76 (12.62)A

47.18 (13.67)AB

46.89 (13.98)B

43.21 (13.63)B

37.06 (13.85)B

Unsatidfy 65.50 (13.30)A

63.33 (9.62)A

51.33 (13.87)A

44.58 (17.37)A

54.44 (13.92)A

62.14 (13.51)A

54.39 (16.21)A

47.08 (10.91)A

p 0.0001

**

0.0001

**

0.002

**

0.001

**

0.007

**

0.0001

**

0.0001

**

0.002

**

*; p<0.05, **; p<0.01

(8)

satisfaction, and those felt satisfied with work received less job stress.

3.1.4 Job stress factors according to health-related characteristic

Table 3 shows job stress factor analysis results according to health-related characteristics. Statistically significant differences were not revealed in all items in terms of stress level of each item according to smoking ( p >0.05).

As a result of stress level according to drinking, statistically significant differences ( p <0.05) were confirmed in relation conflict and workplace culture factor items. This means that the drinking group had more job stress than the non-drinking group, and the drinking is interpreted as affecting personal relations within a workplace. This study confirmed that Korean get-together dining and workplace culture characteristics are related with drinking.

Table 3. The comparison of job stress factors according to health-related characteristics (converting score) Physical

environment

Job demand

Job autonomy

Relationship conflict

Job instability

Organizational system

Inadequate compensation

Workplace culture Mean (s.d) Mean (s.d) Mean (s.d) Mean (s.d) Mean (s.d) Mean (s.d) Mean (s.d) Mean (s.d)

Smoking

Yes 52.29 (18.54) 51.89 (15.10) 51.09 (13.43) 39.39 (14.71) 47.67 (13.79) 47.17 (14.97) 42.91 (14.22) 38.28 (13.57) No 50.52 (21.60) 52.25 (17.17) 48.97 (13.63) 37.65 (13.65) 45.82 (15.36) 46.07 (16.36) 41.37 (16.07) 35.98 (15.06)

p 0.530 0.873 0.266 0.393 0.369 0.624 0.474 0.258

Drinking

Yes 47.16 (18.68) 52.97 (15.99) 51.01 (13.21) 39.94 (14.19)A 47.86 (14.00) 47.53 (15.46) 43.18 (14.66) 38.68 (14.80)A No 52.78 (20.06) 48.67 (15.53) 47.26 (13.34) 33.91 (13.66)B 43.43 (15.68) 43.74 (15.63) 38.89 (15.95) 32.39 (10.67)B

p 0.094 0.114 0.100 0.014

*

0.073 0.158 0.097 0.009

**

Exercise

Yes 45.73 (19.11)B 49.05 (15.72) 49.14 (12.70) 36.69 (14.94) 44.69 (14.03) 43.57 (16.21)B 39.72 (15.78) 36.15 (15.21) No 54.49 (19.64)A 53.61 (15.91) 50.74 (13.94) 39.63 (13.86) 47.98 (14.60) 48.30 (14.99)A 45.53 (14.50) 37.90 (13.72)

p 0.003

**

0.052 0.425 0.169 0.128 0.042

*

0.090 0.410

Hobby

Yes 43.92 (18.61) 49.96 (15.88) 49.16 (11.88) 37.93 (14.40) 44.79 (14.07)B 45.91 (15.61) 41.07 (15.29) 37.03 (15.45) No 53.58 (20.80) 53.93 (15.86) 51.15 (14.87) 39.31 (14.17) 48.79 (14.61)A 47.44 (15.50) 43.38 (14.73) 37.58 (13.08)

p 0.125 0.075 0.291 0.496 0.049

*

0.492 0.277 0.784

Sleeping time

Enough 44.06 (18.52)B 46.41 (15.53)B 46.59 (13.54)B 36.14 (15.32)B 43.55 (14.60)B 42.63 (16.96)B 38.82 (15.98)B 36.21 (14.87) Not

enough 57.06 (19.05)A 56.14 (15.04)A 52.83 (12.94)A 40.52 (13.18)A 49.42 (13.89)A 49.75 (13.68)A 44.78 (13.79)A 38.15 (13.73)

p 0.0001

**

0.0001

**

0.001

**

0.031

*

0.004

**

0.001

**

0.005

**

0.338

Physical fatigue

Yes 47.20 (18.65)B 48.71 (14.27)B 48.07 (12.57)B 37.46 (13.22) 45.11 (14.00) 45.03 (15.43) 40.93 (15.30) 35.65 (13.52) No 56.48 (20.11)A 55.71 (16.96)A 52.58 (14.20)A 40.00 (15.31) 48.94 (14.78) 48.58 (15.51) 43.74 (14.61) 39.21 (14.83)

p 0.0007

**

0.002

**

0.017

*

0.207 0.061 0.108 0.186 0.075

Mental fatigue

Sometimes 46.45 (19.61)B 46.65 (14.41)B 46.67 (11.53)B 34.80 (13.12)B 44.81 (12.89) 42.86 (14.65)B 38.46 (13.59)B 33.61 (12.81)B Frequently 55.86 (19.10)A 56.47 (15.86)A 53.15 (14.39)A 41.82 (14.43)A 48.64 (15.50) 49.89 (15.59)A 45.35 (15.45)A 40.39 (14.66)A

p 0.001

**

0.0001

**

0.001

**

0.0004

**

0.061 0.001

**

0.001

**

0.001

**

*; p<0.05, **; p<0.01

(9)

As a result of job stress level according to regular exercise, significant differences ( p <0.05) were shown from the physical environment and organizational system aspects. No significant differences ( p >0.05) were shown statistically in the remaining factor items except for the two factor items. Although the group not regularly exercising was not statistically significant than the group regularly exercising, job stress was evaluated highly in all factor items numerically: Especially, the stress level was high in the physical environment and organizational system.

Concerning hobby, statistically significant differences ( p >0.05) were not shown in all factor items except job instability.

As for sleeping time, statistically significant differences ( p <0.05) were shown in all factor items except workplace culture in both the group thinking their sleeping time is enough, and the group thinking their sleeping time is not enough. Job stress was lower in the former group than the latter group. From this, this study confirmed sleeping time has quite a correlation with job stress.

As for physical fatigue, job stress was higher in the group feeling physical fatigue than the group not feeling physical fatigue, and especially statistically significant differences ( p <0.05) were shown in the physical environment, job demand and job autonomy factor items.

Concerning mental fatigue, there were statistically significant differences of job stress ( p <0.05) in the group feeling mental fatigue in all factor items, compared to the group not feeling it. From this, it was confirmed that a direct correlation was shown between mental aspect and job stress.

3.1.5 Evaluation result for discomfort by body part

This study conducted a survey on whether the survey subjects felt discomfort, or pain, ache, stiffness and burning by body part within the recent one year, and the surveyed body parts were neck, shoulder, back, arm/elbow, wrist/finger, knee and foot/ankle.

According to Figure 1, discomfort on neck, shoulder and back was relatively more severe than the discomfort on other body parts:

The respondents felt discomfort or pain in the following order: shoulder (48.1%), neck (47.1%), back (40.3%), knee (30.1%) finger and finger (23.3%), arm and elbow (19.4%), and foot and ankle (15.5%). Especially, the ratios of discomfort or pain on the upper body parts were high, followed by knee.

In Figure 1, the severity of symptom of the respondents, who answered they felt discomfort or pain, was surveyed with five levels,

Figure 1. Pain reported for each body part

(10)

and five levels (very weak, weak, average, severe and very severe) were presented. Concerning the degree of pain, the respondents answered they felt discomfort or pain in the following order: 39.3% of the total respondents said they had pain on the neck, 39.4% on the shoulder, 39.8% on the back, 43.4% on the knee, 37.6% on the wrist and finger, 30.0% on the arm and elbow, and 25.8% on the foot and ankle (Table 4). The discomfort or pain on the neck, shoulder, back and knee was more severe than that on other body parts.

Figure 2 shows the analysis of ratios complaining discomfort or pain at severe and very severe levels among the five discomfort or pain severity levels by body part. Outdoor job workers showed the highest level in all body parts except knee. Especially, more than 65% showed discomfort or pain on the neck and shoulder parts. Due to network construction work features, workers work outdoors in many cases, and their working postures are unstable, and inferior working environment are conjectured to be major causes. 52% of facility task workers felt discomfort or pain on the knee, the highest, which implies that used body parts are slightly different according to task type. When it comes to indoor job position, the discomfort level was about 10%, except arm and wrist parts, which implies that physical activities are smaller than other task typed (outdoor job, facility task). However, arm and wrist showed more than 30% of discomfort level, which implies that the ratio of computer work and paper work is considered huge.

Table 4. Degree of body part discomfort

Body part Very weak Weak Average Severe Very severe

Neck 20.2% 40.5% 34.8% 3.4% 1.1%

Shoulder 25.3% 35.4% 31.3% 7.1% 1.0%

Back 17.9% 42.3% 26.9% 9.0% 3.9%

Arm/Elbow 25.0% 45.0% 25.0% 5.0% 0%

Wrist/Finger 33.3% 29.2% 31.3% 4.2% 2.1%

Knee 23.3% 33.3% 35.0% 6.7% 1.7%

Feet/Ankle 35.5% 38.7% 25.8% 0% 0%

Figure 2. Percentage of more than 'Severe' pain for each body part by task types

(11)

4. Summary and Discussion

This study analyzed the effects of job characteristics and health-related characteristics on job stress targeting mobile communication network construction workers.

As the analysis tool, this study carried out a questionnaire survey by devising the questionnaire based on the basic evaluation tool among the "Job stress factors evaluation tools for Koreans" developed by the KOSHA in 2003, and analyzed the survey results.

This study also comparatively analyzed the job stress of manufacturing industry and communication industry by standard industrial classification. To find major causes of job stress, this study compared and analyzed job stress by characteristics. This study also identified whether there was body part discomfort such as pain, ache, numbness, stiffness, burning and sensory paralysis for the past 12 months on neck, shoulder, back, arm/elbow, hand/wrist, knee and foot/ankle of those workers.

According to the comparison results with the manufacturing industry by standard industrial classification, the job stress of the mobile communication network construction workers was lower than the manufacturing workers in job autonomy, relation conflict, job instability, organizational system, inadequate compensation and workplace culture. The job stress of the mobile communication network construction workers was higher in the physical environment and job demand than that of the manufacturing workers.

Since outdoor job is the mainstream job, compared with the manufacturing industry, such results are conjectured to be derived, because the working environment of the mobile communication network construction workers is tough, and the workload increases, owing to LTE demand increase.

This study analyzed job stress from the aspects of age, task type, work evaluation, service years, position and work satisfaction as job stress factors according to workers' characteristics. As a result of job stress analytic result according to age, significant differences were shown in physical environment, job demand, and job instability and workplace culture. As age went up, job stress was continuously accumulated. As a result of analysis on work details, significant differences were shown in the physical environment and inadequate compensation. From the physical environment aspect, outdoor job workers' job stress level was higher than that of indoor job and facility task workers. According to subjective work evaluation result, the subjective work evaluation criteria had quite a correlation with job stress. Regarding service years, significant differences were revealed in all items, which implies that job stress increases, as service years are longer. There was quite a correlation between service years and job stress. Concerning position, significant differences were confirmed in all factor items except relation conflict. As for work satisfaction, significant differences were shown in all factor items, and quite a correlation between worker's satisfaction level and job stress was ascertained.

As for job stress factors analysis according to health-related characteristics, this study analyzed job stress from the aspects of

smoking, drinking, exercise, hobby, sleeping time, physical fatigue and mental fatigue. Significant differences were not shown in

all factor items concerning stress level in each item according to smoking. As for job stress level according to drinking, statistically

significant differences were confirmed in relation conflict and workplace culture factor items. As a result of analysis on job stress

according to regular exercise, significant differences were revealed in the physical environment and organizational system aspects,

and no statistically significant differences were shown in the remaining aspects except the two aspects mentioned above. Regarding

hobby, no statistically significant differences were revealed in all factor items except job instability. However, job stress was evaluated

higher in the group having hobby than the group having no hobby in all factor items. As for sleeping time, statistically significant

differences were shown in the group thinking they had enough sleeping time than the group not thinking so in all factor items

except workplace culture. Although no statistically significant differences were shown, there was a correlation between sleeping

time and job stress in all factor items. Concerning physical fatigue, job stress was higher in the group feeling physical fatigue than

the group not feeling physical fatigue in all factor items. Regarding mental fatigue, job stress of the group feeling mental fatigue

was higher than the group not feeling mental fatigue.

(12)

Concerning discomfort evaluation by body part, this study carried out a survey on whether the subjects felt discomfort by body part for the past one year. The surveyed body parts were neck, shoulder, back, arm/elbow, wrist/finger, knee and foot/ankle. The body parts with pain the most were in the following order: shoulder, neck, back, knee, wrist/finger, arm/elbow and foot/ankle. The ratios of feeling discomfort or pain on the upper body parts were high, followed by knee. This study found out that the ratios of feeling discomfort or pain on the bigger body parts were high. Because the mobile communication network construction workers have complex task characteristics, discomfort or pain was not limited to specific body parts, but spread to various body parts. The degree of pain by body part was surveyed on the basis of five levels (very weak, weak, average, severe and very severe). This study found that pain under average was mainly caused. Looking at task type and the degree of pain, the degree of pain was relatively more severe in outdoor job on almost all body parts. More than 60% of the workers, who answered severe and very severe on the pain of neck and shoulder, were outdoor job workers, and more than 50% were accounted for in other body parts except knee. Concerning indoor job workers, about 30% of them showed severe and very severe pain on wrist and arm, which is considered due to mainly computer and paper work.

This study investigated the job stress of the mobile communication network construction workers constructing mobile communication network, and discomfort by body part, as the demand for network construction rose, due to mobile communication business expansion, and resulting explosive work increase. In view of network construction work features, the workers received lots of stress from the physical environment aspect, and they felt relatively more discomfort on the neck and shoulder. This study is judged to offer an opportunity to consider the improvement of work intensity and work method of the mobile communication network construction workers. In addition, more attention is needed to be paid to finding improvement measures through harmful factor investigation.

Acknowledgements

This work was supported by the Dong-A University research fund.

References

Howell, David C., "Statistical methods for psychology" (6

th

ed.).Belmont, CA: Duxbury Press., 2007.

Jung, K.H., Study of relationship between work-related musculoskeletal disorders psychiatric disorders and job stress in train drivers, Master Thesis, Dong-eui University , 2006.

Korea Occupational Safety and Health Agency and Occupational Safety and Health Research Institute, "Standardization of job stress measurement scale for Korean employees", 1st, 2003.

Korea Occupational Safety and Health Agency and Occupational Safety and Health Research Institute, "Standardization of job stress measurement scale for Korean employees", 2nd, 2004.

Lee, S.Y., Effect of job stress on industrial accidents: Centrally on the construction and manufacturing workers, Master Thesis, Dongkuk University , 2011.

NIOSH, "Stresss… at work booklet", DHHS (NIOSH) publication No. 99-101, 1999.

Park, Y.S., Huh, W.J. and Jung, B.Y., The relationship between job stress and psychosocial stress in telecommunication service

workers, Journal of Korea Safety Management & Science , 7(3), 73-84, 2005.

(13)

Song, M.J., Lee, J.S., Kim, Y.C. and Yoon, H.Y., "A study on job stress of aircraft maintenance workers", Proceedings of 2007 Fall conference on Ergonomics Society of Korea , 2007.

Yoon, H.Y. and Park, J.J., A study on job stress of workers at distribution industry, Journal of the Society of Korea Industrial and Systems Engineering , 31(4), 41-48, 2008.

Yoon, H.Y., Lee, C.J. and Jang, J.H., A study on job stress of aircraft composite material part manufacturing workers, Journal of the Ergonomics Society of Korea , 29(5), 751-762, 2010, doi:10.5143/JESK.2010.29.5.751

Author listings

Dong-Gu Lee: [email protected]

Highest degree: Master's degree, Department of Industrial & management Systems Engineering, Dong-A University Position title: Group Chief, LG Telecom

Areas of interest: Human Factors in telecommunication area, Job stress in telecommunication network workers

Hoon-Yong Yoon: [email protected] Highest degree: Ph.D, Texas Tech University

Position title: Professor, Department of Industrial & Systems Engineering, Dong-A University

Areas of interest: Industrial Ergonomics, Usability, Product evaluation, Organizational Behavior

수치

Table 2 shows job stress analytical results according to job-related characteristics, and job stress was analyzed from the age, work  details, work evaluation, service years, position and work satisfaction aspects
Table 2. The comparison of job stress factors according to job related characteristics (converting score)  Physical  environment  Job  demand  Job  autonomy  Relationship conflict  Job  instability  Organizational system  Inadequate  compensation  Workplac
Table 3 shows job stress factor analysis results according to health-related characteristics
Figure 1. Pain reported for each body part
+2

참조

관련 문서

In multiple regression analysis, job stress symptoms were significantly higher in increasing job stress, increasing self-efficacy, office workers, manager group

Lee, “A Study on Relationship Between Job Stress, Burnout Experience and Job Satisfaction of Nurses”, Korean Journal of Occupational Health Nursing, Vol. Jeong,

Purpose: The purpose of this study was to measure the level of job stress and health status and find out factors affecting the health status among circulation

Hong, &#34;The effect of job stress, emotional labor and positive psychological capital on the job satisfaction of physician assistant&#34;, master’s

The Factors of Work-Related Stress in Occupational Therapists Working in Korean Hospitals.. Job stress, achievement motivation and occupational burnout among

This study was conducted to confirm the relevance of job stress, job satisfaction, organizational communication and turnover intention and to identify the factors

We designed this study for verifying the differences of causes and individual results of job stress between Koreans in Korea and Chinese in China of a same

[37] Hye-mi Yoon, The role of job stress, personality traits in the prediction of job satisfaction and turnover of social workers and coping behaviors,, Korean Journal of Social