39(1), 85~91(2010) DOI: 10.3746/jkfn.2010.39.1.085
부산․경북지역 초․중학교 급식메뉴의 나트륨 함량 및 학생들의 나트륨 섭취 실태 조사
이휘재†․이창희․이광수․정영지․하숙희․정유영․김동술
부산지방식품의약품안전청
Survey on Sodium Contents in Meals of School Foodservice and Sodium Intakes of Students in Busan and Gyeongsangbuk-do
Hweejae Lee†, Changhee Lee, Kwangsu Lee, Youngji Jung, Sookhee Ha, Yooyoung Jung, and Dongsul Kim
Busan Regional Korea Food and Drug Administration, Busan 608-829, Korea
Abstract
Sodium is a major component that maintains homeostasis and physiological state in body. It is an essential mineral that the body cannot produce for itself, so it must be supplied from food. On the other hand, overindulgence is one cause of hypertension, stroke, stomach cancer, osteoporosis and kidney disease. The purpose of this study was to monitor sodium content in meals of school foodservice. In this study, 801 samples (main/side dishes) were collected from 8 school foodservice in Busan and Gyeongsangbuk-do, Korea. Samples were classified into 21 food items, which were cooked rices, cooked rice with seasoning, noodles, cooked gruels, soups, stews, tang and chon-gol, stir-fried foods, fried foods, pan-fried foods, hard-boiled foods, roasted foods, steamed foods, seasoned vegetables, preserved foods, kimchis, sauces, fruits, breads and snacks, beverages, and dairy products. The samples were analyzed by AAS (atomic absorption spectrometry) after microwave digestion. The sodium content of sauces (1459 mg/100 g) and preserved foods (1165 mg/100 g) was higher than those of other dishes. Aside from them, sodium contents of roasted foods (894 mg/100 g), hard-boiled foods (786 mg/100 g) and kimchis (737 mg/100 g) were relatively higher than the others. Sodium intakes from meals of school foodservice were calculated by multiplying food intakes by sodium contents. The average sodium intakes from one serving of school foodservice were 605 mg for younger boys, 572 mg for younger girls, 774 mg for older boys, 730 mg for older girls in elementary school. Boys in middle school took in 1423 mg Na whereas girls consumed 1063 mg Na in middle school. Results from this study can be useful for establishing database of sodium contents and intake in meals of school foodservice. The database will be helpful for providing information on managing food for children.
Key words: sodium content, school foodservice, food intake, sodium intake, meal
†
Corresponding author. E-mail: [email protected]
†
Phone: 82-51-610-6204, Fax: 82-51-610-6199
서 론
생체 내에서 나트륨은 혈액을 비롯한 체액의 양을 적당하 게 유지하고, 세포의 영양분 섭취, 신경 전달 및 근육수축 시 중요한 역할을 하는 필수 무기성분으로(1), 다른 영양 성 분과는 달리 이러한 인체의 평형을 유지하기 위한 필요량이 극히 적어 미국과 일본은 성인 1일 나트륨 최소 필요량을 500 mg으로 설정하고 있으며, 평상시 성인의 경우 1일 0.2~
1 g을 최저 필요량으로 보고한 바 있다(2). 그러나 식품 자체 에 비교적 많은 양의 나트륨이 존재할 뿐 아니라, 조리 시 첨가하는 소금과 식품첨가물에도 나트륨이 함유되어 있어 일반적인 식이를 통해 생리적 요구량보다 많은 양의 나트륨 을 섭취하고 있다(3). 이러한 나트륨 과잉섭취는 뇌혈관 질 환 및 심장병과 같은 고혈압과 관련된 만성 퇴행성 질환을
유발하므로(4-9) 필요량을 권장량으로 정하기보다는 감량 목표치를 권장량으로 정하여 나트륨의 섭취량을 제한하고 있다(10).
우리가 섭취하는 식염의 양은 유아기 때부터 문화, 관습, 식습성에 의해서 좌우되며, 특히 한국인이 다량의 식염을 섭취하는 식습관은 어릴 때 이미 형성된다는 보고가 있다 (11). 유아기 때 짠맛에 길들여지고 익숙해지는 경우에는 성 인이 되어서도 과도한 식염이 첨가된 음식을 선호하게 되고, 그로 인해 나트륨 섭취량이 증가하게 되는 것으로 생각된다.
고혈압은 어릴 때부터 유전적인 소인을 나타내며, 고염식에
대한 기호도 어릴 때에 형성되므로 고혈압의 이환율을 감소
시키는 적극적인 예방의 측면에서 볼 때, 어린이의 식습관과
나트륨의 섭취실태를 평가하여 영양교육대책을 마련하는
것은 중요한 의미가 있다고 생각된다.
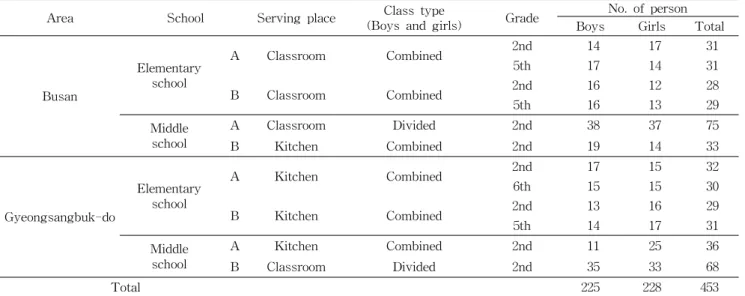
Table 1. Situation of selected classes for estimation of meal intake
Area School Serving place Class type
(Boys and girls) Grade No. of person Boys Girls Total
Busan
Elementary school
A Classroom Combined 2nd 14 17 31
5th 17 14 31
B Classroom Combined 2nd 16 12 28
5th 16 13 29
Middle school
A Classroom Divided 2nd 38 37 75
B Kitchen Combined 2nd 19 14 33
Gyeongsangbuk-do
Elementary school
A Kitchen Combined 2nd 17 15 32
6th 15 15 30
B Kitchen Combined 2nd 13 16 29
5th 14 17 31
Middle school
A Kitchen Combined 2nd 11 25 36
B Classroom Divided 2nd 35 33 68
Total 225 228 453
Table 2. The number of collected samples in school foodservice
Area School Collecting period No. of
sample Total
sample Menu
combination
Busan
Elementary school A 2008. 4~2008. 7 100
801 1 main dish 4 side dishes
B 2008. 5~2008. 7 103
Middle school A 2008. 4~2008. 7 94
B 2008. 4~2008. 6 96
Gyeongsangbuk-do
Elementary school A 2008. 5~2008. 7 98
B 2008. 4~2008. 6 98
Middle school A 2008. 5~2008. 6 86
B 2008. 5~2008. 6 126
따라서 어린이들이 최종적으로 섭취하는 나트륨의 총량 이나 주요 급원식품 등에 대한 정확한 조사와 함께 식품별, 음식별 나트륨 함량에 대한 데이터베이스를 강화할 필요가 있다. 하지만 최근까지의 연구동향을 살펴보면 주로 특정 연령층(성인 또는 학령전 아동) 및 특정 식품(식사 대용식품 등)을 중심으로 24시간 회상법, 음식섭취 빈도법 등을 이용 하여 나트륨의 섭취량을 조사한 연구가 대부분으로(12-17) 초․중학교의 단체급식에서 제공되는 최종 섭취식품에 대한 나트륨 함량 데이터베이스는 매우 부족한 실정이다.
이에 본 연구에서는 부산․경북 지역 초․중학교 단체급식 에 함유된 나트륨 함량 및 초․중학생들의 나트륨 섭취량 실태를 조사하여, 단체급식 중 나트륨 함량 및 섭취량 데이 터를 확보하고자 하였으며 나트륨 섭취 저감화 사업 등의 과학적 기초자료 마련에 기여하고자 하였다.
연구 방법
조사대상 및 기간
본 연구는 식약청에서 전국을 대상으로 추진 중인 ‘어린이 단체급식 중 당, 나트륨 실태조사’ 사업의 일환으로 수행된
과제이며, 먼저 부산․경북지역을 선택한 후 소득 및 지리적 요건 등의 지역분포를 고려한 두 지역에 각각 초등학교 2개, 중학교 2개를 대상학교로 하여 총 8개 학교를 선정하여 본 과제를 수행하였다. 초등학교는 저학년(2학년)과 고학년(5 학년 또는 6학년) 각 한 반을 선정하여 241명, 중학교는 남녀 합반인 경우에는 2학년 한 반을, 남녀 분반인 경우는 남녀 각각 한 반을 선정하여 212명을 대상으로 하여, 초․중학생 총 453명에 대해 2008년 4월 21일부터 7월 18일까지 본 조사 를 실시하였다(Table 1).
시료 수거
학교별로 2차에 걸쳐 10일씩, 약 20일간 메뉴별로 총 801 건의 시료를 수거하였다. 모든 시료는 수거 즉시 균질화하여 분석하기 전까지 -20
oC 냉동실에 보관하였다(Table 2).
나트륨 함량 분석
나트륨 표준물질은 순도 99.999% 이상의 염화나트륨
(Sigma-Aldrich, St. Louis, USA)을 구매하여 건조기에서
105
oC로 항량이 될 때까지 건조 후 사용하였다. 본 연구에서
수행된 모든 시료는 마이크로웨이브 분해법을 이용하여 전
처리하였고, 나트륨 함량은 AAS(원자흡광분광광도계, AA
280FS Fast Sequential Atomic Absorbtion Spectrometer, Varian, Clayton, Australia)를 사용하여 분석하였다.
메뉴별 섭취량 측정 방법
수거한 시료는 국내 관련 전문기관(18) 및 단체급식관련 전문서적(19)을 근거로 조리법에 따라 21개 식품군으로 분 류하였다(Table 3). 메뉴별 1인당 1회 식품 섭취량은 칭량법 을 이용하여 측정하였고, 교실배식인 경우에는 메뉴별 배식 전 무게에서 배식 후 남은 무게와 잔반량을 뺀 후 배식인원 으로 나누어 측정하였으며, 식당배식인 경우에는 본 연구에 참여하는 학생들만 따로 식사를 하여 교실배식과 동일한 방 법으로 측정하였다. 점심으로 제공되는 단체급식 1식에 대 한 총 식품 섭취량은 메뉴별 식품 섭취량의 합으로 나타내 었다.
나트륨 섭취량 측정
단체급식 주․부식 및 디저트 메뉴로부터 섭취하는 ‘1인당 나트륨 섭취량’은 ‘메뉴별 1인 식품 섭취량’에 ‘나트륨 함량’
을 곱하여 계산하였고, 점심으로 제공되는 ‘단체급식 한 끼’
로부터 섭취하는 ‘한 끼당 나트륨 섭취량’은 ‘메뉴별 나트륨 섭취량’의 합으로 나타내었다.
통계 분석
결과 데이터는 SPSS(Statistical Package for the Social Sciences) Program(v. 12.0)을 이용하여 통계처리 및 분석하 였고, 각 변수는 평균과 표준편차로 나타내었다. 평균값의 유의차 검증은 ANOVA와 Duncan's multiple range test를 사용하였으며 모든 분석에서 유의수준은 p<0.05로 하였다.
Table 3. Classification of collected samples from school foodservice in Busan and Gyeongsangbuk-do
Food type Food class No. of sample
dishes Main
cooked rices cooked rice with seasoning
noodles cooked gruels
116 25 14 3
dishes Side
soups stews tang and chon-gol
stir-fried foods fried foods pan-fried foods hard-boiled foods
roasted foods steamed foods seasoned vegetables
preserved foods kimchies
sauces
73 24 31 76 27 11 54 35 103 18 125 4 15
Deserts
fruits breads and snacks
beverages dairy products
29 9 3 6
Sum 801
결과 및 고찰
식품군별 나트륨 함량
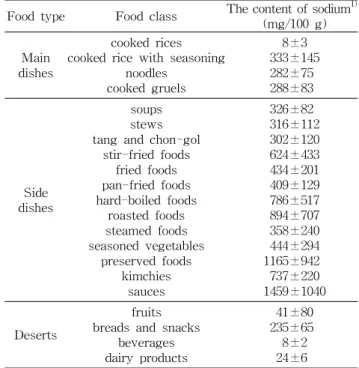
부산․경북 지역별로 초등학교 2개교와 중학교 2개교, 총 8개교로부터 수거한 801건의 단체급식 검체(부산 393건, 경 북 408건)를 대상으로 한 식품군별 나트륨 함량 분석 결과를 Table 4에 나타내었으며 단위는 ‘mg/100 g’으로 표시하였 다. 주식류 중에는 일품식류(333 mg/100 g)가 죽류(288 mg/100 g), 면류(282 mg/100 g), 밥류(8 mg/100 g)에 비해 나트륨 함량이 높게 나타났다. 일품식류는 카레, 고추장 등 상대적으로 식염이 과다하게 첨가된 식품이므로 다른 주식 류보다 높은 값의 나트륨 함량을 보였다. 다음으로 죽류는 나트륨 함량이 낮은 밥에 식염을 첨가하여 간을 맞추어 조리 를 하기 때문에 밥류에 비해 높은 나트륨 함량을 보이고 있 다. 주식류에 비해 부식류가 전반적으로 높은 나트륨 함량을 보였는데, 소스류(1459 mg/100 g)와 절임류(1165 mg/100 g)가 다른 부식류 보다 높은 값을 나타냈고, 이어서 구이류 (894 mg/100 g), 조림류(786 mg/100 g), 김치류(737 mg/100 g), 볶음류(624 mg/100 g) 순으로 높은 나트륨 함량을 나타 냈다. 무침·나물류(444 mg/100 g), 튀김류(434 mg/100 g), 부침류(409 mg/100 g), 찜류(358 mg/100 g), 국류(326 mg/100 g), 찌개류(316 mg/100 g), 탕․전골류(302 mg/100 g)가 부식류 중에서는 낮은 값을 보였다. 싱거운 음식의 간 을 맞추기 위해 섭취하는 식품인 소스류와 절임류는 그 특성 상 과다한 식염이 첨가되었음을 알 수 있었다. 디저트류는 주식류 및 부식류보다 비교적 낮은 값을 보였는데, 빵․과자 류(235 mg/100 g), 과일류(41 mg/100 g), 유제품(24 mg/100
Table 4. Mean content of sodium in collected foods Food type Food class The content of sodium
1)(mg/100 g) Main
dishes
cooked rices cooked rice with seasoning
noodles cooked gruels
333±145 8±3 282±75 288±83
dishes Side
soups stews tang and chon-gol
stir-fried foods fried foods pan-fried foods hard-boiled foods
roasted foods steamed foods seasoned vegetables
preserved foods kimchies
sauces
326±82 316±112 302±120 624±433 434±201 409±129 786±517 894±707 358±240 444±294 1165±942 737±220 1459±1040
Deserts
fruits breads and snacks
beverages dairy products
41±80 235±65 8±2 24±6
1)
Mean±SD.
Table 5. Mean food intakes of elementary school students in school foodservice
Food type Food class
Food intakes (g/person)
1)Younger Older Total
Boys Girls Boys Girls
Main dishes
cooked rices cooked rice with seasoning
noodles cooked gruels
120±40 167±61 192±102 100±27
106±33 149±58 177±85 100±5
140±24 231±89 287±127 145±33
123±19 197±60 238±126 118±33
122±32 186±73 223±114 116±28
Side dishes
soups stews tang and chon-gol
stir-fried foods fried foods pan-fried foods hard-boiled foods
roasted foods steamed foods seasoned vegetables
preserved foods kimchies
sauces
72±37 49±15 73±45 17±13 36±15 27±4 14±11 34±54 26±11 14±13 8±6 8±5 12±13
66±31 48±17 75±38 15±10 32±15 27±4 14±9 33±56 27±12 13±12 10±8 8±4 10±11
69±46 59±17 85±44 27±21 48±26 39±6 22±18 37±55 39±17 19±19 13±13 19±15 9±4
75±60 67±29 77±45 15±18 44±24 31±11 17±12 36±59 44±24 19±21 15±12 10±6 18±16
70±44 56±21 77±43 21±17 40±21 31±8 17±13 35±55 34±18 16±17 11±8 9±5 15±14
Deserts fruits
breads and snacks dairy products
41±16 35±14 106±38
35±9 34±13 106±38
50±23 37±11 106±38
51±19 30±16 106±38
44±18 34±12 106±32
1)
Mean±SD.
g), 음료(8 mg/100 g) 순으로 나트륨 함량을 보였다.
초등학생의 식품군별 식품 섭취량
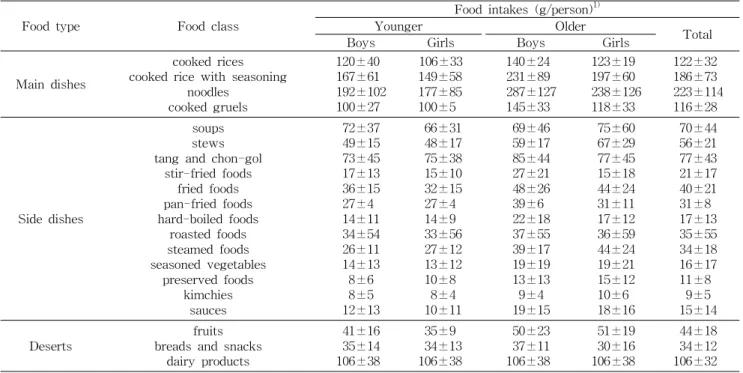
부산․경북 지역 초등학교 학생들의 식품군별 식품 섭취 량을 살펴본 결과는 Table 5와 같다. 주식류의 메뉴별 섭취 량은 면류(223 g/인), 일품식류(186 g/인), 밥류(122 g/인), 죽류(116 g/인) 순으로 많았다. 부식류 중에서는 수분 함량 이 높은 국류(70 g/인), 탕․전골류(77 g/인), 찌개류(56 g/
인)의 식품 섭취량이 높았고, 나트륨 함량이 높은 절임류(11 g/인) 및 김치류(9 g/인)의 섭취량이 가장 낮았다. 주식류에 비해 부식류는 성별에 따른 식품 섭취량 차이가 크지 않았 고, 일부 식품에 대한 학년별 차이만 존재하였다. 찌개류, 튀김류, 볶음류, 소스류, 조림류 및 무침․나물류에 대해서는 학년별 식품 섭취량 차이가 뚜렷이 나타나 고학년이 될수록 식품 섭취량이 증가하였다. 특히 김치류는 가장 낮은 식품 섭취량 값을 보이고 있는 것으로 나타났다. 본 연구의 섭취 량 결과는 한 반 전체를 대상으로 배식량과 잔반량을 구하고 이를 인원수로 나누어 계산한 평균값이므로, 이 값으로는 학생들이 김치류나 무침․나물류의 일정량을 먹는 것으로 보여 질 수 있으나, 실제로는 개인간의 편차가 상당히 커 일부의 학생들만이 이를 섭취하고 대부분은 잔반으로 버려 지고 있었다.
디저트류의 식품 섭취량은 유제품(106 g/인), 과일류(44 g/인), 빵․과자류(34 g/인) 순으로 높았으며, 디저트로 제공 되는 유제품은 대부분 정량화되어 있는 가공식품(예: 요구 르트, 푸딩 등)을 하나씩 제공하므로, 학년 간의 식품 섭취 량에 큰 차이가 없었다. 과일류의 식품 섭취량은 고학년 여
학생이 가장 높았고, 전체적으로는 고학년이 저학년보다 높 았다.
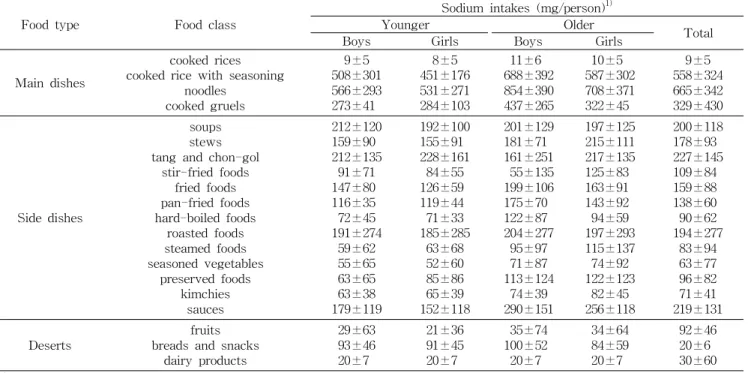
초등학생의 식품군별 나트륨 섭취량
초등학교 학생들의 면류(665 mg/인)와 일품식류(558 mg/인)로부터 섭취하는 나트륨 양은 다른 메뉴들에 비해 3~4배 높게 나타났다(Table 6). 주식류인 면류는 식품 섭취 량이 가장 높기 때문에, 다른 주․부식 및 디저트류 메뉴와 비슷한 나트륨 함량을 보임에도 불구하고, 급식 섭취시 가장 높은 나트륨을 제공하는 음식임을 알 수 있다. 죽류(329 mg/
인) 역시 높은 식품 섭취량으로 인해, 일품식류 다음으로 높 은 나트륨 섭취량을 나타냈다. 부식류의 나트륨 섭취량은 초등학교 저학년에서는 탕․전골류가 가장 높게 나타났고, 고학년에서는 소스류가 가장 높게 나타났다. 이어서 국류 (200 mg/인), 구이류(159 mg/인)가 고학년, 저학년 모두 높 게 나타났으며, 무침․나물류(63 mg/인)가 가장 낮은 나트륨 을 제공하는 것으로 나타났다.
중학생의 식품군별 식품 섭취량
중학교 학생들의 식품군별 식품 섭취량을 살펴본 결과는
Table 7과 같다. 초등학교 학생들은 식품 섭취량에 대한 성
별 차이가 특정 식품군에 대해서만 나타났는데, 중학생의
경우는 모든 식품군에 비해 성별 차이가 나타났다. 이는 중
학교 때부터 남녀간의 체격차이가 명확히 나타나기 때문이
며, 특히 외모에 대한 관심이 뚜렷한 여학생들의 경우에는
신체관리를 위한 섭식조절(다이어트)로 인해 전체적으로 먹
는 양을 줄이고자 하는 경향을 보이기(20) 때문인 것으로
추정된다.
Table 6. Mean sodium intakes of elementary school students in school foodservice
Food type Food class
Sodium intakes (mg/person)
1)Younger Older Total
Boys Girls Boys Girls
Main dishes
cooked rices cooked rice with seasoning
noodles cooked gruels
9±5 508±301 566±293 273±41
8±5 451±176 531±271 284±103
11±6 688±392 854±390 437±265
10±5 587±302 708±371 322±45
9±5 558±324 665±342 329±430
Side dishes
soups stews tang and chon-gol
stir-fried foods fried foods pan-fried foods hard-boiled foods
roasted foods steamed foods seasoned vegetables
preserved foods kimchies
sauces
212±120 159±90 212±135
91±71 147±80 116±35 72±45 191±274
59±62 55±65 63±65 63±38 179±119
192±100 155±91 228±161
84±55 126±59 119±44 71±33 185±285
63±68 52±60 85±86 65±39 152±118
201±129 181±71 161±251
55±135 199±106 175±70 122±87 204±277
95±97 71±87 113±124
74±39 290±151
197±125 215±111 217±135 125±83 163±91 143±92 94±59 197±293 115±137 74±92 122±123
82±45 256±118
200±118 178±93 227±145 109±84 159±88 138±60 90±62 194±277
83±94 63±77 96±82 71±41 219±131
Deserts fruits
breads and snacks dairy products
29±63 93±46 20±7
21±36 91±45 20±7
35±74 100±52 20±7
34±64 84±59 20±7
92±46 20±6 30±60
1)
Mean±SD.
Table 7. Mean food intakes of middle school students in school foodservice
Food type Food class Food intakes (mg/person)
1)Boys Girls Total
Main dishes
cooked rices cooked rice with seasoning
noodles cooked gruels
204±23 368±117 361±184
172
155±25 283±83 286±147
139
180±34 325±108 323±164 156±23
Side dishes
soups stews tang and chon-gol
stir-fried foods fried foods pan-fried foods hard-boiled foods
roasted foods steamed foods seasoned vegetables
preserved foods kimchies
sauces
109±59 117±45 158±61 70±55 69±51 78±42 47±51 40±40 78±51 36±43 22±19 24±16 31±27
72±43 79±40 103±47 58±45 66±45 60±28 34±30 33±27 66±44 26±27 17±13 14±6 29±25
90±54 98±46 131±60 64±50 67±47 69±36 41±42 37±34 72±47 31±36 19±14 19±13 30±25
Deserts
fruits breads and snacks
beverages dairy products
61±12 48±12 123±25 76±26
59±9 37±7 123±25
76±26
60±11 43±11 123±23 76±23
1)
Mean±SD.
주식류에 있어서 중학교 학생들 역시 초등학교 학생들과 마찬가지로 면류(323 mg/인) 및 일품식류(325 mg/인)에 대 한 식품 섭취량이 높았고, 초등학생들의 경우는 면류에 대한 섭취량이 일품식류에 비해 높은 반면 중학생들은 이 두 식품 군에 대한 섭취량 차이가 거의 없었다. 중학교 학생들의 부 식류 식품 섭취량은 전체적으로 초등학교 학생들 섭취량의
2배 정도였고, 디저트류 중에서는 음료(123 mg/인)의 식품 섭취량이 가장 높았다.
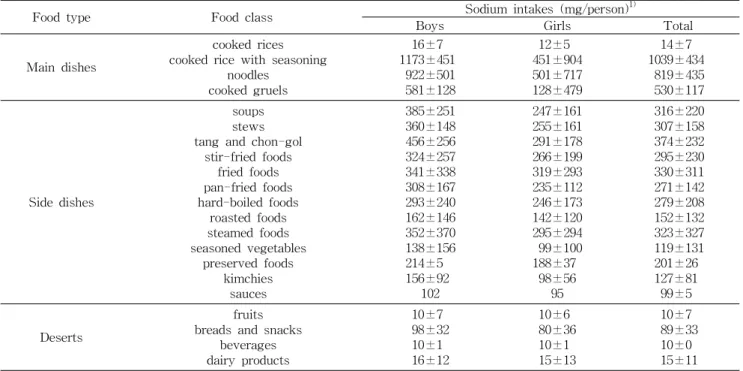
중학생의 식품군별 나트륨 섭취량
중학교 학생들의 면류(819 mg/인)와 일품식류(1039 mg/
인)로부터 섭취하는 나트륨 양은 다른 주․부식 메뉴들에 비
해 3~5배 높게 나타났다(Table 8). 일품식류와 면류는 중학
Table 8. Mean sodium intakes of middle school students in school foodservice
Food type Food class Sodium intakes (mg/person)
1)Boys Girls Total
Main dishes
cooked rices cooked rice with seasoning
noodles cooked gruels
16±7 1173±451
922±501 581±128
12±5 451±904 501±717 128±479
14±7 1039±434
819±435 530±117
Side dishes
soups stews tang and chon-gol
stir-fried foods fried foods pan-fried foods hard-boiled foods
roasted foods steamed foods seasoned vegetables
preserved foods kimchies
sauces
385±251 360±148 456±256 324±257 341±338 308±167 293±240 162±146 352±370 138±156 214±5 156±92
102
247±161 255±161 291±178 266±199 319±293 235±112 246±173 142±120 295±294 99±100 188±37
98±56 95
316±220 307±158 374±232 295±230 330±311 271±142 279±208 152±132 323±327 119±131 201±26 127±81 99±5
Deserts
fruits breads and snacks
beverages dairy products
10±7 98±32 10±1 16±12
10±6 80±36 10±1 15±13
10±7 89±33 10±0 15±11
1)
Mean±SD.
Table 9. Mean food and Na intakes from one meal in school foodservice
Intakes School Grade No. of serving day No. of participant Mean±SD
Food intakes per one meal (g/person)
Elementary school
Younger boys Younger girls Older boys Older girls
77 77 77 77
59 61 61 60
262±81
d1)241±70
d321±88
c296±84
cMiddle school Boys
Girls 72
72 100
108 532±105
a402±91
bSodium intakes per one meal (mg/person)
Elementary school
Younger boys Younger girls Older boys Older girls
77 77 77 77
59 61 61 60
605±321
de572±304
e774±419
c730±389
cdMiddle school Boys
Girls 72
72 100
108 1423±544
a1063±407
b1)
Values with the different letter among numbers of attendance are significantly different by Duncan's multiple range test at p<0.05.
생들이 가장 많이 섭취하는 식품이기 때문에, 다른 주․부식 및 디저트류 메뉴와 비슷한 나트륨 함량을 보임에도 불구하 고, 급식 섭취 시 가장 높은 나트륨을 제공하는 음식임을 알 수 있다. 나트륨은 남학생과 여학생의 차이가 있었는데, 남학생의 경우에는 국물이 있는 음식인 탕․전골류(456 mg/
인), 국류(385 mg/인), 찌개류(360 mg/인) 순으로 높게 나타 났고, 여학생의 경우에는 튀김류(319 mg/인), 찜류(295 mg/
인), 탕․전골류(291 mg/인) 순으로 높게 나타났다. 중학생 들 전체적으로는 초등학생들의 나트륨 섭취량 순위와 유사 하게 김치류(127 mg/인)와 무침․나물류(119 mg/인)가 낮 게 나타났다. 디저트류에서의 나트륨 섭취량은 빵․과자류 (89 mg/인), 유제품(15 mg/인), 음료(10 mg/인), 과일류(10 mg/인) 순으로 나타났다.
학년별 한 끼당 식품 섭취량 및 한 끼당 나트륨 섭취량 학년별 한 끼당 식품 섭취량 및 나트륨 섭취량 결과는 Table 9와 같다. 초등학교 학생들의 한 끼당 1인 식품 섭취량 은 저학년의 경우 남학생은 262 g, 여학생은 241 g이었고 고학년의 경우 남학생은 321 g, 여학생은 296 g이었다. 중학 교의 경우 남학생은 532 g, 여학생은 402 g이었다. 초등학교 학생들의 한 끼당 1인 나트륨 섭취량은 저학년의 경우 남학 생은 605 mg, 여학생은 572 mg이었고 고학년의 경우 남학생 은 774 mg, 여학생은 730 mg이었다. 중학교의 경우 남학생 은 1423 mg, 여학생은 1063 mg이었다. 학교급식으로 제공되 는 점심 한 끼를 통해 학생들이 섭취하는 식품의 양은 95%
유의수준에서 학년별로 차이가 있었으나, 초등학생들의 경
우에는 성별간의 유의적 차이가 없었고 중학생들의 경우에
는 성별간 유의적 차이가 있었다. 한 끼당 나트륨 섭취량은 초등학생들 학년별로는 유의적 차이가 나타나지 않았지만, 초등학생들과 중학생들 간에는 유의적 차이가 나타났다. 초 등학생의 경우 한 끼당 나트륨 섭취량이 고학년 남학생이 774 mg으로 가장 많이 섭취한 반면 저학년 여학생은 572 mg으로 유의적으로 섭취량이 낮았다(p<0.05).
요 약
본 연구에서는 부산․경북 지역 초․중학교 단체급식에 함 유된 나트륨 함량 및 초․중학생들의 나트륨 섭취량 실태를 조사하여, 단체급식 중 나트륨 함량 및 섭취량 데이터를 확 보하고자 하였으며 나트륨 섭취 저감화 사업 등의 과학적 기초자료 마련에 기여하고자 하였다. 식품군별 나트륨 함량 은 소스류(1459 mg/100 g)와 절임류(1165 mg/100 g)가 높 게 나타났고, 이어서 구이류(894 mg/100 g), 조림류(786 mg/100 g), 김치류(737 mg/100 g), 볶음류(624 mg/100 g), 무침․나물류(444 mg/100 g), 튀김류(434 mg/100 g) 순으로 높게 나타났다. 초등학생들의 식품 섭취량은 주식인 면류 (223 g/인), 일품식류(186 g/인), 밥류(122 g/인), 죽류(116 g/인)가 높게 나타났고, 이어서 유제품(106 g/인), 탕․전골 류(77 g/인), 국류(70 g/인), 찌개류(56 g/인), 과일류(44 g/
인) 순으로 높게 나타났다. 초등학생들의 나트륨 섭취량은 주식인 면류(665 mg/인), 일품식류(558 mg/인), 죽류(329 mg/인)가 높게 나타났고, 이어서 탕․전골류(227 mg/인), 소 스류(219 mg/인), 국류(200 mg/인), 구이류(194 mg/인), 찌 개류(178 mg/인), 튀김류(159 mg/인)가 높게 나타났다. 중 학생들의 식품 섭취량은 주식인 일품식류(325 g/인), 면류 (323 g/인), 밥류(180 g/인), 죽류(156 g/인)가 높게 나타났 고, 이어서 탕․전골류(131 g/인), 음료(123 g/인), 찌개류(98 g/인), 국류(90 g/인), 유제품(76 g/인) 순으로 높게 나타났 다. 중학생들의 나트륨 섭취량은 주식인 일품식류(1039 mg/
인), 면류(819 mg/인), 죽류(530 mg/인)가 높게 나타났고, 이어서 탕․전골류(374 mg/인), 튀김류(330 mg/인), 찜류 (323 mg/인), 국류(316 mg/인), 볶음류(295 mg/인) 순으로 높게 나타났다. 한 끼당 나트륨 섭취량은 초등학생의 경우 1인당 605 mg(저학년 남자), 572 mg(저학년 여자), 774 mg (고학년 남자), 730 mg(고학년 여자)이며, 중학생의 경우 1 인당 1423 mg(남자), 1063 mg(여자)로 나타났다. 이상으로 보아 고학년으로 올라갈수록 학교급식 한끼를 통해 섭취하 는 나트륨의 양이 한국인(9세 이상) 나트륨 상한섭취량인 2000 mg/day에 가까워지고 있음을 알 수 있었다. 따라서 학생들의 위해가능 영양성분인 나트륨의 섭취량 저감화를 위해서는 학교급식에 대한 나트륨 섭취 권고안을 만들고, 저감화 방안을 제시하며, 이를 식단에 반영할 수 있는 지침 을 개발하는 것이 시급함을 알 수 있었다. 본 연구결과를 통해 나트륨 섭취 저감화 등 어린이 보건 향상을 위한 식품
안전정책의 기초자료로 활용될 수 있기를 기대한다.
감사의 글
본 연구는 식품의약품안전청의 어린이 먹거리 안전관리 연구의 일환으로 수행되었으며 이에 대해 감사드립니다.
문 헌