1. INTRODUCTION
According to the recent data released by the Korea Tourism Statistics, the average annual growth rate of the number of tourists in Korea (2010 2014) is increasing to 5.3%, and the total cost of domestic travel has also increased from 23.89 trillion won in 2010 to 24.85 trillion won in 2014(Korea Tourism Statistics, 2015). As a result of efforts to solve these twenties' domestic travel problems, tourists who use rail tickets (under 25 years) contributed greatly to the increase in imports of Korea Railroad Corporation and the increase in tourism income of local governments (Korail, 2012). Young people used Rail-ro tickets to share the motivation of tourists and the benefits for
tourists (Kim, 2012), and I used Big Data to explore the reverse ticket usage pattern and the characteristics of the inbound keywords(Jeon, 2015). However, the researcher's previous study has studied Rail-ro ticket tourists, but there is no research on Rail-ro tickets and restaurants. Therefore, I think that it is necessary to study about eating out activity of ticket visitor Rail-ro. As a result of a survey on domestic tourism conducted by the Korea Tourism Organization in 2013, domestic tourists ranked food / restaurants as the most popular information when preparing for domestic tourism (Korea Tourism Statistics, 2014). This suggests that food is an important factor for domestic tourists and that it is necessary to study restaurant choices for domestic tourists. There are many studies on the Information available at the Culinary Society of Korea (http://www.culinary.re.kr/)
Culinary Science & Hospitality Research
Journal & Article Management System: https://cshr.jams.or.kr/
http://dx.doi.org/10.20878/cshr.2017.23.6.004
A Study on the Selection Attributes for Restaurant, Customer Satisfaction, and Recommendation Intention on Traveling Domestic Tourists:
Targeting Tourists for Rail-ro Tickets
Ju-Hee Kim, Kyoung-Ku Kang and Jong-Ho Lee
School of Hospitality & Tourism Management, Kyungsung University, Korea
KEYWORDS ABSTRACT
Domestic travel, Restaurant selection
attributes, Rail-ro tickets, Customer satisfaction, Recommendation
Intention.
The purpose of this study was to examine the causal relationship among restaurant selection attri- butes and customer satisfaction and recommendation tastes for young people in their twenties who use tickets for Rail-ro. Data collection was conducted to utilize questionnaire survey with online and offline distribution. The collected data were analyzed using a statistical program SPSS 21.0 with frequency analysis, reliability analysis, factor analysis, and regression analysis. The results of the study showed that Internet search is the most common source of information about restaurants during the trip, and restaurant choice attributes have an important impact on customer satisfaction, food quality, employee service and reputation, but hygiene did not have a big effect on customer satisfaction. In addition, customer satisfaction has a significant effect on recommendation intention.
Concluding the results from this study, it investigated the significant attributes for customers selection of restaurants and provide meaningful advice for market managers to make useful marketing strategies to attract more clients and augment economic benefits.
Corresponding author: Jong-Ho Lee, Dept. of Foodservice Management, Kyungsung University, 309 Suyeong-ro, Nam-gu, Busan 608-736, South
Korea, Tel. +82-10-663-4472, Fax. +82-51-627-6830, E-mail: [email protected]
choice of restaurants in everyday life such as fast food, family restaurant, hotel, etc. (Kim & Huh, 1997). Chae and Kim(2008) argued that the most important attribute of restaurant choice for tourists is the taste of food. On the other hand, there are not many studies on properties of restaurant selection and properties of restaurant selection during the trip. The purpose of this study is to explain the characteristics of the restaurant selection to the individual tourists visiting the destination by purchasing the tourist ticket Rail-ro, An empirical analysis will examine the characteristics of restaurant choice, customer satisfaction and referral decision making while tourists travel using tomorrow's tickets. Therefore, the purpose of this study is as follows. First, I want to know about domestic tourists who use tickets Rail-ro. Second, we will investigate factors affecting restaurant choice for tourists using Rail-ro tickets.
Third, we want to confirm the relationship between restaurant preference, customer satisfaction, and recommendation decision.
Fourth, based on the results of this study, we would like to provide useful information to domestic tourists and restaurant owners.
2. LITERATURE REVIEW
2.1. Domestic Travel
Tourism means going away from everyday life and freely viewing diverse cultures and landscapes in other areas (Doo- san Encyclopedia, 2016). In a study by Choi and Park(2012), we analyzed the effects of participation in tourism on the quality of life by controlling other variables besides tourism activities. As a result, it was confirmed that participation in domestic tourism has a positive influence on the quality of life. Domestic tourism has a competitive advantage of com- fort, geographical convenience, low cost, and familiarity (Shim
& Chang, 2007). Domestic tourism, which can recognize the recent participation and decision making, is gaining popularity (Kim & Yoon, 2012).The higher the quality of the tourism experience, the more positive the effect of the visitor's psy- chology. In addition, the higher the level of satisfaction through tourism, the more positively the positive impact on the sub- jective quality of life of tourists (Kim & Song, 2006). In addi- tion, tourism has a positive effect on the physical and social health of tourists (Han, 2014).
2.2. Rail-ro ticket
Rail-ro ticket is an unlimited free ticket for railways that
allows you to travel around the country freely with one ticket.
The name of this product is tomorrow as rail, which means rail of railroad, Future, My work which means future, and road which means road. Rail-ro's free train tickets are sold in the winter season from December to February and in the summer season from June to August. The target audience is young people under 25 years of age (Korail, 2016). By 2015, 230,967 people have become popular enough. The reason why the ticket is so popular for Rail-ro is that firstly, it can travel at a lower cost than the normal fare, can use the discounted amount of accommodation, sightseeing, and restaurants, and can freely plan a trip and travel (Lim, 2013). The ticket for Rail-ro has changed the travel trend of young people from overseas travel to domestic travel. In this regard, he earned a good reputation and was selected as the winner of the Frontier category at the 2012 Korea Tourism Awards (Korail, 2012). Through this study, tourists visiting tomorrow will know that they are enjoying local food together with various attractions. When they express their feelings about the traveled area, they express the feeling that the food is de- licious. It can be seen that it has a significant influence.
2.3. Restaurant Choice Attributes and Customer Satis- faction
An optional attribute is a property that is closely related to a consumer's preference, purchase decision and return visit among the attributes of a product, trademark, or store(Lewis, 1981). The choice attribute has a great influence on the choice of product by differentiating the attitude of the customer's preference and the attribute of the product at the time of purchase (Oh & Ko, 2009). The results of this study are as follows. First, the relationship between service choice attri- butes and customer satisfaction was examined (Kim, Lee, &
Park, 2011). The tangibility of restaurant users has had a posi-
tive impact on the brand image and reliability of buying
behavior(Woo, 2010). The study of Cho and Jung (2007) argues
that the "differentiating" factor among the optional attributes
of Italian restaurants has the greatest positive impact on
future behavioral intentions such as customer satisfaction,
return visit, and recommendation intention. Therefore, we set
the following hypothesis. In the research on the quality of
service and the influence of the perceived sacrifice and value
on the intention of re-visiting satisfying the service quality of
the restaurant in the tourist destination of the domestic
tourist, the quality of the restaurant service directly or indi-
rectly affects the repeat inquiries He insisted on giving (Kang
& Ko, 2007). In Park (2014), research on the characteristics of restaurant selection in everyday life is active, but studies on the nature of restaurant selection on the road are inadequate.
In the domestic travel trips, restaurant selection attributes were extracted with six factors including food attributes, sanitation, recommendation effect, price, face, accessibility.
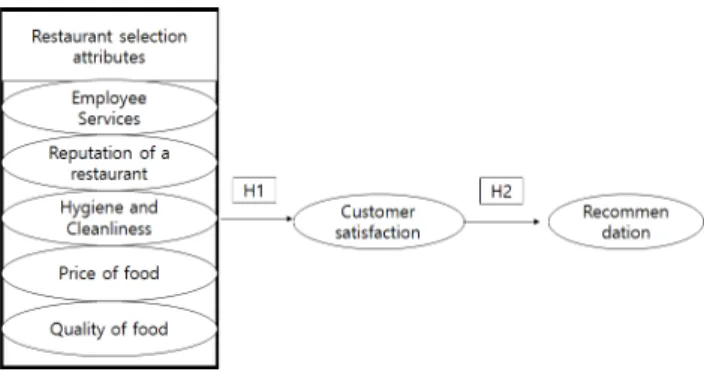
H1: The choice attribute of the restaurant that is traveling has a significant effect on customer satisfaction.
H1-1. Employee service has a significant effect on custo- mer satisfaction.
H1-2. The restaurant's reputation has a significant effect on customer satisfaction.
H1-3. Hygiene and cleanliness have a significant effect on customer satisfaction.
H1-4. Food prices have a significant effect on customer satisfaction.
H1-5. The quality of food has a significant effect on cus- tomer satisfaction.
2.4. Customer Satisfaction and Recommendation Intention
Customer satisfaction means that products and services meet customer needs. Oliver(1997) stated that satisfaction means that one finds contentment. Hellier, Geursen, Carr and Richard(2003) stated that customer satisfaction is “the degree of overall pleasure or contentment felt by the customer, resul- ting from the ability of the service to fulfill the customer’s desires, expectations, and needs in relation to the service."
Recommendation intention originated in Whyte's classic mar- keting research, which was introduced in Fortune magazine in 1954, and refers to the human-to-human communication that occurs between two or more individuals, such as members of the reference groupand the customer's salesperson (Seo,
Fig. 1. Research model.
2006). The specialist store manager needs to measure cus- tomer satisfaction, the appropriate price, and you need to prepare quality and efficient plan(Kwon & Oh, 2011). When it comes to the relationship between customer satisfaction and recommendation intention, the study by Jeon (2012) suggests that the menu selection factors of a restaurant influence cus- tomer satisfaction overall, and customer satisfaction influences revisit and recommendation intention. Lee, Kim and Cho (2010) found that 'quality and quantity of food' in local restaurants have the biggest influence on customer satisfaction among three dimensions of service quality. Customer satisfaction has a great influence on recommendation intention and revisit.
Therefore, we set the following hypothesis.
H2. Customer satisfaction has a significant effect on recommendation intention.
3. METHODOLOGY
3.1. Instrumentation and Data Collection
In this study, the authors found a young population buying tickets for mid-summer Rail-ro tickets for domestic tourists recommending food choices and customer satisfaction during travel. The study period of this study was from July to August 2016. Collection of questionnaires was done in two ways, online and offline. The population is characterized by young people under the age of 25 fully using the Internet. So, the authors conduct online questionnaires familiar to young people and conduct offline questionnaires in parallel to increase the reliability of the questionnaires. During this period, offline surveys were conducted with a researcher who was trained in the purpose of the survey and the content of the survey.
The researcher distributed 150 questionnaires to trains and collected 128 copies. Online questionnaire survey was con- ducted by using SNS and portal site (Damn community cafe) to recruit population online, 136 online surveys were collected and used for analysis of only 129 copies excluding 7 copies that were unfaithfully answered among them. To the respon- dents who responded to the online questionnaire we gave a beverage gift certificate and an ice cream gift certificate through lottery. The analysis method analyzing the collected ques- tionnaire using the statistics package SPSS 21.0 is as follows.
3.2. Data Analysis
In order to accomplish the purpose of the study, frequency
analysis was conducted to identify the demographic charac- teristics, reliability of optional attributes of restaurant during restaurant, factor analysis and reliability analysis were con- ducted. Regression analysis was conducted to investigate the relationship between customer satisfaction and recommen- dation interactions.
4. RESULTS
4.1. Demographic Information
Table 1 in demographics and general characteristics, 53.7%
of respondents were female; respondents 21~24 years old were most common in the Yeongnam area (Busan, Daegu, Ulsan, Gyeongsang).
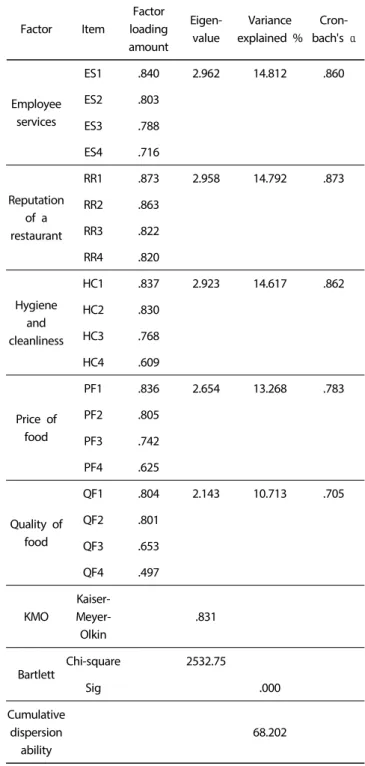
4.2. Factor Analysis and Reliability Analysis
Table 2 shows the results of factor analysis and reliability analysis of restaurant selection attributes during the trip. The restaurant choice attribute on the trip was extracted with five factors. As KMO = 0.831, it appeared higher than the reference value of 0.6, so it was better to select variables for factor analysis. The verification result of Bartlett 's formation in Chi - square = 2532.75 showed that the probability of care was suitable for factor analysis at 0.000. The cumulative dispersion explanatory power proved to show the explanatory power of
Table 1. Demographic characteristics of the sample (N=257) Characteristics Frequency (N) Ratio(%)
Gender
Male 119 46.3
Female 138 53.7
Age
19~20 43 16.7
21~24 140 54.5
25~27 74 28.8
Resi- dence
Metropolitan area
(Seoul, Incheon, Gyeonggi) 96 37.4
Kanto (Gangwon) 3 1.2
Chungcheong
(Daejeon, Chungcheong) 34 13.2
Honam (Gwangju, Jeolla) 24 9.3
Youngnam (Busan, Daegu,
Ulsan, Gyeongsang) 98 38.1
Jeju 2 0.8
68.202%. As a result of analyzing the reliability, "employee's service" appeared at 0.860, "restaurant reputation" was 0.873,
"hygiene and cleanliness" was 0.862, "food price" was 0.783,
"food quality" was 0.705 , All of which are shown in 0.6 or more, ensuring the reliability for the measurement item.
The next Table 3. is the factor analysis result of customer satisfaction. The inherent value (eigen value) of the customer
Table 2. Factor analysis and reliability analysis of restaurant selection attributes during travel
Factor Item
Factor loading amount
Eigen- value
Variance explained %
Cron- bach's α
Employee services
ES1 .840 2.962 14.812 .860
ES2 .803
ES3 .788
ES4 .716
Reputation of a restaurant
RR1 .873 2.958 14.792 .873
RR2 .863
RR3 .822
RR4 .820
Hygiene and cleanliness
HC1 .837 2.923 14.617 .862
HC2 .830
HC3 .768
HC4 .609
Price of food
PF1 .836 2.654 13.268 .783
PF2 .805
PF3 .742
PF4 .625
Quality of food
QF1 .804 2.143 10.713 .705
QF2 .801
QF3 .653
QF4 .497
KMO
Kaiser- Meyer- Olkin
.831
Bartlett
Chi-square 2532.75
Sig .000
Cumulative dispersion
ability
68.202
Table 3. Factor analysis and reliability analysis of customer satisfaction
Factor Item
Factor loading amount
Eigen- value
Variance explained
%
Cron- bach's α
Customer satisfaction
FM1 .870 4.261 71.011 .917
FM2 .869
FM3 .862
FM4 .860
FM5 .805
FM6 .787
KMO Kaiser-Meyer-
Olkin .907
Bartlett
Chi-square 1030.87
Sig .000
Cumulative dispersion
ability
71.011
satisfaction question was 4.261 or more at 1.0 or more. The factor loading amount was all over 0.40. As KMO = 0.907, it appeared higher than the reference value of 0.6, so it was better to select variables for factor analysis. The verification result of Bartlett's section formation Chi-square = 1030.87 It turned out that the attention probability was suitable for use in factor analysis at 0.000. I found that the cumulative dis- persion explanatory power is showing the explanatory power of 71.011%. As a result of analyzing the reliability, "customer satisfaction" is displayed in 0.917, and the reliability for the measurement items has been secured.
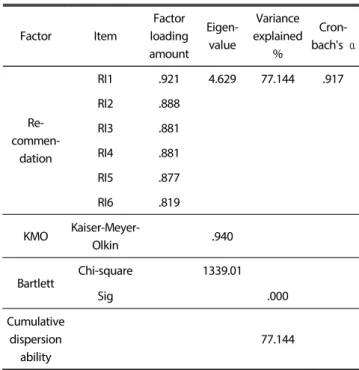
The next Table 4. is the recommendation factor analysis result. The inherent value (eigen value) the recommendation was 4.629, which was 1.0 or more. The factor loading amount was all over 0.40. As KMO = 0.940, it appeared higher than the reference value of 0.6, so it was better to select variables for factor analysis. The verification result of Bartlett 's forma- tion in Chi-square = 1339.01 showed that the attention pro- bability was suitable for factor analysis at 0.000. The cumula- tive dispersion explanatory power showed that it shows 77.144% explanatory power. As a result of analyzing the rel- iability, "Recommended" is displayed in 0.917, and the reli- ability for the measurement items has been secured. In this research, let's investigate what kind of correlation exists among the selection attributes of eating and drinking establish-
Table 4. Factor analysis and reliability analysis of recom- mendation intention
Factor Item
Factor loading amount
Eigen- value
Variance explained
%
Cron- bach's α
Re- commen-
dation
RI1 .921 4.629 77.144 .917
RI2 .888
RI3 .881
RI4 .881
RI5 .877
RI6 .819
KMO Kaiser-Meyer-
Olkin .940
Bartlett
Chi-square 1339.01
Sig .000
Cumulative dispersion
ability
77.144
ment, customer satisfaction level, and recommended items during the trip. The correlation analysis is performed, and the correlation result between each variable is Table 5. It was found that there was a positive (+) relationship between all the variables. Hygiene and cleanliness and employee services showed a slightly high correlation with r = 0.605, p <0.01. And food quality and sanitary cleanliness showed somewhat high correlation with r = 0.433, p <0.01. Variables that showed the highest correlation showed high correlation between custo- mer satisfaction level and recommended road r = 0.803, p <
0.01. And the quality of food and the reputation of eating and drinking establishment r = 0.080, the degree of hygiene and cleanliness and recommendation r = 0.117, the food price and recommendation degree r = 0.107 and found no correlation.
4.3. Hypothesis Test
As a result of factor analysis and reliability analysis, factor
analysis and reliability analysis of restaurant selection attri-
butes during travel showed that restaurant selection attributes
had five key factors: employee service, restaurant reputation,
hygiene and cleanliness, food price, and quality. The reliability
analysis showed that all of them were more than 0.6. Third,
according to the research hypothesis test to confirm the
significant influence of restaurant selection attributes on
customer satisfaction during the trip, it was found that the
Table 5. Correlation analysis Employee
service
Reputation of a restrain
Hygiene and cleanliness
Price of food
Quality of food
Customer satisfaction
Recommen- dation
Employee service 1
Reputation of a restrain .201
**1
Hygiene and cleanliness .605
**.056 1
Price of food .339
**.156
*.330
**1
Quality of food .249
**.080 .433
**.219
**1
Customer satisfaction .193
*.207
**.138
*.124
*.304
**1
Recommendation .203
*.179
**.117 .107 .300
**.803
**1
**
p<.01,
*p<.05.
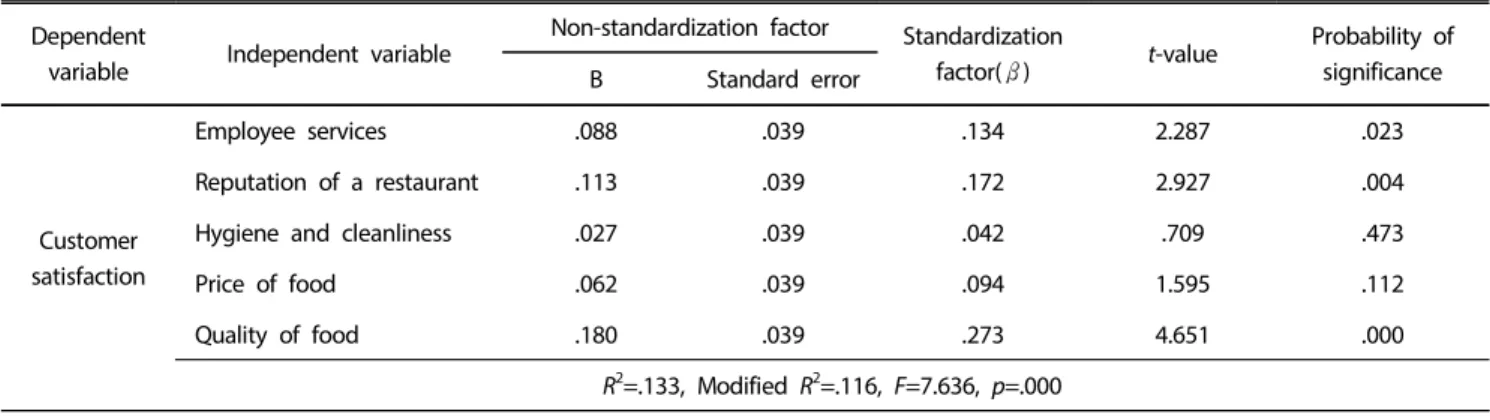
subordinate hypothesis of restaurant selection attributes: food quality (β = .273, t = 4.651), service of employees β = .134, t = 2.287), and restaurant reputation (β = .172, t = 2.927) have a significant influence on customer satisfaction.
By contrast, hygiene, cleanliness and food prices were not significantly related to customer satisfaction. It is also found that customer satisfaction (β = .803, t = 21.552) has a signifi- cant effect on recommendation intention(Table 6, Table 7).
Selection attributes of restaurants during the trip have a significant influence on customer satisfaction. "Hypothesis
Table 6. The effect of restaurant selection property on customer satisfaction
Dependent
variable Independent variable
Non-standardization factor Standardization
factor(β) t-value Probability of significance
B Standard error
Customer satisfaction
Employee services .088 .039 .134 2.287 .023
Reputation of a restaurant .113 .039 .172 2.927 .004
Hygiene and cleanliness .027 .039 .042 .709 .473
Price of food .062 .039 .094 1.595 .112
Quality of food .180 .039 .273 4.651 .000
R
2=.133, Modified R
2=.116, F=7.636, p=.000
***
p<.001,
**p<.05,
*p<.01.
Table 7. The Effect of customer satisfaction on recommendation intention
Dependent
variable Independent variable
Non-standardization factor Standardization
factor(β) t-value Probability of significance
B Standard error
Recommen- dation
Customer satisfaction .944 .044 .803 21.524 .000
R
2=.645, Modified R
2=.644, F=463.277, p=.000
***