Quantitative Analytical Method for Eighteen Marker Compounds in Ongyeong-tang, a Traditional Herbal Formula, Using
High-Performance Liquid Chromatography for Quality Assessment
Jung-Hoon Kim
1,2#, Hyeun-Kyoo Shin
1, Chang-Seob Seo
1*1 : Herbal Medicine Formulation Research Group, Korea Institute of Oriental Medicine, Daejeon, Republic of Korea, 305-811
2 : Division of Pharmacology, School of Korean Medicine, Pusan National University. Yangsan, Gyeongnam, Republic of Korea, 626-870
ABSTRACT
Objectives : Ongyeong-tang (OGT) is a traditional herbal formula used to cure gynaecological disorders. OGT consists of 12 herbal medicines containing various bioactive components. Therefore, the development of suitable analytical method for the marker compounds is necessary for the quality control of OGT.
Methods : Determination of the 18 marker compounds in OGT preparations was quantitatively performed by high-performance liquid chromatography–photodiode array detection analysis. The marker compounds were separated on a reversed-phase C
18column and the analytical method was successfully validated, which was applied to compare OGT extracts from laboratory preparation and commercial OGT granules.
Results : Limit of detection and limit of quantification values were in the ranges of 0.001–0.016 µg/mL and 0.003–0.047 µg/mL, respectively. Precision was 0.03–3.71 % within a day and 0.03–3.81 % over four consecutive days. Recovery of marker compounds ranged from 90.63–108.26 %, with relative standard deviation (RSD) values
< 4.0 %. Reproducibility was < 2.5 % of the RSD value. The 18 marker compounds were stable within 16 h at 10 ℃, with the RSD value < 3.5 %. Quantitative analysis results showed that the quantities of the 18 marker compounds varied among OGT samples. Pearson coefficient evaluation and principal component analysis demonstrated that an OGT water extract produced by a laboratory method clearly differed from commercial OGT granules.
Conclusions : The developed analytical method was simple, precise, and reliable. Therefore, it can be used for the quality assessment of OGT preparations.
Key words : Ongyeong-tang, Quantitative analysis, Method development, Pearson coefficient, Principal component analysis
Introduction 1)
Ongyeong-tang (OGT), a traditional herbal formula for treating gynaecological disorders, consists of 12 herbal medicines, i.e. . Liriope platyphylla F.T.Wang & Tang, Angelica gigas Nakai, Panax ginseng C.A.Mey., Pinellia ternata (Thunb.) Makino, Paeonia lactiflora Pall., Cnidium officinale Makino., Paeonia suffruticosa Andrews, Equus
asinus L., Glycyrrhiza uralensis Fisch., Euodia ruticarpa (A. Juss.) Benth, Cinnamomum cassia Presl, and Zingiber officinale Roscoe. OGT has been traditionally used for the treatment of menstrual diseases such as irregular menstruation, advanced or delayed menstruation, and uterine bleeding
1). Clinical studies reported that OGT can treat anovulatory women with high plasma luteinizing hormone levels, improve gonadotropin pulsatile or estradiol
*Corresponding author : Chang-Seob Seo. Herbal Medicine Formulation Research Group, Korea Institute of Oriental Medicine, Daejeon, Republic of Korea, 305-811
·Tel : +82-42-868-9361 ·E-mail : [email protected]
#First author : Jung-Hoon Kim. Division of Pharmacology, School of Korean Medicine, Pusan National University. Yangsan, Gyeongnam, Republic of Korea, 626-870
·Tel : +82-51-510-8456 ·E-mail : [email protected]
·Received:22 June 2015 ·Revised:16 July 2015 ·Accepted:16 July 2015
secretion in the treatment of anovulatory women, or adjunctively treat hormone replacement therapy-resistant menopausal women with depressive ilness
2–5). OGT has also shown pharmacological effects such as stimulatory effects on ovarian steroidogenesis and the ovulatory process in the ovary, inhibitory effects on the corticotrophin - releasing factor-induced increase in locomotor activity, and the proliferation of uterine endometrial tissue
6–9). OGT is a combination of these 12 herbal medicines with a specific compositional ratio and is generally prescribed as a form of decoction produced by boiling with water.
Multiple chemical constituents can be extracted from the compositional herbs; their chemical interaction is thought to contribute their therapeutic effects. Identification of the chemical compounds in OGT and the determination of their quantities may be a fundamental step towards further pharmacological or clinical experiments. However, the quantification of OGT based on a single compound, or several chemical compounds is challenging, because a few compounds cannot reflect all the chemical characteristics of OGT. Therefore, the simultaneous determination of various chemical compounds with different structure is necessary for understanding the full chemical spectrum of OGT. Thus, the quality assessment of OGT preparations can be performed using quantitative analysis of multiple components as marker compounds.
High–performance liquid chromatography combined with photodiode array detection (HPLC-PDA) has been widely used for the chemical analysis of herbal formulae;
it is a simple, precise, and rapid technique for the detection of multiple chemical compounds
10–12). Thus, HPLC-PDA methods are used for the quality control of herbal preparations
13–15). Various bioactive marker compounds were reported in the compositional herbs of OGT: gallic acid, oxypaeoniflorin, (+)-catechin, paeoniflorin, 1,2,3,4,6-pentagalloylglucose, benzoylpaeoniflorin, and paeonol from P. lactiflora and P. suffruticosa ; chlorogenic acid, caffeic acid, and ferulic acid from C. officinale ; liquiritin, ononin, and glycyrrhizin from G. uralensis ; nodakenin from A. gigas ; coumarin, cinnamic acid, and cinnamaldehyde from C. cassia ; and 6-gingerol from Z. officinale
16–25). Some of these bioactive compounds were also used as the marker compounds for HPLC analysis of herbal medicines
26,27). Therefore, the above 18 chemical compounds can be used as the marker compounds for the quantitative analysis and quality assessment of OGT preparations.
In the present study, we developed analytical methods for the 18 marker compounds in an OGT water extract (OGTWE) by a validated method using HPLC-PDA.
The amounts of marker compounds were quantified.
An OGTWE and commercial granules were compared for the quality assessment of OGT preparations.
Materials and methods
1. Chemicals and reagents
HPLC-grade methanol, acetonitrile, and water were purchased from J.T. Baker Inc. (Phillipsburg, NJ, USA). Formic acid was purchased from Fluka (Seelze, Germany). Trifluoroacetic acid was purchased from Alfa Aesar (Ward Hill, MA, USA). Gallic acid (1), (+)-catechin (3), ferulic acid (7), coumarin (11), and cinnamic acid (13) were purchased from Sigma-Aldrich (St Louis, MO, USA). Oxypaeoniflorin (2), nodakenin (9), 1,2,3,4,6-pentagalloylglucose (10), ononin (12), and benzoylpaeoniflorin (15) were supplied by Chengdu Biopurify Phytochemicals (Chengdu, China). Chlorogenic acid (4) and caffeic acid (5) were purchased from Acros Organics (Morris Plains, NJ, USA). Paeoniflorin (6), cinnamaldehyde (14), and paeonol (16), 6-gingerol (17), and glycyrrhizin (18) were obtained from Wako Pure Chemical Industries (Osaka, Japan). Liquiritin (8) was supplied by NPC Biotechnology (Geumsan, Korea).
The chemical structures of the standard compounds are shown in Fig. 1. The purity of all reagents and marker compounds was ≥ 98 %.
Fig. 1. Chemical structures of the 18 standard compounds in Ongyeong-tang (OGT). (1) Gallic acid, (2) oxypaeoniflorin, (3) (+)-catechin, (4) chlorogenic acid, (5) caffeic acid, (6) paeoniflorin, (7) ferulic acid, (8) liquiritin, (9) nodakenin, (10) 1,2,3,4,6-pentagalloylglucose, (11) coumarin, (12) ononin, (13) cinnamic acid, (14) cinnamaldehyde, (15) benzoylpaeoniflorin, (16) paeonol, (17) 6-gingerol, and (18) glycyrrhizin.
Compositional herbal medicines purchased from the
herbal medicine company, Kwangmyungdang Medicinal
Herbs (Ulsan, Korea), and from the commercial samples
are listed in Table 1. A voucher specimen (2014-KE41-1
–12) was deposited in the Herbal Medicine Formulation Research Group of the Korea Institute of Oriental Medicine.
Table 1. Composition of Ongyeong-tang water extract (OGTWE), OGT01, and OGT02
Herbal medicine
OGTWE
OGT01 (g) OGT02 Original region Amount (g)
(g)
Liriope platyphylla F.T.Wang & Tang Milyaong, Gyeongnam, Korea 7.50 3.33 3.33 Angelica gigas Nakai Bonghwa, Gyeongbuk, Korea 5.63 1.00 1.00 Panax ginseng C.A.Mey. Yeongju, Gyeongbuk, Korea 3.75 0.67 0.67 Pinellia ternata (Thunb.) Makino China 3.75 1.67 1.67 Paeonia lactiflora Pall. Euiseong, Gyeongbuk, Korea 3.75 0.67 0.67 Cnidium officinale Makino. Yeongyang, Gyeongbuk,
Korea 3.75 0.67 0.67
Paeonia suffruticosa Andrews Jecheon, Chungbuk, Korea 3.75 0.67 0.67
Equus asinus L. China 2.81 0.67 0.67
Glycyrrhiza uralensis Fisch. China 2.81 0.67 0.67
Euodia ruticarpa (A. Juss.) Benth China 1.88 1.00 1.00
Cinnamomum cassia Presl Vietnam 1.88 0.67 0.67
Zingiber officinale Roscoe Ulsan, Gyeongbuk, Korea 3.75 0.33 0.33
Sum - 45.01 12.02 12.02
2. Sample preparation of OGT WE and commercial granules
A mixture of crude herbal drugs consisting of OGT was extracted with a 10-fold volume of distilled water (w/v) at 100 ℃ for 2 h under pressure (1 kgf/㎠) using an electric extractor (COSMOS-660; Kyungseo Machine, Incheon, Korea). The extracted decoction was filtered through a standard sieve (no. 270, 53 µm;
Chunggyesangongsa, Seoul, Korea) and then freeze-dried to obtain an OGTWE powder.
Accurately weighed OGTWE (100 mg) and commercial OGT granules (300 mg) were dissolved in 10 mL distilled water, and the solutions were filtered through a 0.2 µm syringe filter (SmartPor
®; Woongki Science, Seoul, Korea) prior to injection into the HPLC apparatus.
3. Preparation of standard solutions of marker compounds
The stock solutions were prepared by dissolving accurately weighed standard compounds in methanol at concentrations of 1000 µg/mL. Working solutions were produced by diluting the stock solutions containing standard compounds. Diluted working solutions were used to construct calibration curves.
4. Chromatographic conditions
The HPLC-PDA system comprised a LC-20A (Shimadzu, Kyoto, Japan) equipped with a solvent delivery unit,
autosampler, column oven, degasser, and PDA. The acquired data were processed using LabSolutions software (v. 5.3; Shimadzu). The 18 marker compounds were separated on a Gemini C
18column (4.6 × 250 ㎜, 5 µm ; Phenomenex, Torrance, CA, USA). The column oven was maintained at 40 ℃. The mobile phase consisted of water containing 0.1 % formic acid (A) and acetonitrile (B), with gradient elution (see Table 2). The flow rate was 1.0 mL/min and the injection volume was set to 10 µL. The detection wavelengths were optimized according to the maximum absorption wavelengths of the standard compounds.
Table 2. Mobile phase gradient conditions (A:B)
Time (min) A (%) B (%)
0 92 8
10 83 17
15 83 17
25 80 20
28 80 20
32 72 28
35 72 28
45 44 56
47 44 56
55 23 77
57 23 77
65 92 8
72 92 8
A, 0.1% formic acid in water; B, acetonitrile.
5. Method validation 1) Linearity
Accurately weighed standard compounds were dissolved in methanol to prepare stock solutions in concentrations of 1000 µg/mL. Stock solutions of the 18 marker compounds were diluted to construct calibration curves. The diluted concentrations of marker compounds were plotted against the peak area on the calibration curves and the linearity was determined using correlation coefficient.
2) The limit of detection (LOD) and limit of quantification (LOQ)
LOD and LOQ were determined as follows: LOD = 3.3 × SD/S and LOQ = 10 × SD/S, where SD is the standard deviation of the response and S is the slope of the calibration curve.
3) Precision
The precision was evaluated by four analyses in one
day (intra-day precision) and by analysis over four
consecutive days (inter-day precision. Precision was
calculated by analysing sample extracts containing
low, medium, and high concentrations of marker compounds.
The precision value was represented as the relative standard deviation (RSD) [(standard deviation / mean)
× 100].
4) Recovery
The recovery test was performed to evaluate the accuracy of the method used. The three known amounts of marker compounds (low, medium, and high) were added to the samples and the recovery was calculated as follows: recovery (%) = [(detected concentration – initial concentration) / spiked concentration) × 100].
5) Reproducibility
The reproducibility was determined by calculating the RSD values of the retention times and the absolute areas of marker compounds ( n = 6).
6) Stability
The stability test was conducted by analysing the extracted solution after storage under refrigeration at 10 ℃ for 4, 8, 12, and 16 h
6. Statistical analysis
One-way analysis of variance (ANOVA) using the Tukey test, Pearson correlation efficient, and the principal component analysis (PCA) were performed for multiple group comparisons using open-source software R (v.
3.0.2). Differences were considered significant at P < 0.05, P < 0.01, or P < 0.001.
Results
1. Optimization of chromatographic conditions
The mobile phase consisted of water (A) and acetonitrile (B), and a modifier. Two different modifiers, such as 0.1% trifluoroacetic acid and 0.1% formic acid, were compared for the optimal separation of the 18 marker compounds. Better resolution and peak shapes between marker compounds were obtained when 0.1% formic acid was used as modifier. Various ratios of the components of the mobile phase (A:B) were tested using gradient elution for optimal separation of marker compounds.
Selected gradient elution conditions used are listed in TableII. The optimal UV wavelength for each marker compound was tested in the range 190–400 nm: paeoniflorin and benzoylpaeoniflorin at 230 nm; ononin and glycyrrhizin at 250 nm; oxypaeoniflorin at 255 nm; gallic acid at 270 nm; (+)-catechin, liquiritin, coumarin, cinnamic acid,
and paeonol at 275 nm; 1,2,3,4,6-pentagalloylglucose and 6-gingerol at 280 nm; cinnamaldehyde at 290 nm;
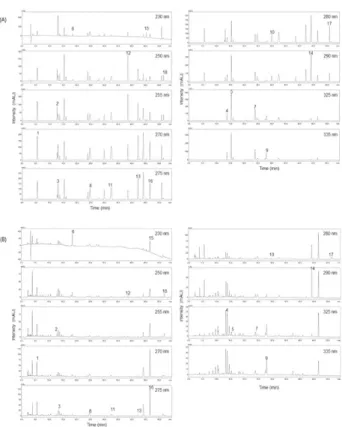
chlorogenic acid, caffeic acid, and ferulic acid at 325 nm; and nodakenin at 335 nm. The 18 marker compounds were reasonably well separated for quantitative analysis on a chromatogram without severe overlapping or interception of adjacent peaks(Fig. 2).
Fig. 2. Chromatograms of the 18 standard compounds (A) and OGT water extract (B). (1) Gallic acid, (2) oxypaeoniflorin, (3) (+)-catechin, (4) chlorogenic acid, (5) caffeic acid, (6) paeoniflorin, (7) ferulic acid, (8) liquiritin, (9) nodakenin, (10) 1,2,3,4,6-pentagalloylglucose, (11) coumarin, (12) ononin, (13) cinnamic acid, (14) cinnamaldehyde, (15) benzoylpaeoniflorin, (16) paeonol, (17) 6-gingerol, and (18) glycyrrhizin.
2. Method validation 1) System suitability
The system suitability was measured in terms of the capacity factor (k), relative retention (a), resolution (Rs), theoretical plate number (N), and symmetry factor (S) of the 18 marker compounds. The capacity factor ranged from 0.81 to 15.60. The relative retention was 1 < a <
4 and the resolutions of marker compounds were >
1.2, which indicate that the marker peaks were not severely overlapped by adjacent peaks and interference from other components. The number of theoretical plates was > 8944. The symmetry factor was 0.9 < S <
1.6, which demonstrated that peak fronting or tailing
was not found(Table 3).
Table 3. System suitability data
Compound k α Rs N S
Gallic acid 0.81 3.94 33.73 8944.47 0.98
Oxypaeoniflorin 3.18 1.03 1.22 66669.90 1.07
(+)-Catechin 3.26 1.03 1.22 57929.90 1.04
Chlorogenic acid 3.48 1.06 3.10 75069.98 1.11
Caffeic acid 3.99 1.15 7.64 79454.31 1.07
Paeoniflorin 4.94 1.25 12.25 65062.78 1.52
Ferulic acid 6.80 1.04 1.82 57503.58 1.02
Liquiritin 7.05 1.04 1.82 47476.51 1.29
Nodakenin 8.14 1.15 8.18 96048.90 0.99
1,2,3,4,6-Pentagalloylglucose 8.75 1.08 5.11 98953.30 1.13
Coumarin 9.59 1.10 5.35 50320.04 0.99
Ononin 11.41 1.21 15.28 503128.80 1.10
Cinnamic acid 12.77 1.10 13.58 268351.87 1.02
Cinnamaldehyde 13.39 1.05 5.89 293251.85 1.04
Benzoylpaeoniflorin 13.60 1.03 4.66 1234168.88 1.41
Paeonol 14.19 1.03 6.52 631799.59 1.07
6-Gingerol 15.57 1.02 3.65 1553984.63 1.10
Glycyrrhizin 15.60 1.02 3.65 655683.08 1.09
k, capacity factor; a, relative retention; Rs, resolution; N, theoretical plate; S, symmetry factor.
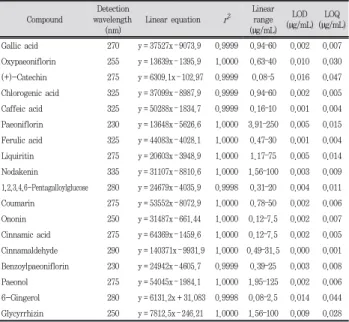
2) Linear regression, LOD, and LOQ
The linearity was represented as the correlation coefficient ( r
2) of compounds: it ranged from 0.9998 to 1.0000. The LOD and LOQ values were 0.000–0.016 µg/mL and 0.001–0.047 µg/mL, respectively(Table 4).
Table 4. Linear equation, correlation coefficients (
r
2), LOD ,and LOQ fo rthe marker compounds in OGTCompound
Detection wavelength
(nm)
Linear equation r
2Linear range (µg/mL)
LOD (µg/mL)
LOQ (µg/mL) Gallic acid 270 y = 37527x – 9073.9 0.9999 0.94–60 0.002 0.007 Oxypaeoniflorin 255 y = 13639x – 1395.9 1.0000 0.63–40 0.010 0.030 (+)-Catechin 275 y = 6309.1x – 102.97 0.9999 0.08–5 0.016 0.047 Chlorogenic acid 325 y = 37099x – 8987.9 0.9999 0.94–60 0.002 0.005 Caffeic acid 325 y = 50288x – 1834.7 0.9999 0.16–10 0.001 0.004 Paeoniflorin 230 y = 13648x – 5626.6 1.0000 3.91–250 0.005 0.015 Ferulic acid 325 y = 44083x – 4028.1 1.0000 0.47–30 0.001 0.004 Liquiritin 275 y = 20603x – 3948.9 1.0000 1.17–75 0.005 0.014 Nodakenin 335 y = 31107x – 8810.6 1.0000 1.56–100 0.003 0.009 1,2,3,4,6-Pentagalloylglucose 280 y = 24679x – 4035.9 0.9998 0.31–20 0.004 0.011 Coumarin 275 y = 53552x – 8072.9 1.0000 0.78–50 0.002 0.006 Ononin 250 y = 31487x – 661.44 1.0000 0.12–7.5 0.002 0.007 Cinnamic acid 275 y = 64369x – 1459.6 1.0000 0.12–7.5 0.002 0.005 Cinnamaldehyde 290 y = 140371x – 9931.9 1.0000 0.49–31.5 0.000 0.001 Benzoylpaeoniflorin 230 y = 24942x – 4605.7 0.9999 0.39–25 0.003 0.008 Paeonol 275 y = 54045x – 1984.1 1.0000 1.95–125 0.002 0.006 6-Gingerol 280 y = 6131.2x + 31.083 0.9998 0.08–2.5 0.014 0.044 Glycyrrhizin 250 y = 7812.5x – 246.21 1.0000 1.56–100 0.009 0.028 LOD, limit of detection; LOQ, limit of quantification; y, peak area (mAU); x, concentration of compound (µg/mL).
3) Precision, recovery, reproducibility, and stability The intra- and inter-day precisions were represented as RSD values < 4.0% in three concentration levels (Table 5). The recoveries of the 18 marker compounds were in the range 90.63–107.57 %, with RSD values <
4.0%, at three different spiked concentrations(Table 6).
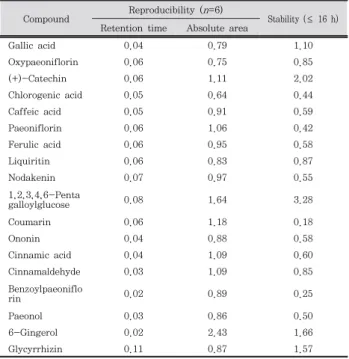
The reproducibility of the marker compounds was also represented as RSD values; < 0.2% for the retention time and < 2.5% for absolute area. The stability did not exceed 3.5 % of the RSD value (Table 7). These results indicate that the analytical method that was developed was precise, reproducible, and stable for the analysis of the 18 marker compounds in OGT samples.
Table 5. Intra- and inter-day precision of the 18 marker compounds in OGT
Compound
Spiked conc.
(µg/mL)
Intra-day (n=4)
Inter-day (n=4) Detected
conc.
(µg/mL) RSD
(%) Accuracy
(%)
Detected
conc.
(µg/mL) RSD
(%) Accuracy
(%)
Gallic acid
2.50 2.46 0.89 97.40
2.48 1.15 98.16
5.00 4.90 0.84 98.15 4.90 0.84 97.74
10.00 10.06 0.20 100.63 10.06 0.20 100.68
Oxypaeoniflorin
2.00 1.92 1.75 97.86 1.92 1.89 97.86
4.00 4.07 0.43 102.11 4.06 0.45 102.11
8.00 7.99 0.18 99.60 7.99 0.20 99.60
(+)-Catechin
0.50 0.50 1.64 100.99 0.50 1.05 100.99
1.00 0.97 1.56 94.85 0.96 1.29 94.85
2.00 2.02 0.28 101.23 2.02 0.25 101.23
Chlorogenic acid
2.50 2.49 0.55 99.57 2.47 1.00 99.57
5.00 4.87 0.48 97.68 4.86 0.72 97.68
10.00 10.07 0.10 100.61 10.08 0.23 100.61
Caffeic acid
1.00 0.98 0.65 98.02 0.99 0.75 98.02
2.00 1.90 1.34 96.24 1.89 2.21 96.24
4.00 4.05 0.32 101.06 4.06 0.47 101.06
Paeoniflorin
15.00 15.05 2.27 100.99 14.87 1.35 98.36 30.00 29.89 1.09 100.31 30.59 3.81 107.70 60.00 60.04 0.25 99.86 59.74 0.96 98.17
Ferulic acid
1.00 1.07 0.71 107.57 1.07 1.63 109.72
2.00 2.08 0.83 103.11 2.06 2.36 99.41
4.00 3.94 0.20 98.75 3.95 0.51 99.54
Liquiritin
3.00 3.00 1.47 100.40 3.00 1.78 100.40
6.00 5.97 0.87 98.45 5.98 0.86 98.45
12.00 12.02 0.26 100.36 12.01 0.23 100.36
Nodakenin
4.00 3.79 0.82 95.36 3.77 1.30 95.36
8.00 7.89 0.22 98.39 7.89 0.18 98.39
16.00 16.11 0.07 100.69 16.11 0.08 100.69
1,2,3,4,6-Pentagalloylglucose
0.50 0.51 1.97 99.22 0.50 2.00 99.22
1.00 1.05 1.21 105.33 1.06 1.69 105.33
2.00 1.97 0.23 98.72 1.97 0.36 98.72
Coumarin
1.00 1.07 0.64 107.47 1.07 0.73 107.47 2.00 2.10 0.28 105.23 2.11 0.29 105.23
4.00 3.93 0.09 98.23 3.93 0.04 98.23
Ononin
0.50 0.51 0.40 102.08 0.52 1.86 102.08
1.00 0.99 0.16 99.49 0.99 0.35 99.49
2.00 2.00 0.03 100.00 2.00 0.05 100.00
Cinnamic acid
0.50 0.49 1.86 98.84 0.50 2.09 98.84
1.00 1.01 0.65 101.77 1.01 1.02 101.77
2.00 2.00 0.15 99.63 2.00 0.19 99.63
Cinnamaldehyde
1.05 0.95 1.08 89.89 0.95 1.31 89.89
2.10 2.19 0.50 104.44 2.19 0.35 104.44
4.20 4.18 0.09 99.52 4.18 0.07 99.52
Benzoylpaeoniflorin
1.00 0.95 2.10 94.37 0.96 1.37 94.37
2.00 2.10 2.00 102.71 2.08 3.17 102.71
4.00 3.96 0.63 99.68 3.97 0.87 99.68
Paeonol
4.00 3.95 1.02 98.12 3.94 1.51 98.12
8.00 7.68 0.31 96.32 7.70 0.32 96.32
16.00 16.17 0.11 101.04 16.16 0.03 101.04
6-Gingerol
0.40 0.41 1.17 102.42 0.41 1.11 102.77
0.80 0.79 3.71 96.17 0.81 3.80 97.99
1.60 1.60 0.91 100.81 1.59 0.96 100.33
Glycyrrhizin
4.00 3.94 2.05 98.07 3.93 2.46 98.07
8.00 7.79 0.16 97.54 7.77 0.41 97.54
16.00 16.12 0.12 100.74
16.13 0.22 100.74
Conc., concentration; SD, standard deviation; RSD, relative standard
deviation (%) = (SD/mean) × 100.
Table 6. Recovery and repeatability of the 18 marker compounds in OGT (
n
=5)Compound Initial conc.
(µg/mL)
Spiked conc.
(µg/mL)
Detected conc.
(µg/mL)
Recovery (%)
RSD (%)
Gallic acid 9.77
2.50 12.25 99.17 1.77
5.00 14.75 99.69 0.91
10.00 20.02 102.52 1.06
Oxypaeoniflorin 6.32
2.00 8.19 93.95 2.84
4.00 10.30 99.64 1.10
8.00 14.15 97.92 0.37
(+)-Catechin 0.94
0.50 1.44 99.11 2.67
1.00 1.94 99.69 1.96
2.00 3.04 104.72 1.25
Chlorogenic acid 9.84
2.50 12.21 94.79 1.29
5.00 14.54 94.04 1.61
10.00 19.63 97.92 1.11
Caffeic acid 1.17
1.00 2.16 98.88 1.10
2.00 3.17 99.97 0.42
4.00 5.48 107.57 0.95
Paeoniflorin 67.60
15.00 82.57 99.82 1.85
30.00 97.81 100.70 1.36
60.00 128.08 100.80 1.52
Ferulic acid 2.95
1.00 4.03 108.26 1.06
2.00 4.98 101.42 1.63
4.00 6.72 94.20 0.55
Liquiritin 12.41
3.00 15.31 96.69 1.81
6.00 18.14 95.49 1.44
12.00 23.92 95.97 2.30
Nodakenin 15.97
4.00 19.70 93.38 2.09
8.00 23.95 99.75 1.18
16.00 32.51 103.35 0.88
1,2,3,4,6-Pentagalloylglucose 1.94
0.50 2.47 104.49 2.62
1.00 2.99 104.30 0.77
2.00 3.89 97.35 0.71
Coumarin 3.60
1.00 4.66 105.64 0.49
2.00 5.59 99.31 0.61
4.00 7.23 90.63 0.58
Ononin 0.94
0.50 1.46 105.33 0.87
1.00 1.95 101.35 0.20
2.00 2.97 101.56 0.20
Cinnamic acid 0.92
0.50 1.43 101.13 2.42
1.00 1.97 105.07 1.35
2.00 2.99 103.57 0.41
Cinnamaldehyde 6.56
1.05 7.52 91.58 1.24
2.10 8.81 107.03 0.67
4.20 10.87 102.59 0.44
Benzoylpaeoniflorin 2.75
1.00 3.70 94.89 0.62
2.00 4.80 102.63 1.67
4.00 6.73 99.66 2.65
Paeonol 23.68
4.00 27.54 96.55 0.94
8.00 31.35 95.89 0.90
16.00 40.00 102.01 0.73
6-Gingerol 0.13
0.40 0.51 96.66 2.47
0.80 0.87 93.10 1.56
1.60 1.67 96.42 0.36
Glycyrrhizin 13.42
4.00 17.43 100.16 3.78
8.00 21.40 99.75 1.34
16.00 30.07 104.05 1.14
Conc., concentration; RSD, relative standard deviation (%) = (SD/mean) ×100.
Table 7. Reproducibility and stability of the 18 marker compounds (RSD, %)
Compound Reproducibility ( n =6)
Stability (≤ 16 h) Retention time Absolute area
Gallic acid 0.04 0.79 1.10
Oxypaeoniflorin 0.06 0.75 0.85
(+)-Catechin 0.06 1.11 2.02
Chlorogenic acid 0.05 0.64 0.44
Caffeic acid 0.05 0.91 0.59
Paeoniflorin 0.06 1.06 0.42
Ferulic acid 0.06 0.95 0.58
Liquiritin 0.06 0.83 0.87
Nodakenin 0.07 0.97 0.55
1,2,3,4,6-Penta
galloylglucose 0.08 1.64 3.28
Coumarin 0.06 1.18 0.18
Ononin 0.04 0.88 0.58
Cinnamic acid 0.04 1.09 0.60
Cinnamaldehyde 0.03 1.09 0.85
Benzoylpaeoniflo
rin 0.02 0.89 0.25
Paeonol 0.03 0.86 0.50
6-Gingerol 0.02 2.43 1.66
Glycyrrhizin 0.11 0.87 1.57
RSD, relative standard deviation (%) = (standard deviation/mean) × 100.
3. Quantification of the 18 marker compounds in OGT samples
The validated method was successfully applied to determine and quantify the 18 marker compounds in OGTWE and two commercial OGT granules (OGT01 and OGT02)(Fig. 3).
Fig. 3. Chromatograms of OGT water extract and OGT commercial granules at 250 nm. (A) OGT water extract, (B) OGT01 (commercial OGT granules), and (C) OGT02 (commercial OGT granules).
In OGTWE, the amount of paeoniflorin was highest, followed by paeonol, while the amounts of 6-gingerol, (+)-catechin, ononin, and cinnamic acid were lowest.
The amount of paeoniflorin was more than 500-fold
compared to that of 6-gingerol. Furthermore, paeoniflorin
and gallic acid were present in higher amounts, while
ferulic acid and paeonol were present in lower amounts,
in two commercial OGT granules in which (+)-catechin,
caffeic acid, coumarin, cinnamaldehyde, and paeonol were
not detected (and hence it was not possible to quantify
these compounds). In addition, 1,2,3,4,6-pentagalloylglucose
was not detected in the OGT01(Table 8).
Table 8. Quantification of the 18 marker compounds in OGT samples
Compound Content (mg/g)
aOGTWE OGT01 OGT02
Gallic acid 0.985 ± 0.007 1.332 ± 0.007 1.649 ± 0.005 Oxypaeoniflorin 0.632 ± 0.005 0.095 ± 0.004 0.047 ± 0.001
(+)-Catechin 0.094 ± 0.002 ND ND
Chlorogenic acid 0.987 ± 0.001 0.064 ± 0.001 0.054 ± 0.000
Caffeic acid 0.117 ± 0.000 ND ND
Paeoniflorin 6.783 ± 0.023 2.818 ± 0.043 1.629 ± 0.067 Ferulic acid 0.295 ± 0.001 0.008 ± 0.000 0.006 ± 0.000
Liquiritin 1.250 ± 0.006 0.237 ± 0.004 0.281 ± 0.002
Nodakenin 1.599 ± 0.010 0.078 ± 0.001 0.106 ± 0.002
1,2,3,4,6-Pentagalloylglucose 0.191 ± 0.004 ND 0.016 ± 0.000
Coumarin 0.361 ± 0.000 ND ND
Ononin 0.094 ± 0.001 0.042 ± 0.000 0.041 ± 0.000
Cinnamic acid 0.093 ± 0.001 0.012 ± 0.000 0.012 ± 0.000
Cinnamaldehyde 0.661 ± 0.004 ND ND
Benzoylpaeoniflorin 0.275 ± 0.001 0.102 ± 0.001 0.046 ± 0.000
Paeonol 2.377 ± 0.003 0.006 ± 0.000 0.002 ± 0.000
6-Gingerol 0.013 ± 0.000 ND ND
Glycyrrhizin 1.342 ± 0.023 0.195 ± 0.002 0.103 ± 0.006
a
Content is represented as 'average ± standard deviation'.
ND, not detected; OGTWE, OGT water extract; OGT01 and OGT02, commercial granules from Korean manufacturers.
Variations in the amounts of the marker compounds were also found between samples. Gallic acid was the only compound that was present in a significantly higher amount in the commercial granules than in OGTWE, while the amounts of most detectable compounds in the commercial samples were significantly lower than those of OGTWE. The difference in the amounts of the marker compounds between OGT samples was about 2 –1200-fold(Fig. 4).
Fig. 4. One-way ANOVA using the Tukey test of the 18 marker compounds among samples with 95% family-wise confidence level.
4. Pearson correlation efficient and PCA of OGT samples
The relationship between OGT samples was represented by the Pearson correlation coefficient, using the
quantification results. In the box plot, the median value of the coefficient of OGTWE was low compared with the values of the two commercial OGT granules(Fig. 5).
Fig. 5. Pearson coefficient of OGT samples. OGTWE, OGT water extract; OGT01–OGT02, commercial OGT granules
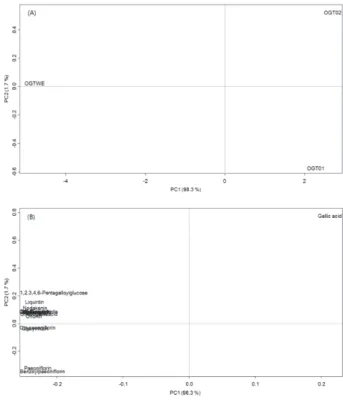
PCA results showed a distinct relationship between OGT samples. In the score plot, OGTWE was clearly separated from two commercial OGT samples by principal component 1 (PC1) with high total variance (98.3%). Principal component 2 (PC2) score further divided the commercial granules into positive and negative scores, with an insignificant effect on total variance (1.7%) (Fig. 6A). Of the 18 marker compounds on loading plot, only gallic acid was positioned at a positive PC1 score, while the 17 compounds were all positioned at a negative PC1 score(Fig. 6B).
Fig. 6. Score plot (A) and loading plot (B) of principal components (PC1 vs. PC2) on the variables (amounts of the 18 marker compounds) with the objectives (OGT samples). PC1 and PC2 contributed to 98.3% and 1.7% of total variance, respectively. OGTWE, OGT water extract; OGT01–OGT02, commercial OGT granules.