Prognostic factors associated with the success rates of posterior orthodontic miniscrew implants:
A subgroup meta-analysis
Objective: To systematically review previous studies and to assess, via a subgroup meta-analysis, the combined odds ratio (OR) of prognostic factors affecting the success of miniscrew implants (MIs) inserted into the buccal posterior region. Methods: Three electronic searches that were limited to articles on clinical human studies using MIs that were published in English prior to March 2015 were conducted. The outcome measure was the success of MIs. Patient factors included age, sex, and jaw of insertion (maxilla vs.
mandible), while the MI factors included length and diameter. A meta-analysis was performed on 17 individual studies. The quality of each study was assessed for non-randomized studies and quantified using the Newcastle-Ottawa Scale.
The meta-analysis outcome was a combined OR. Subgroup and sensitivity analyses based on the study design, study quality, and sample size of miniscrews implanted were performed. Results: Significantly higher success rates were revealed for MIs inserted in the maxilla, for patients ≥ 20 years of age, and for long MIs (≥ 8 mm) and MIs with a large diameter (> 1.4 mm). All subgroups acquired homogeneity, and the combined OR of the prospective studies (OR, 3.67; 95% confidence interval [CI], 2.10−6.44) was significantly higher in the maxilla than that in the retrospective studies (OR, 2.10; 95% CI, 1.60−2.74).
Conclusions: When a treatment plan is made, these risk factors, i.e. jaw of insertion, age, MI length, and MI diameter, should be taken into account, while sex is not critical to the success of MIs.
[Korean J Orthod 2016;46(2):111-126]
Key words: Subgroup meta-analysis, Miniscrew implant, Success rate, Prognostic factor
Sung-Bin Hong
aBudi Kusnoto
bEun-Jeong Kim
aEllen A BeGole
bHyeon-Shik Hwang
c,dHoi-Jeong Lim
c,da
Private Practice, Gwangju, Korea
b
Department of Orthodontics, College of Dentistry, University of Illinois at Chicago, IL, USA
c
Department of Orthodontics, School of Dentistry, Chonnam National University, Gwangju, Korea
d
Dental Science Reseach Institute, Chonnam National University, Gwangju, Korea
Received April 20, 2015; Revised July 26, 2015; Accepted July 29, 2015.
Corresponding author: Hoi-Jeong Lim.
Professor, Department of Orthodontics, School of Dentistry, Dental Science Research Institute, Chonnam National University, 33 Yongbong-ro, Buk-gu, Gwangju 61186, Korea.
Tel +82-62-530-5830 e-mail [email protected]
© 2016 The Korean Association of Orthodontists.
The authors report no commercial, proprietary, or financial interest in the products or companies described in this article.
This is an Open Access article distributed under the terms of the Creative Commons Attribution Non-Commercial License (http://creativecommons.org/licenses/by-nc/4.0) which permits unrestricted non-commercial use, distribution, and reproduction in any medium, provided the original work is properly cited.
pISSN 2234-7518 • eISSN 2005-372X
http://dx.doi.org/10.4041/kjod.2016.46.2.111
INTRODUCTION
Although many studies have investigated the various prognostic factors affecting the success of miniscrew implant (MI) insertion, conflicting results have made the identification of critical factors difficult. For instance, while some studies did not identify any significant differences between the success rates of MIs inserted in the mandible and those inserted in the maxilla,
1-3others found that MIs inserted in the maxilla had higher success rates compared to MIs inserted in the man dible.
4Similarly, conflicting results have been reported with respect to sex,
2,5-7age,
6-8MI length,
8,9and MI diameter.
4,10To identify patterns among the results of different studies, a meta-analysis can be applied. Meta-analyses are able to combine the outcomes of multiple studies into a single quantitative estimate, although statistical heterogeneity remains inevitable because of clinical and methodological differences among the studies. For example, Dalessandri et al.
11performed a meta-analysis to investigate the factors that influence the success rates of temporary skeletal anchorage devices and found that treatment effects based on the patients’ sex and age and on the MI insertion site among the studies were heterogeneous, and stated that this heterogeneity made it difficult to form conclusions. Thus, since the results of meta-analyses obtained by combining such heterogeneous effects are prone to errors, it is necessary to specify a procedure to identify or eliminate the source of heterogeneity when evaluating the outcomes obtained from diverse studies. En-masse retraction, canine retraction, and intrusion of posterior teeth are the three most common utilizations of the miniscrew.
Clinically, placing the miniscrews in the buccal regions is easier, less variable, and more consistent. Since inconsistent success rates can contribute to the hetero- geneity, the present meta-analysis was performed on the success rates of MIs placed in the buccal area only.
The aim of this study was to systematically review previous studies that addressed prognostic factors affecting the success of MIs inserted into the buccal posterior region. Specifically, we assessed the combined odds ratio (OR) of the success of MIs with respect to factors such as sex, age, jaw of insertion (mandible or maxilla), MI length, and MI diameter via a subgroup meta-analysis based on the study design, study quality, and sample size of miniscrews implanted.
MATERIALS AND METHODS
Procedures for the meta-analysis complied with the Cochrane Handbook for Systematic Reviews of Interven- tions and the PRISMA statement.
12MEDLINE (PubMed), Scopus, and Web of Science electronic searches for
articles in English on clinical human studies published from January 2003 to March 2015 were conducted using the following search terms: factor(s), screw(s), implant(s), anchorage, success, stability, miniscrew(s), microimplant(s), and microscrew(s) (Appendix 1).
Morrison et al.
13found that language other than English (LOE) studies tend to have lower quality and exaggerated treatment effects than studies in English, and a few LOE studies included in the meta-analysis can not represent all the LOE studies. Hence, the studies were limited to English since LOE studies may impose a bias in systematic review based meta-analyses and the quality of meta-analysis relies mainly on the quality of included studies.
13,14In addition, manual searches of the reference list of electronically detected articles were performed, and a grey literature search was carried out using Google Scholar.
Study selection
The searches and article selection were performed by three independent authors (SBH, EJK, and BK).
Two authors (SBH and EJK) independently made a preliminary list of articles by screening the titles and abstracts for the meta-analysis and evaluated the full manuscript of studies with appropriate inclusion criteria to make a decision; Cohen’s kappa was 0.88, indicating almost perfect inter-rater agreement. Discordance in article selection was resolved by debate and consultation with another author (BK). As a result, 17 articles were selected for the analyses.
Inclusion criteria
The outcome measure was converted into a dicho- tomous value: 0 for loosened MIs, and 1 for unloosened MIs. Unloosed MIs were considered successful, while loosened MIs were considered unsuccessful. Five confounding factors were divided into two categories:
patient factors and MI factors. The patient factors were age (< 20 years vs. ≥ 20 years), sex (male vs. female), and the jaw of insertion (maxilla vs. mandible), while the MI factors were length (< 8 mm vs. ≥ 8 mm) and diameter (≤ 1.4 mm vs. > 1.4 mm). The following criteria were used to select the articles: 1) studies on the stability of screws and implants when both items were used for orthodontic anchorage; 2) human clinical studies; 3) prospective and retrospective studies; 4) studies on MIs inserted into the posterior buccal region;
and 5) studies that reported the success rates of MIs or explicitly included information that would enable a computation of the success rate with regards to any of the five confounding factors.
Exclusion criteria
Exclusion criteria included articles related to the
following: (1) systematic review or meta-analysis, (2) patient satisfaction, (3) orthognathic surgery, (4) radiographic evaluation, (5) microbiology, (6) case report, (7) in vitro studies, (8) literature review, (9) only one article from a particular research group, (10) studies based on the five confounding factors that used different dichotomizations (e.g., the age division of < 18 years vs. ≥ 18 years), and (11) studies on MIs inserted into the retromolar pad, lingual side, or palatal side. Since one of the assumptions of the meta-analysis was independence between studies, studies from specific authors were included only once and studies from coauthors of the chosen studies were excluded.
Data extraction
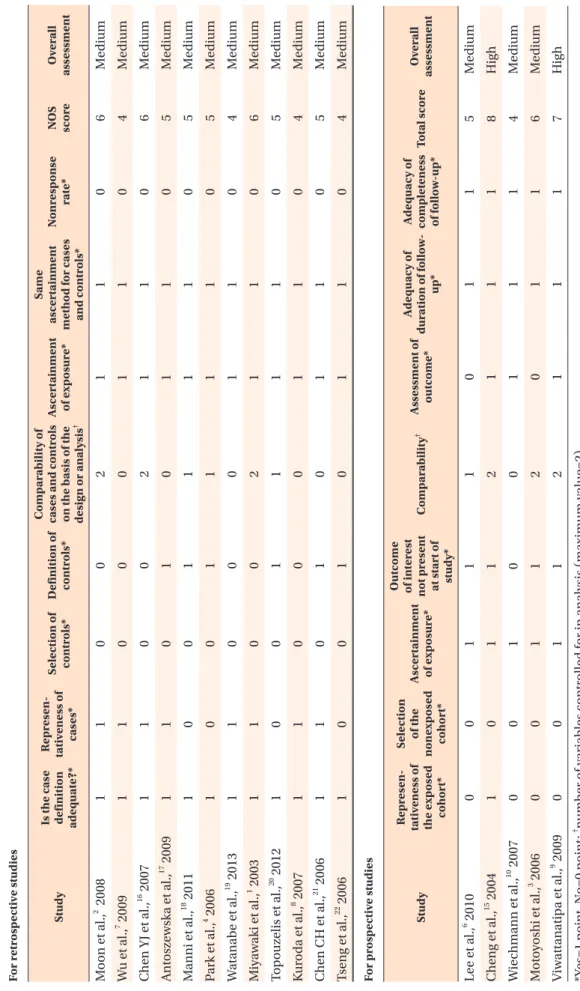
The following information was extracted from the 17 included studies: the first author’s name, publication year, study design, type of temporary anchorage device (TAD), diameter and length of the MIs, number of patients, mean age of the patients, number of TADs, number of successes, success rate, definition of success and failure (Table 1).
1-4,6-10,15-22The ORs of the success of MIs with respect to these factors were directly calculated using the number of stable MIs and the number of inserted MIs for each category. The ORs calculated from the raw data were double-checked by two authors (SBH, HJL). The success of MIs was defined as the absence of clinically detectable mobility when the orthodontic force applied by a clinician was sustained regardless of the predetermined period, as the predetermined period varied between studies (Table 1).
1-4,6-10,15-22Quality assessment
The quality of the studies was assessed for non- randomized studies and then quantified using the 9-star Newcastle-Ottawa Scale (NOS),
23which is re- commended by the Cochrane collaboration. The study quality was evaluated as being low (0−3 points), medium (4−6 points), or high (7−9 points). The NOS includes eight criteria for evaluating the quality of the included studies (Table 2),
1-4,6-10,15-22and these criteria are based on the following three categories: subject selection, comparability between groups, and outcome measurement. Any dis agreements were resolved by consensus.
Meta-analysis
The outcome of the meta-analysis was expressed as a combined OR since the OR can be used as the effect size for the three major study designs: cross- sectional, prospective, and retrospective.
24,25The OR in each study was defined as the ratio of the odds (success/failure) of the MIs in two categories: patient factors and MI factors. In the jaw, an OR greater than
1 indicates that successful MIs are more likely to be located in the maxilla (jaw = 1), whereas an OR less than 1 indicates that successful MIs are more likely to be located in the mandible (jaw = 0). Heterogeneity was tested by the Cochran Q and I
2statistic; if the p-value of the Q test is greater than 0.10, then no significant heterogeneity exists. It was tentatively suggested that low heterogeneity may be associated with I
2values of less than 30%, while substantial heterogeneity may be associated with I
2values of over 50%; if significant heterogeneity was identified, then additional subgroup and sensitivity analyses were performed and a qualitative review of the study was conducted until the causes of the heterogeneity were clearly determined.
Subgroup meta-analysis
The studies included in the meta-analysis differed in terms of their study design, participant characteristics, and treatment goals. Variability among these studies in a systematic review may be taken as heterogeneity. To investigate the source of the heterogeneity, a subgroup analysis can be used to answer specific questions about particular groups of patients, the type of intervention, or the type of study. In this study, subgroups were created based on the study design (retrospective study vs.
prospective study), study quality (medium vs. high), and sample size of miniscrews implanted (< 200 vs. ≥ 200).
A meta-analysis was performed for each subgroup, and the results were reported separately.
Sensitivity analysis
A sensitivity analysis is a collective method for verifying the robustness of results. We performed sensitivity analyses to assess the impact of each study on the combined effect size. The meta-analysis was repeatedly performed as follows: a meta-analysis that included all studies except the first study was performed followed by a meta-analysis that included all studies except the second study and so on until each study was excluded once. If the statistical significance of the result was influenced by removing one of the studies, the removed study was reviewed again to confirm the source of the heterogeneity.
Publication bias
Funnel plots have been widely used to detect the potential publication bias of studies in a meta-analysis.
However, because the visual interpretation of funnel plots largely depends on the subjective impression of the observer,
26Begg’s rank correlation test
27and Egger’s linear regression test
28were used as more objective tests to detect publication bias in the present meta-analysis.
Significant results (p < 0.05) suggest publication bias.
Bias-corrected estimates were calculated using the
Table 1. Gener al char acteristics of the studies included in the meta-analysis A uth or , ye ar St u dy de sig n, typ e of T AD D iam et er (mm) Leng th (mm) P atien t (n) Ag e (yr) * N o of TA D N o of Su cc ess Su cc ess rat e (%) D efinition of Su cc ess D efinition of f ailur e 1 L ee et al.
62010 Pr os p ectiv e M inis cr ew 1.8 8.5 141 27 260 238 91.54 NA NA 2 C hen g et al.
152004 Pr os p ectiv e M inis cr ew 2.0 5/7/9/11/ 13/15 44 29.0 ± 8.9 140 125 89.29 A bs ence of infl amm ation and clinic all y det ecta ble mobilit y of sus tainin g the anc hor ag e function
NA 3 W ie chm ann et al.
102007 Pr os p ectiv e M icr oim pl an ts 1.1/1.6 5/6/7/8/10 49 26.9 ± 8.9 133 102 76.69 A bs ence of infl amm ation and clinic all y det ecta ble mobilit y, ca p abilit y of s us tainin g the anc hor ag e function
NA 4 M ot oy oshi et al.
32006 Pr os p ectiv e M icr oim pl an ts 1.6 8 41 24.9 ± 6.5 124 106 85.48 E ndur ed or tho don tic for ce for 6 mon ths or mor e L oos ene d b efor e 6 mon ths 5 V iw at tan atip a et al.
92009 Pr os p ectiv e M inis cr ew 1.2 8/10/12 49 23.2 97 65 89.04 NA R em ar ka ble mobilit y dis lo d gemen t, infe ction 6 M oon et al.
22008 R etr os p ectiv e M inis cr ew 1.6 8 209 20.3 480 402 83.75 Did not sho w an y mobilit y aft er fir st 8 mon th NA 7 W u et al.
72009 R etr os p ectiv e M ini-im pl an ts 1.1–1.5/1.7/2.0 7/8/10/11/ 12/13/14/15 166 26.5 ± 8.9 414 372 89.86 NA L oos ene d w ithin 6 mon th or fr act ur ed dur in g ins er tion 8 C hen YJ et al.
162007 R etr os p ectiv e M inis cr ew/ micr os cr ew
2.0/1.2 5–21/6–10 129 24.5 ± 7.1 359 306 85.20 NA L oos ene d dur in g tr ea tmen t 9 An tos zews ka et al.
172009 R etr os p ectiv e M inis cr ew 1.2–1.3/1.2–1.6 6/8 141 NA 350 327 93.43 A bs ence of infl amm ation and clinic all y det ecta ble mobilit y, ca p abilit y of s us tainin g the anc hor ag e function
Se ver e c linic al mobilit y, los s of MI while c he ck in g its mobilit y w ith the cot ton t w ee zer s les s th an 8 mon th 10 M anni et al.
182011 R etr os p ectiv e M inis cr ew 1.5/1.3 9/11 132 23.2 300 243 81.00 A bs ence of infl amm ation and clinic all y s ig ns of lo os enin g C linic al s ig ns of infl amm ation, ins ta bilit y of the minis cr ew 11 Par k et al.
42006 R etr os p ectiv e M inis cr ew 1.2/2.0 4/5/6/7/8/ 10/12/14/15 87 15.5 ± 8.3 227 208 91.63 M ain taine d t o the end of tr ea tmen t or to in ten tion al r emo val L oos ene d dur in g tr ea tmen t 12 W atan ab e et al.
192013 R etr os p ectiv e M inis cr ew 1.4 5/6/8 107 21.0 190 162 85.26 NA Sho w ed mobilit y or faile d w ithin 1 y ear of pl acemen t 13 M iy aw ak i et al.
12003 R etr os p ectiv e M inis cr ew 1.0/1.5/2.3 6/11/14 51 21.8 ± 7.8 134 104 77.61 If or tho don tic for ce co uld b e a pplie d for 1 y ear NA 14 Top ou zelis et al.
202012 R etr os p ectiv e M inis cr ew 1.2/1.4 8/10 34 27.2 ± 7.3 82 74 90.24 N o infl amm ation or c linic all y det ecta ble mobilit y pr es en t nor an y den tal r oot d am ag e
Infe ction, dis lo d gemen t or rem ar ka ble mobilit y th at co uld not s us tain or tho don tic for ce 15 K ur od a et al.
82007 R etr os p ectiv e M inis cr ew 1.3/2.0/2.3 6/7/8/10/ 11/12 75 21.8 ± 8.2 79 70 88.61 A pplie d t o the s keletal anc hor ag e for 1 y ear NA 16 C hen CH et al.
212006 R etr os p ectiv e M icr oim pl an ts 1.2 6/8 29 29.8 59 50 84.75 K eep the r et en tion of anc hor s, abs ence of infl amm ation, no den tal ro ot d am ag e
Se ver e mobilit y, p er sis tence of infe ction of infl amm ation 17 Ts en g et al.
222006 R etr os p ectiv e M ini-im pl an ts 2.0 8/10/12/14 25 29.9 45 41 91.11 R es is t or tho don tic for ce un til com pletion of the or tho don tic tr ea tmen t, no infl amm ation or infe ction
Se ver e mobilit y, p er sis tence of infe ction of infl amm ation MI, M inis cr ew im pl an t; T AD , t em p or ar y anc hor ag e de vice; N A , not a vail able . *M ean or me an ± s tand ar d de vi ation.
Table 2. Newcastle-Ottawa Scale (NOS) summary assessment of risk of bias For r etr osp ectiv e st u die s Stu dy Is th e cas e definition ade
quat e?*
R epr es en- tativ en ess of cas es* Sele ction of con tr ols* D efinition of con
tr ols*
Comp ar abil ity of cas es an d c on tr ols on th e b asis of th e de sig n or an al ysis
†As cert ainm en t of ex p os ur e*
Sam e as cert ainm en t m eth od for cas es an d c on tr ols*
N onr esp ons e rat e* NO S sc ore O ver all ass essm en t M oon et al.,
22008 1 1 0 0 2 1 1 0 6 M edium W u et al.,
72009 1 1 0 0 0 1 1 0 4 M edium C hen YJ et al.,
162007 1 1 0 0 2 1 1 0 6 M edium An tos zews ka et al.,
172009 1 1 0 1 0 1 1 0 5 M edium M anni et al.,
182011 1 0 0 1 1 1 1 0 5 M edium Par k et al.,
42006 1 0 0 1 1 1 1 0 5 M edium W atan ab e et al.,
192013 1 1 0 0 0 1 1 0 4 M edium M iy aw ak i et al.,
12003 1 1 0 0 2 1 1 0 6 M edium Top ou zelis et al.,
202012 1 0 0 1 1 1 1 0 5 M edium K ur od a et al.,
82007 1 1 0 0 0 1 1 0 4 M edium C hen CH et al.,
212006 1 1 0 1 0 1 1 0 5 M edium Ts en g et al.,
222006 1 0 0 1 0 1 1 0 4 M edium For pr osp ectiv e st u die s Stu dy
R epr es en- tativ en ess of th e ex p os ed co h ort*
Sele ction of th e n on ex p os ed co h ort*
As cert ainm en t of ex p os ur e*
O ut com e of in ter est n ot pr es en t at st art of st u dy*
Comp ar abil ity
†Ass essm en t of out com e* A de qua cy of dur ation of follo w- up*
A de qua cy of complet en ess of follo w-up* Tot al s cor e O ver all ass essm en t L ee et al.,
62010 0 0 1 1 1 0 1 1 5 M edium C hen g et al.,
152004 1 0 1 1 2 1 1 1 8 Hi gh W ie chm ann et al.,
102007 0 0 1 0 0 1 1 1 4 M edium M ot oy oshi et al.,
32006 0 0 1 1 2 0 1 1 6 M edium V iw at tan atip a et al.,
92009 0 0 1 1 2 1 1 1 7 Hi gh *Y es=1 p oin t, N o=0 p oin t;
†n um b er of v ar ia bles con tr olle d for in an al ys is (m ax im um v alue=2).
trim-and-fill method, which accounts for unpublished data by imputing missing studies to yield an unbiased estimate of the effect size.
Meta-analyses and sensitivity analyses were performed using RStudio (ver. 0.96.315; RStudio Inc., Boston, MA, USA) and Comprehensive Meta-Analysis software (ver.
2.0; Biostat, Englewood, NJ, USA).
RESULTS
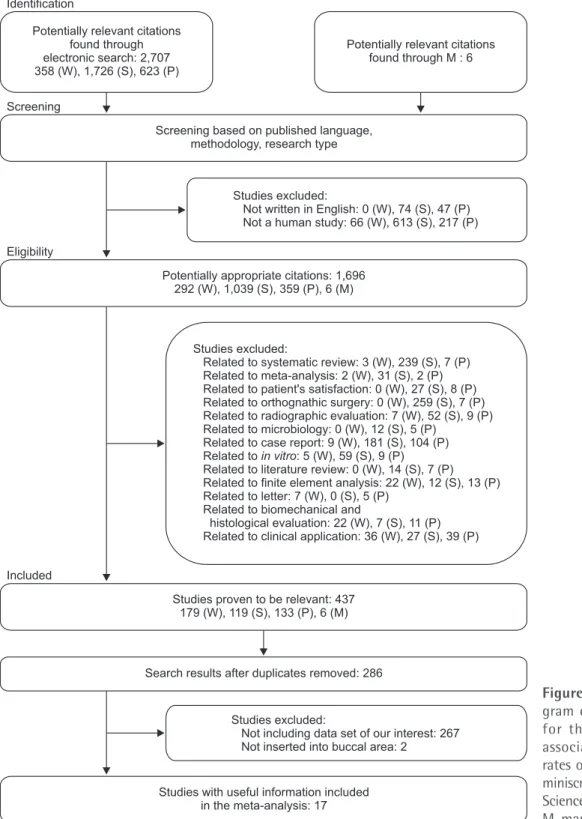
The preliminary electronic search identified 2,707 relevant articles. Articles that were not in English and that were not human clinical studies were excluded.
Among the remaining 1,696 articles, additional articles were excluded from based on the aforementioned exclusion criteria. After removing duplicate publications, 286 articles remained and were manually reviewed to determine whether they provided information that would facilitate the computation of the MI success rate with respect to any of the five confounding factors.
Finally, 17 articles that satisfied all of the inclusion criteria were selected (Figure 1); a list of the included studies is shown in Table 1.
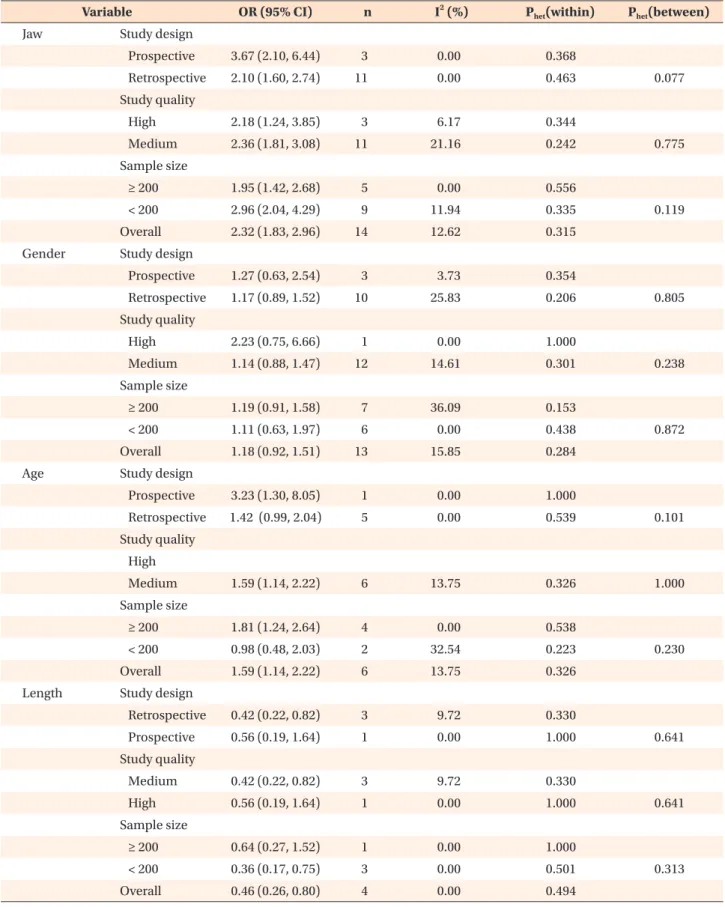
1-4,6-10,15-22To investigate differences in the MI success rates with regards to the jaw of insertion (maxilla vs. mandible), 14 studies were used; three studies were excluded since they did not provide success rates that specified the jaw of insertion. Given the homogeneity (p
het[within] > 0.1) demonstrated by the 14 studies, the combined OR of 2.32 (95% confidence interval [CI], 1.81−4.08) indicated that MIs inserted in the maxilla had a significantly higher success rate (2.32 times higher) compared to MIs inserted in the mandible. The subgroups that were based on the study design, study quality, and sample size each acquired homogeneity (I
2< 25% and p
het[within]
> 0.1). The combined OR of the prospective studies was higher (OR, 3.67; 95% CI, 2.10−6.44) than that of the retrospective studies (OR, 2.10; 95% CI, 1.60−2.74), and the treatment effects differed between the subgroups (p
het[between] = 0.077 < 0.1). The combined OR of high- quality studies (OR, 2.18; 95% CI, 1.24−3.85) was lower than that of medium-quality studies (OR, 2.36; 95%
CI, 1.81−3.08), though the treatment effects did not differ between the subgroups (p
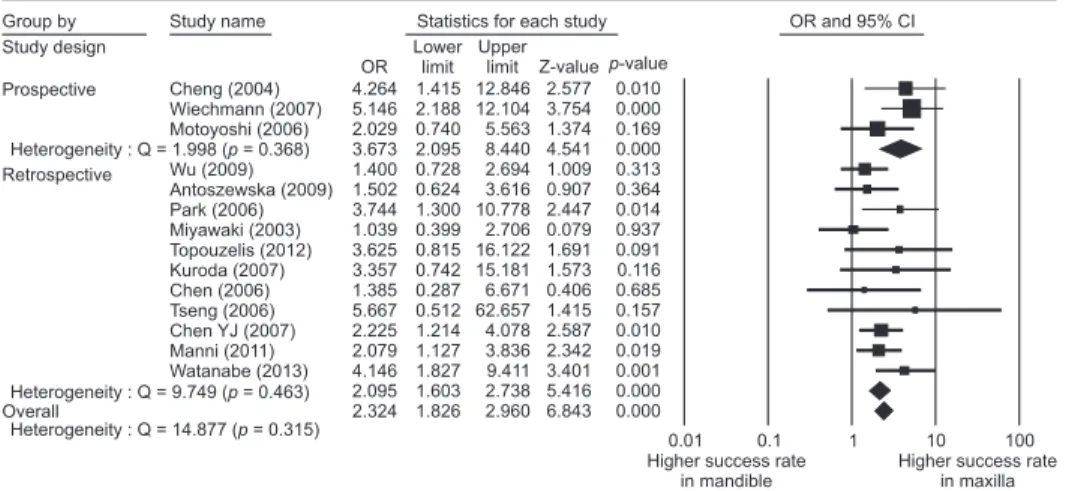
het[between] > 0.1). The subgroup of five studies with sample sizes of more than 200 MIs had a combined OR of 1.95 (95% CI, 1.42−2.68), while the subgroup of nine studies with sample sizes of less than 200 MIs had a combined OR of 2.96 (95% CI, 2.04−4.29). Consequently, the subgroup meta-analysis revealed significantly higher success rates in the maxilla than in the mandible. Moreover, the sensitivity analysis showed that none of the studies significantly changed the overall results of the subgroup analysis (Table 3, Figure 2).
In another meta-analysis investigating the difference in MI success rates according to sex, 13 of the 17 studies were considered; four studies were excluded since they did not provide the success rates according to sex.
Given the homogeneity (p
het[within] > 0.1) demonstrated by the 13 studies, the combined OR of 1.18 (95% CI, 0.92−1.51) indicated that the success rates were not significantly different between the two sexes. The subgroup of prospective studies showed homogeneity (I
2= 3.73 and p
het[within] > 0.1), with a combined OR of 1.27 (95% CI, 0.63−2.54). The subgroup of retrospective studies also showed homogeneity (I
2= 25.83 and p
het[within] = 0.206 > 0.1) and had a combined OR of 1.17 (95% CI, 0.89−1.52). Accordingly, no significant sex difference was found with regards to the MI success rate in either subgroup. Similar results were obtained in the subgroup analyses based on study quality and sample size. Furthermore, the sensitivity analyses of the subgroups showed that none of the studies significantly changed the overall results (Table 3, Figure 3A).
For the meta-analysis investigating differences in the MI success rates according to patient age, six studies were considered. Most of the excluded studies reported only the mean age and standard deviation, while the study by Moon et al.
2was excluded because of a different age dichotomization (over/under 18 years of age). Additionally, the study by Miyawaki et al.
1was excluded because the number of patients was used to calculate the frequency of the age categories instead of the number of TADs, unlike the other studies included in the present meta-analysis. Based on the homogeneity (p
het[within] > 0.1) demonstrated by the six studies, the combined OR of 1.59 (95% CI, 1.14−2.22) indicated that MIs inserted in patients who were 20 years of age and over had a significantly higher success rate (1.53 times higher) than did MIs inserted in patients who were under the age of 20 years. A subgroup of one prospective study and another subgroup of retrospective studies acquired homogeneity (I
2= 0.00 and p
het[within]
> 0.1). The combined OR of the prospective study (OR, 3.23; 95% CI, 1.30−8.05) was higher than that of the retrospective studies (OR, 1.42; 95% CI, 1.03−1.96), but treatment effects did not differ between the subgroups (p
het[between] = 0.101 > 0.1) (Table 3, Figure 3B).
For the meta-analysis investigating the difference in MI success rates based on MI length, four studies that collectively included 628 MIs were used. Most of the individual studies considered in our meta-analysis reported success rates based on MI length, though some of the excluded studies used only long MIs (≥ 8 mm),
1,4-6,10,14,25while others did not provide success rates according
to MI length that were restricted to the posterior
region. Based on the homogeneity (p
het[within] > 0.1)
demonstrated by the four studies, the combined OR of
0.46 (95% CI, 0.26−0.80) indicated that long MIs (≥ 8 mm) had success rates that were 2.17 (= 1/0.46) times higher than the rates obtained with short MIs (< 8 mm).
While the combined OR of the prospective study (OR, 0.56;
95% CI, 0.19−1.64) indicated no significant differences between long and short MIs, the combined OR of the
retrospective studies (OR, 0.42; 95% CI, 0.22−0.82) indicated that long MIs had significantly higher success rates than did short MIs. Homogeneity was also obtained in all subgroups based on the study design, study quality, and sample size (I
2< 25%) (Table 3, Figure 3C).
In the meta-analysis evaluating the difference in MI
Identification
Potentially relevant citations found through electronic search: 2,707 358 (W), 1,726 (S), 623 (P)
Potentially relevant citations found through M : 6
Studies excluded:
Not written in English: 0 (W), 74 (S), 47 (P) Not a human study: 66 (W), 613 (S), 217 (P)
Studies excluded:
Related to systematic review: 3 (W), 239 (S), 7 (P) Related to meta-analysis: 2 (W), 31 (S), 2 (P) Related to patient's satisfaction: 0 (W), 27 (S), 8 (P) Related to orthognathic surgery: 0 (W), 259 (S), 7 (P) Related to radiographic evaluation: 7 (W), 52 (S), 9 (P) Related to microbiology: 0 (W), 12 (S), 5 (P)
Related to case report: 9 (W), 181 (S), 104 (P) Related to : 5 (W), 59 (S), 9 (P) Related to literature review: 0 (W), 14 (S), 7 (P) Related to finite element analysis: 22 (W), 12 (S), 13 (P) Related to letter: 7 (W), 0 (S), 5 (P)
Related to biomechanical and
histological evaluation: 22 (W), 7 (S), 11 (P) Related to clinical application: 36 (W), 27 (S), 39 (P)
in vitro
Studies proven to be relevant: 437 179 (W), 119 (S), 133 (P), 6 (M)
Search results after duplicates removed: 286
Studies excluded:
Not including data set of our interest: 267 Not inserted into buccal area: 2
Studies with useful information included in the meta-analysis: 17 Potentially appropriate citations: 1,696
292 (W), 1,039 (S), 359 (P), 6 (M) Screening based on published language,
methodology, research type Screening
Eligibility
Included
Figure 1. PRISMA flow dia- gram of the search strategy for the prognostic factors associated with the success rates of posterior orthodontic miniscrew implants. W, Web of Science; S, Scopus; P, PubMed;
M, manual search.
Table 3. Subgroup analyses with respect to five confounding factors
Variable OR (95% CI) n I
2(%) P
het(within) P
het(between)
Jaw Study design
Prospective 3.67 (2.10, 6.44) 3 0.00 0.368
Retrospective 2.10 (1.60, 2.74) 11 0.00 0.463 0.077
Study quality
High 2.18 (1.24, 3.85) 3 6.17 0.344
Medium 2.36 (1.81, 3.08) 11 21.16 0.242 0.775
Sample size
≥ 200 1.95 (1.42, 2.68) 5 0.00 0.556
< 200 2.96 (2.04, 4.29) 9 11.94 0.335 0.119
Overall 2.32 (1.83, 2.96) 14 12.62 0.315
Gender Study design
Prospective 1.27 (0.63, 2.54) 3 3.73 0.354
Retrospective 1.17 (0.89, 1.52) 10 25.83 0.206 0.805
Study quality
High 2.23 (0.75, 6.66) 1 0.00 1.000
Medium 1.14 (0.88, 1.47) 12 14.61 0.301 0.238
Sample size
≥ 200 1.19 (0.91, 1.58) 7 36.09 0.153
< 200 1.11 (0.63, 1.97) 6 0.00 0.438 0.872
Overall 1.18 (0.92, 1.51) 13 15.85 0.284
Age Study design
Prospective 3.23 (1.30, 8.05) 1 0.00 1.000
Retrospective 1.42 (0.99, 2.04) 5 0.00 0.539 0.101
Study quality High
Medium 1.59 (1.14, 2.22) 6 13.75 0.326 1.000
Sample size
≥ 200 1.81 (1.24, 2.64) 4 0.00 0.538
< 200 0.98 (0.48, 2.03) 2 32.54 0.223 0.230
Overall 1.59 (1.14, 2.22) 6 13.75 0.326
Length Study design
Retrospective 0.42 (0.22, 0.82) 3 9.72 0.330
Prospective 0.56 (0.19, 1.64) 1 0.00 1.000 0.641
Study quality
Medium 0.42 (0.22, 0.82) 3 9.72 0.330
High 0.56 (0.19, 1.64) 1 0.00 1.000 0.641
Sample size
≥ 200 0.64 (0.27, 1.52) 1 0.00 1.000
< 200 0.36 (0.17, 0.75) 3 0.00 0.501 0.313
Overall 0.46 (0.26, 0.80) 4 0.00 0.494
success rates according to MI diameter, four studies were considered. Some of the excluded studies used only one type of MI diameter. Other studies included different diameters, but did not report the success rates according to the diameter. Based on the homogeneity (p
het[within] > 0.1) demonstrated by the four studies, the combined OR of 0.62 (95% CI, 0.40−0.97) indicated that MIs with large diameters (> 1.4 mm) had success rates that were 1.61 (= 1/0.62) times higher than the success rates of MIs with small diameters (≤ 1.4 mm).
While the combined OR of the retrospective studies (OR, 0.74; 95% CI, 0.45−1.22) indicated that there was no significant difference in the success rates of large- diameter and small-diameter MIs, the combined OR of the prospective study by Wiechmann et al.
10(OR, 0.34; 95% CI, 0.14−0.86) showed that MIs with large diameters had significantly higher success rates than did MIs with small diameters (Table 3, Figure 3D).
Publication bias was assessed for the five factors used in our study. No publication bias was found based on the Begg’s and Eggar’s tests (p > 0.05), except in the subgroup of retrospective studies used to investigate age differences. If publication bias was found, a bias- corrected OR estimate that was obtained by the trim- and-fill method was used as the final outcome measure.
Note that the OR values changed, and the significance of the values also changed (Table 4).
DISCUSSION
The aim of this study was to systematically review previous studies that addressed prognostic factors affecting the success of MIs inserted into the buccal posterior region. The success rates of MIs inserted in the maxilla were higher than the rates of MIs inserted
in the mandible. Significantly higher MI success rates were found in patients who were ≥ 20 years of age.
Significantly higher success rates were also identified when long MIs (≥ 8 mm) and large diameter MIs (> 1.4 mm) were used. No significant differences were found between the success rates of MIs inserted in males and females.
Compared to similar studies, our results showed some consistencies with previous findings, but also showed some inconsistencies. For instance, Dalessandri et al.
11performed meta-analyses using the same five factors of age, sex, jaw of insertion, MI length, and MI diameter and found that sex, MI length, and MI diameter showed no significant differences in terms of the success rates of MIs. However, they also reported that MIs inserted in the maxilla had higher success rates than did MIs inserted in the mandible and that MIs inserted in older (> 20 years) patients had higher success rates than did MIs inserted in younger (< 20 years) patients. While the results of Dalessandri et al.’s study
11in terms of the success rates associated with the jaw of insertion (maxilla/mandible), sex, and age were consistent with the results of the present study, their results for the length and diameter of MIs were inconsistent with the results mentioned above. Moreover, in a study by Papageorgiou et al.,
29age, sex, MI length, and MI diameter showed no significant differences in terms of the success rates of MIs. However, they did report that MIs inserted in the maxilla had higher success rates than did MIs inserted in the mandible. Therefore, only their results for the jaw of insertion and sex were consistent with our results mentioned above, while those for age, MI length, and MI diameter were inconsistent. However, in a study by Crismani et al.,
30although only a systematic review was performed rather than a meta-analysis, they reported Table 3. Continued
Variable OR (95% CI) n I
2(%) P
het(within) P
het(between)
Diameter Study design
Retrospective 0.74 (0.45, 1.22) 3 0.00 0.485
Prospective 0.34 (0.14, 0.86) 1 0.00 1.000 0.149
Study quality
Medium 0.62 (0.40, 0.97) 4 15.10 0.316 1.000
High Sample size
≥ 200 0.74 (0.45, 1.22) 3 0.00 0.485
< 200 0.34 (0.14, 0.86) 1 0.00 1.000 0.149
Overall 0.62 (0.40, 0.97) 4 15.10 0.316
P
het(within), heterogeneity within subgroups; P
het(between), heterogeneity between subgroups.
I
2> 50: substantial heterogeneity.
OR, Odds ratio; CI, confidence interval.
that short screws (< 8 mm) with small diameters (< 1.2 mm) should be avoided, which is consistent with the present results. Some consistent and inconsistent results of previous studies compared to our study were shown.
Below, we discussed the results for each factor.
Jaw of insertion
The present meta-analysis was performed on the success rates of MIs inserted in the buccal area only, since the following inconsistent sucess rates contributed to the heterogeneity. MIs inserted into the anterior region and palatal side that had serious effects on the outcome were excluded from the present meta-analysis because greater root proximity in the anterior region
31and significantly higher success rates on the palatal
side
32have been reported. Since the success rates of miniscrews placed in the mandibular lingual side were lower than the rates for the buccal side in Lai and Chen’s study,
33the success rate in the mandible was considered to be much lower than the rate in the maxilla. On the other hand, since the retromolar area showed the highest success rate (100%) in Lin et al.’s study
34and since this area was included as part of the mandible, the success rate in the mandible was reportedly higher than the rate in the maxilla.
Furthermore, prospective studies, compared to retro- spective studies, showed higher success rates for MIs inserted in the maxilla. Since prospective studies usually have fewer potential sources of bias and fewer confounding factors than retrospective studies,
Forest plot of jaw (mandible/maxilla) by subgroup analysis
A.
Group by Study design
Study name Statistics for each study
Prospective
Retrospective
Overall
Heterogeneity : Q = 1.998 ( = 0.368)p Cheng (2004) Wiechmann (2007) Motoyoshi (2006) Wu (2009) Antoszewska (2009) Park (2006) Miyawaki (2003) Topouzelis (2012) Kuroda (2007) Chen (2006) Tseng (2006) Chen YJ (2007) Manni (2011) Watanabe (2013) Heterogeneity : Q = 9.749 ( = 0.463)p Heterogeneity : Q = 14.877 ( = 0.315)p
Lower limit OR 4.264 5.146 2.029 3.673 1.400 1.502 3.744 1.039 3.625 3.357 1.385 5.667 2.225 2.079 4.146 2.095 2.324
1.415 2.188 0.740 2.095 0.728 0.624 1.300 0.399 0.815 0.742 0.287 0.512 1.214 1.127 1.827 1.603 1.826
Upper limit 12.846 12.104 5.563 8.440 2.694 3.616 10.778 2.706 16.122 15.181 6.671 62.657 4.078 3.836 9.411 2.738 2.960
Z-value 2.577 3.754 1.374 4.541 1.009 0.907 2.447 0.079 1.691 1.573 0.406 1.415 2.587 2.342 3.401 5.416 6.843
p-value 0.010 0.000 0.169 0.000 0.313 0.364 0.014 0.937 0.091 0.116 0.685 0.157 0.010 0.019 0.001 0.000 0.000
OR and 95% CI
0.01 0.1 1 10 100
Higher success rate in mandible
Higher success rate in maxilla Meta analysis
Sensitivity analysis of prospective studies
B.
Study name Statistics with study removed
Cheng (2004) Wiechmann (2007) Motoyoshi (2006)
Lower limit Point 3.486 2.845 4.795 3.673
1.816 1.352 2.439 2.095
Upper limit 6.694 5.990 9.426 6.440
Z-value 3.752 2.753 4.546 4.541
p-value 0.000 0.006 0.000 0.000
OR (95% CI) with study removed
0.01 0.1 1 10 100
Higher success rate in mandible
Higher success rate in maxilla Meta analysis
Sensitivity analysis of retrospective studies
C.
Study name Statistics with study removed
Wu (2009) Antoszewska (2009) Park (2006) Miyawaki (2003) Topouzelis (2012) Kuroda (2007) Chen (2006) Tseng (2006) Chen YJ (2007) Manni (2011) Watanabe (2013)
Lower limit Point 2.272 2.167 2.013 2.223 2.057 2.603 2.121 2.069 2.065 2.099 1.931 2.095
1.694 1.637 1.527 1.682 1.567 1.572 1.617 1.581 1.532 1.559 1.455 1.603
Upper limit 3.046 2.871 2.655 2.938 2.700 2.708 2.783 2.708 2.782 2.826 2.563 2.738
Z-value 5.483 5.396 4.958 5.618 5.197 5.220 5.426 5.291 4.763 4.883 4.555 5.416
p-value 0.000 0.000 0.000 0.000 0.000 0.000 0.000 0.000 0.000 0.000 0.000 0.000
Meta analysis
OR (95% CI) with study removed
0.01 0.1 1 10 100
Higher success rate in mandible
Higher success rate in maxilla
Figure 2. A, Forest plot of odds ratios (ORs) for success rates between mandible and maxilla. Homogeneous subgroup of prospective studies showed combined OR of 3.67 (95% confidence interval [CI], 2.10−6.44)*, and homogeneous subgroup of retrospective studies showed a combined OR of 2.10 (95%
CI, 1.60−2.74)*. B, In the
sensitivity analysis for pro-
spective studies regarding
jaw, a significantly higher
success rate in the maxilla
was shown. C, The sensitivity
analysis of retrospective
studies regarding jaw showed
a higher success rate in the
maxilla. *Sig nificance.
prospective studies are deemed more reliable than retrospective studies. The higher success rates in the maxilla than in the mandible were reportedly due to the thicker mandibular cortical bone compared to the maxillary bone, overheating of the mandibular bone
during drilling, and irritation during chewing.
3,4While the insertion region in the maxilla is keratinized gingiva, it is highly possible that the mandibular insertion region is free gingiva. Therefore, gingival inflammation is more likely to occur in the mandible compared to in the
Higher success rate in length < 8 mm
Forest plot of gender by subgroup analysis
A.
Group by Study design
Study name Statistics for each study
Prospective
Retrospective
Overall
Heterogeneity : Q = 2.078 ( = 0.354)p Lee (2010) Motoyoshi (2006) Viwattanatipa (2009)
Moon (2008) Wu (2009) Antoszewska (2009) Park (2006) Miyawaki (2003) Topouzelis (2012) Kuroda (2007) Chen YJ (2007) Manni (2011) Watanabe (2012) Heterogeneity : Q = 12.134 ( = 0.206)p Heterogeneity : Q = 14.261 ( = 0.284)p
Lower limit OR 0.764 1.577 2.230 1.268 1.036 1.200 1.917 0.551 0.800 3.792 0.750 0.921 2.298 0.630 1.166 1.178
0.285 0.188 0.747 0.634 0.617 0.512 0.882 0.215 0.076 0.442 0.080 0.436 1.194 0.270 0.892 0.918
Upper limit 2.049 13.263 6.659 2.535 1.742 2.811 4.165 1.415 8.474 32.517 7.052 1.941 4.422 1.473 1.523 1.512
Z-value 0.535 0.419 1.438 0.672 0.135 0.420 1.643 1.238 0.185 1.216 0.252 0.214 2.492 1.066 1.123 1.289
p-value 0.593 0.675 0.151 0.502 0.892 0.675 0.100 0.216 0.853 0.224 0.801 0.830 0.013 0.286 0.262 0.197
Meta analysis
OR and 95% CI
0.01 0.1 1 10 100
Higher success rate in male
Higher success rate in female
Forest plot of age by subgroup analysis
B.
Group by Study design
Study name Statistics for each study
Prospective
Overall
Heterogeneity : Q = 0.000 ( = 1.000)Lee (2010)p Retrospective Wu (2009)
Antoszewska (2009) Kuroda (2007) Watanabe (2013) Chen YJ (2007) Heterogeneity : Q = 3.112 ( = 0.539)p Heterogeneity : Q = 5.797 ( = 0.326)p
Lower limit OR 3.231 3.231 1.641 1.329 0.446 1.269 1.791 1.422 1.588
1.297 1.297 0.852 0.580 0.103 0.551 0.891 0.993 1.137
Z-value 2.518 2.518 1.481 0.671 1.082 0.561 1.635 1.921 2.710
p-value 0.012 0.012 0.139 0.502 0.279 0.575 0.102 0.055 0.007
Meta analysis
Higher success rate in PTs of age < 20
OR and 95% CI
0.1 1 10 100
Higher success rate in PTs of age > 20 0.01
Forest plot of MI length by subgroup analysis
C.
Group by Study design
Study name Statistics for each study
Prospective Retrospective
Heterogeneity : Q = 0.000 ( = 1.000)Cheng (2004)p Kuroda (2007) Antozewska (2009) Chen CH (2006) Overall
Heterogeneity : Q = 2.215 ( = 0.330)p Heterogeneity : Q = 2.400 ( = 0.494)p
Lower limit OR 0.558 0.558 0.200 0.639 0.281 0.423 0.456
0.189 0.189 0.047 0.269 0.065 0.218 0.259
Upper limit 1.644 1.644 0.844 1.517 1.209 0.818 0.801
Z-value 1.058 1.058 2.192 1.015 1.705 2.555 2.732
p-value 0.290 0.290 0.028 0.310 0.088 0.011 0.006
Meta analysis
OR and 95% CI
0.01 0.1 1 10 100
Higher success rate in length > 8 mm
Higher success rate in diameter < 1.4 mm
Forest plot of MI diameter by subgroup analysis
D.
Group by Study design
Study name Statistics for each study
Prospective Retrospective
Heterogeneity : Q = 0.000 ( = 1.000)Wechimann (2007)p Wu (2009) Park (2006) Chen YJ (2007) Overall
Heterogeneity : Q = 1.448 ( = 0.485)p Heterogeneity : Q = 3.533 ( = 0.316)p
Lower limit OR 0.341 0.341 0.706 2.833 0.682 0.741 0.624
0.135 0.135 0.316 0.301 0.354 0.451 0.403
Upper limit 0.863 0.863 1.579 26.712 1.313 1.216 0.966
Z-value 2.271 2.271 0.848 0.910 1.145 1.187 2.117
p-value 0.023 0.023 0.396 0.363 0.252 0.235 0.034
Meta analysis
OR and 95% CI
0.01 0.1 1 10 100
Higher success rate in diameter > 1.4 mm