D I A B E T E S & M E T A B O L I S M J O U R N A L
This is an Open Access article distributed under the terms of the Creative Commons At- tribution Non-Commercial License (http://creativecommons.org/licenses/by-nc/3.0/) which permits unrestricted non-commercial use, distribution, and reproduction in any medium, provided the original work is properly cited.
Effects of Resistance Training and Aerobic Exercise on Insulin Sensitivity in Overweight Korean Adolescents:
A Controlled Randomized Trial
Sunghwan Suh1,*, In-Kyong Jeong2,*, Mi Yeon Kim1, Yeon Soo Kim3, Sue Shin4, Sun Sin Kim5, Jae Hyeon Kim1
1Division of Endocrinology and Metabolism, Department of Medicine, Samsung Medical Center, Sungkyunkwan University School of Medicine, Seoul,
2Department of Internal Medicine, Seoul National University Bundang Hospital, Seoul National University College of Medicine, Seongnam,
3Department of Physical Education, Seoul National University College of Education,
4Department of Laboratory Medicine, Boramae Medical Center, Seoul National University College of Medicine,
5Seoul National University Hospital Healthcare System Gangnam Center, Healthcare Research Institute, Seoul National University College of Medicine, Seoul, Korea
Background: Data on the impact of resistance training on insulin resistance in overweight or obese children are inconclusive.
Methods: Thirty overweight South Korean adolescents (mean age of 13.10 years) were divided by sex, and then randomly as- signed to one of three treatment groups, which were the diet only (DO), diet with aerobic exercise (AE), or diet with resistance training (RT) group. Physiologic and metabolic parameters were assessed at baseline and after 12 weeks of exercise training and diet modification.
Results: Both exercise groups (aerobic and resistance) showed significant improvements in their insulin area under the curve and insulin sensitivity index values when compared to their baseline values while the DO group showed no significant changes in these variables. Age-, sex-, and body mass index (BMI)-adjusted intergroup comparison analyses showed a marked reduction in BMI and a significant reduction in muscle mass in the AE group when compared to the RT group and the DO group, respec- tively.
Conclusion: A 12-week exercise training program of either resistance or aerobic activity improved insulin sensitivity in over- weight adolescents, although it failed to show superiority over a DO program. Aerobic exercise decreased both body weight and BMI, and it was noted that this group also had a significant reduction in muscle mass when compared to the DO group.
Keywords: Adolescent; Aerobic exercise; Insulin sensitivity; Resistance training
Corresponding author: Jae Hyeon Kim
Division of Endocrinology and Metabolism, Department of Medicine, Samsung Medical Center, Sungkyunkwan University School of Medicine, 50 Irwon-dong, Gangnam-gu, Seoul 135-710, Korea
E-mail: [email protected]
Received: Apr. 29, 2011; Accepted: Jul. 8, 2011
INTRODUCTION
The prevalence of obesity is increasing at an alarming rate [1- 3]. Complications of being overweight and obese are becom- ing major health care issues due to the increasing prevalence of obese and overweight children. The increase in the preva- lence of children and adolescents that are overweight or obese implies a substantial increase in related diseases such as type 2
diabetes mellitus (T2DM) in children and adolescents [4-6], which was previously considered a disease of adults. Insulin resistance precedes the development of T2DM [7] and is a re- ported risk factor for the development of cardiovascular dis- ease. Abdominal adiposity is associated with insulin resistance and T2DM in adults [8-10] and there is growing evidence that this condition is increasingly occurring in childhood [11-14].
Both aerobic and resistance exercise effectively improve in- pISSN 2233-6079 · eISSN 2233-6087
sulin sensitivity and lead to better glycemic control in patients with T2DM [15]. While aerobic exercise has been extensively investigated and shown to be beneficial for improving insulin sensitivity [16-19], resistance training has not been researched extensively. Interestingly, resistance training could be more ef- fective than aerobic exercise in improving the glycemic profile [20] of patients because isometric contractions produce insu- lin-like effects on the glucose uptake in skeletal muscle [21], and skeletal muscle is the primary site of glucose disposal in euglycemia. In addition to improvements in insulin sensitivity, resistance training can enhance several other physiologic pa- rameters related to metabolic health such as total and regional body composition, blood pressure, and high density lipopro- tein cholesterol levels [22]. Recently, the American Diabetes Association and the American College of Sports Medicine pub- lished a joint position statement that both aerobic exercise and resistance training improve insulin action, at least acutely, and can assist with the management of blood glucose levels, lipid levels, blood pressure, cardiovascular risk, mortality, and qual- ity of life [23]. However, data on the impact of resistance train- ing on insulin resistance in overweight or obese children have been inconclusive [24,25] and triple comparison studies that focus on dietary restriction, and aerobic and resistance exer- cise are lacking.
In the current study, we directly compared the effects of di- etary restriction, resistance training and aerobic exercise on insulin sensitivity and body composition in overweight South Korean adolescents.
METHODS
Participants
Thirty (15 male and 15 female) overweight, but otherwise healthy adolescents (as determined by their annual school physical examination), were recruited from the same grade (mean age of 13.10 years) in a middle school in Seoul, South Korea. Identifying an individual as being overweight (body mass index [BMI] >85th percentile) was assessed by using age- and gender-specific BMI reference charts for Korean children and adolescents between 2 to 19 years of age [26]. Two of the enrolled female students had a BMI between the 85th and 75th percentile but were included in this study because there were only 13 girls that had met the criteria for being overweight in the school at the time of the screening procedure. These two female students were separated and assigned in to the diet
only group and the resistance exercise group, respectively.
This study was approved by an Institutional Ethics Review Board at the Boramae Medical Center. Informed written con- sents were obtained from the parents of the enrolled children and assent from the children were also obtained. Participants were excluded if they were taking medication or were smok- ers. Participants who had been diagnosed with a condition that is known to influence body composition or insulin/glucose metabolism, had an orthopedic condition that would limit their ability to perform exercise, or had participated in a struc- tured exercise, nutrition, or weight loss program in the past six months, were also excluded.
Study protocol
The participants were first divided by sex, and were then ran- domly assigned to one of the three treatment groups with ran- dom number table, which were the diet only (DO), diet with aerobic exercise (AE), and diet with resistance training (RT) group. Anthropometric variables (body weight, height and waist circumference), fasting glucose, insulin and 75 g oral glucose tolerance test (OGTT) values were measured prior to and after the 12 weeks of exercise training and diet protocol.
Body weight was measured on a balance scale calibrated to 0.1 kg. Barefoot standing height was measured to the nearest 0.1 cm using a wall-mounted stadiometer. The same investigator measured waist circumference before and after the study with a Gullick II measuring tape. Waist circumference was mea- sured, during expiration, at the narrowest point between the lower rib and the iliac crest. BMI was calculated as weight in kilograms divided by the square of the height in meters. Mea- surements were carried out one week before and after the ex- ercise program. Percent body fat and total body muscle mass were measured by using an Inbody 4.0 bioelectrical imped- ance meter (Biospace Co., Seoul, Korea). Visceral, thigh and intramuscular fat areas were measured by computed tomogra- phy (CT) with a Somatom Sensation 16 (Siemens Medical So- lutions, Forchheim, Germany). The CT measurement protocol for fat area was similar to that used in a study by Poehlman et al. [15]. Total thigh fat area (TTFA) and intramuscular fat area (IMFA) were measured using a method that has been reported by Goodpaster et al. [27]. The abdominal bioelectrical imped- ance analysis (BIA) method [28] was also used to evaluate the visceral fat accumulation in each subject. The insulin sensitivi- ty index was obtained by using the results of the OGTT and Stumvoll’s equations [29].
Dietary protocol
Each study participant received an individualized dietary edu- cation program that was provided by a professional nutrition- ist twice a week throughout the 12 weeks of the study. The de- tailed program is described in Table 1. All three of the groups (DO, AE, and RT) participated in the dietary education pro- gram. The basic guidelines of the dietary education program were calorie restriction to avoid obesity (at least >1,200 kcal per day to prevent malnutrition), limiting dietary fat intake to improve blood lipid profiles, having low-salt intake to improve
hypertension, eating three regular meals a day (breakfast, lunch and dinner) and avoiding snacks as much as possible. Partici- pants were asked to write daily dietary records and these were reviewed weekly by the nutritionist.
Exercise protocol
The 12-week exercise training program was fully supervised by a trained exercise physiologist from the Department of Physical Education in the College of Education at the Seoul National University.
In addition to the dietary energy restriction, ten participants in the AE group performed aerobic exercise three days a week.
The students in the AE group were also told to perform gym- nastics every day throughout the second and third month of the program. Modes of aerobic exercise consisted of jumping rope, walking or running on a treadmill and stationary cycling.
The daily training duration was 40 minutes which included a 5 minute warm-up and a cool down period with stretching. The training intensity progressed from 60% to 70% of the maximal oxygen consumption (60%, 1st month; 65%, 2nd month; 70%, 3rd month). Maximal oxygen consumption was determined during a ramp treadmill test. The training volume of each ses- sion progressed from 300 to 400 kcal/session (300 kcal, 1st month; 350 kcal, 2nd month; 400 kcal, 3rd month) [30].
Another 10 participants in the RT group performed resis- tance training three days a week in addition to their dietary energy restriction. Training sessions began with a 15 minute warm-up period of jogging, gymnastics, and stretching (5 minutes for each type of exercise). One repetition maximum (1RM) is defined as the maximum amount of resistance that can be moved through the full range of motion of an exercise for no more than one repetition. The 1RM was calculated by using the formula derived by Kuramoto and Payne [31] and resistance training was performed at approximately 60% of 1RM. The resistance training program consisted of one set of each of the following ten exercises: squats, leg extension, lying leg curls, military press, leg press, lateral pulldowns, bench press, crunch, leg raise, and dead lift. These exercises provided a total body resistance training program for all of the major muscle groups of the body. Each subject was given a target load range and they were asked to attempt to keep each set (n=2 to 3) within the target range by adjusting the load to al- low the prescribed number (n=10 to 12) of repetitions. The curriculum was personalized to match the skill level of each of the participants and was progressive in nature, by increasing Table 1. Details of the dietary education program
Time Contents
1st week Monday Investigating eating habits and how to write a daily diet record
Friday Relation between nutritional habits and dis- ease
2nd week Monday Estimating energy requirements Friday Individual interviewing session 3rd week Monday Individual interviewing session Friday Food exchange-based meal plan
4th week Monday Healthy diet protocol 1 (natural vs. artificial food)
Friday Healthy diet protocol 2 (benefits of dietary fiber)
5th week Monday Healthy diet protocol 3 (hazard of sugar) Friday Healthy diet protocol 4 (healthy and un-
healthy drink) 6th week Monday Seminar of guest speaker
Friday Healthy diet protocol 5 (essential fatty acids) 7th week Monday Mid-term assessment
Friday Individual interviewing session
8th week Monday Healthy diet protocol 6 (smart protein up- take)
Friday Diet to prevent obesity 1
9th week Monday Self-assessment and re-planning the diet program
Friday Diet to prevent obesity 2 10th week Monday Diet to prevent hypertension
Friday Diet to prevent DM and hyperlipidemia 11th week Monday Assessment and re-planning the diet pro-
gram
Friday Myths about food/Food matching 12th week Monday Questionnaire
Friday Individual interviewing session
the number of sets, repetitions, and the amount of resistance used as the participant’s technique and strength improved.
Resting periods were 1 to 1.5 minutes between sets. Each training session lasted approximately 60 minutes, which in- cluded a final 5 minute cooling down period of stretching.
Biochemical analysis
A standard OGTT was performed in the overweight children by using 1.75 g/kg of a maximum flavored solution containing 75 g of glucose (Glu-Orange; Lotte Pharm, Seoul, Korea).
Samples were drawn at 0, 30, 60, 90, and 120 minutes after the OGTT and the levels of glucose and insulin were measured.
Serum insulin levels (μU/mL) were measured using an insulin immunoradiometric assay kit (Biosource Europe S.A., Nivelles, Belgium), which had a cross-reactivity with proinsulin of 0.3%.
The reported intra-assay variation was 1.6% to 6.2% and the interassay variation was 6.1% to 6.5%.
Statistical analysis
Data were analyzed using the PASW Statistics version 18.0 for Windows (SPSS Inc., Chicago, IL, USA). Values are presented as mean±standard deviation. For all statistical analyses a P val- ue of less than 0.05 (two-sided) was considered to be statisti- cally significant. The study was powered to detect up to a 25%
differences in insulin sensitivity by using a conservative esti- mate of the standard deviation of the insulin sensitivity index, and using a power of 80%. Statistical significance was tested us- ing the one-way ANOVA with Bonferroni correction in order to evaluate group differences at baseline. Changes in variables following the exercise program were compared with baseline values by using the repeated measures ANOVA for each of the three groups. One-way ANOVA with Bonferroni correction was applied to evaluate the main effects and interactions on all of the dependent variables in each of the three groups by time (prior to and after the 12-week program). Differences in the in- ter-group analysis were tested with the ANCOVA and the post- hoc analysis was performed by using the Tukey method for multiple comparison tests. All values were adjusted for baseline age, sex, and BMI in the inter-group analysis.
RESULTS
Remarkably, none of the participants dropped out of the study and all of the participants had attended all of the exercise and dietary education sessions, yielding a compliance rate of 100%.
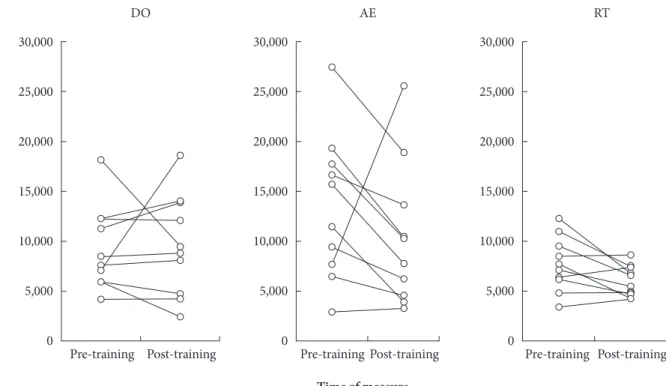
The descriptive characteristics for all of the groups are given in Table 2. The three groups did not significantly differ at base- line with respect to any of the anthropometric or metabolic variables, and this suggests a successful randomization of the study participants. Anthropometric and body composition data across the groups are shown in Table 3. All of the partici- pants had a significant growth in height during the study. Sig- nificant increases in weight, BMI, body fat, waist circumfer- ence, and visceral fat area (VFA) as measured by CT were ob- served in the DO group while their glucose area under the curve (AUC) decreased from the baseline value. The AE group showed a definite decrease in their glucose AUC when com- pared to their values measured at baseline. The RT group had increases in body weight, BMI, body fat, muscle mass and VFA as measured by CT following the 12-week program. Both ex- ercise groups (aerobic and resistance) had significant improve- ments in their insulin AUC and insulin sensitivity index ver- sus their baseline values while the DO group showed no sig- nificant changes in these variables. Individual changes in insu- lin AUC for all three groups are illustrated in Fig. 1. We found significant across group differences in BMI and muscle mass after adjusting for age, sex, and baseline BMI. Waist circum- ference, VFA as measured by various methods, insulin and glucose AUC, insulin sensitivity index, and the insulinogenic index did not show statistically meaningful distinctions across the groups. Age-, sex-, and BMI-adjusted intergroup compari- son analyses showed a marked reduction in BMI and a signifi- cant reduction in muscle mass in the AE group when com- pared to the RT group and the DO group, respectively.
DISCUSSION
The primary finding of this 12-week randomized, controlled exercise trial involving overweight South Korean adolescents is that both resistance training and aerobic exercise improved insulin sensitivity; however, the benefit does not appear to be greater than that of diet alone. In addition, aerobic training produced beneficial effects on body weight and BMI when compared to that of diet alone or resistance training.
Successful randomization was accomplished as the three groups did not differ significantly at baseline with respect to any anthropometric or metabolic variables. Body weight along with BMI increased in the DO and RT groups, while both of these variables remained constant in the AE group. This rela- tive weight reduction indicates that aerobic exercise is good
for lowering body weight in overweight adolescents that may lead to an improvement in their insulin sensitivity. However, this relative weight loss also resulted in reduced muscle mass in the AE group when compared to that of the DO group. This finding implies that even if the RT group failed to lose weight or VFA, resistance training may provide an important way to counteract the decrease in resting metabolic rate and loss of muscle mass often accompanying dietary restrictions [32,33].
Muscle mass increased in the RT group (P=0.039), but this benefit did not reach significance in the post-hoc analysis with the Tukey method due to the rather small number of partici- pants (n=10) in the group. We presume that with a larger sample size, this increase in muscle mass could have reached significance.
Increased BMI in both the DO and RT groups may be due to the normal growth of adolescents or due to poor diet con- trol. As a matter of fact, every participant grew in height dur-
ing the 12-week study. Although little is known about the ef- fects of energy compensation in response to exercise in chil- dren, research in adults have shown that when individuals ex- ercise they often compensate with increased energy intake [34]
or reduced physical activity outside of the training session [35].
Thus, the participants in the exercise groups may have altered their intake in response to the exercise they were performing throughout the program. However, the dietary records collect- ed during the intervention would have minimized this acute compensatory intake.
Insulin resistance is thought to be a critical factor in the pathogenesis of T2DM in both adults [9] and children [36].
Therefore, identifying interventions that can improve insulin sensitivity are critical for defining effective approaches for pre- venting metabolic diseases associated with obesity, especially in at-risk individuals, such as overweight adolescents. In this study, insulin sensitivity improved in both of the exercise groups Table 2. Descriptive characteristics of the study participants
Variable Diet only (n=10) Aerobic (n=10) Resistance (n=10) Adjusted P value
Sex Male 5, Female 5 Male 5, Female 5 Male 5, Female 5 NS
Age, yr 13.10±0.57 13.10±0.52 13.10±0.32 NS
Height, cm 163.85±7.97 165.75±1.87 165.25±8.63 NS
Weight, kg 72.95±13.96 72.61±10.32 69.76±15.88 NS
BMI, kg/m2 27.08±4.10 26.32±2.45 25.31±3.73 NS
Waist, cm 92.11±11.45 91.07±9.45 89.49±11.42 NS
Body fat, % 25.22±7.03 24.52±3.64 22.15±7.04 NS
Muscle mass, kg 26.15±6.07 26.41±5.14 26.08±7.92 NS
VO2max, mL/kg/min 24.80±3.88 25.77±7.10 25.46±5.65 NS
VFA_CT, cm2 80.51±33.70 78.64±26.54 70.22±30.82 NS
VFA_abd BIA, cm2 68.64±54.00 60.36±25.60 40.19±13.75 NS
TTFA, cm2 162.27±34.86 152.28±21.30 152.40±38.09 NS
IMFA, cm2 8.61±2.81 7.23±2.76 5.99±2.30 NS
Fasting glucose, mg/dL 91.60±9.69 89.30±7.30 94.00±7.26 NS
Fasting insulin, µIU/mL 14.15±10.32 31.04±31.33 14.61±8.60 NS
HOMA-IR 3.18±2.43 7.23±7.91 3.29±1.75 NS
Glucose AUC, µIU/mL 16,592.33±2,598.88 16,549.07±2,453.09 15,796.97±1,562.11 NS
Insulin AUC, µIU/mL 9,305.70±4,187.33 14,125.17±7,423.26 7,733.85±2,723.74 NS
Insulin sensitivity index 0.07±0.03 0.05±0.06 0.09±0.02 NS
Insulinogenic index 1.35±0.76 1.97±2.54 1.17±0.55 NS
Data are presented as mean±standard deviation. P values were analyzed using the one-way ANOVA with Bonferroni correction.
BMI, body mass index; VFA, visceral fat area; VFA_CT, VFA measured by CT; VFA_abd BIA, VFA measured by abdominal bioelectrical im- pedance analysis; TTFA, total thigh fat area; IMFA, intramuscular fat area; HOMA-IR, homeostasis model assessment of insulin resistance;
AUC, area under the curve; NS, not significant.
Table 3. Changes in characteristics of the study participants
Variable Diet only (n=10) Aerobic (n=10) Resistance (n=10) Adjusted P valued
Height, cm 0.62±0.64a 0.67±0.76a 0.38±0.43a NS
Weight, kg 1.82±1.32a -0.61±3.16 1.63±0.80a NS
BMI, kg/m2 b 0.45±0.46a -0.45±1.15 0.49±0.33a 0.0128
Waist, cm 1.62±1.86a -0.76±3.64 -0.05±2.57 NS
Body fat, % 0.88±0.74a -0.28±2.42 0.92±0.75a NS
Muscle mass, kgb 0.65±0.98 -0.20±0.80c 0.50±0.45a 0.039
VFA_CT, cm2 3.28±4.09a -0.94±7.64 5.24±2.98a NS
VFA_abd BIA, cm2 11.47±12.0 -5.44±11.04 3.28±7.88 NS
VFA_BIA, cm2 -11.16±58.30 -10.69±36.15 -0.36±19.50 NS
TTFA, cm2 -0.33±9.97 -7.81±12.29 -0.01±9.12 NS
Insulin AUC, µIU/mL 318.75±5,070.95 -3,007.85±8,005.09a -1,646.40±2,155.41a NS Glucose AUC, µIU/mL -2,481.83±1,877.80a -2,330.73±2,229.41a -970.97±1,652.72 NS
Insulin sensitivity index 0.01±0.03 0.04±0.04a 0.01±0.01a NS
Insulinogenic index -1.38±6.52 0.28±0.94 -3.49±11.26 NS
Data are presented as mean±standard deviation. P values were analyzed using ANCOVA and the post-hoc analysis using the Tukey method.
BMI, body mass index; VFA, visceral fat area; VFA_CT, VFA measured by CT; VFA_abd BIA, VFA measured by abdominal bioelectrical im- pedance analysis; TTFA, total thigh fat area; AUC, area under the curve; NS, not significant.
aSignificantly different from baseline value (P<0.05), bSignificantly different across groups (P<0.05), cSignificantly different from the diet only (DO) group (P<0.05), dAge, sex, and baseline BMI were adjusted for the analysis of b and c above.
Fig. 1. Individual changes in insulin area under the curve (AUC) of each group. DO, diet only; AE, diet with aerobic exercise;
RT, diet with resistance training.
Insulin AUC
(μIU/mL)
Pre-training Post-training 30,000
25,000 20,000 15,000 10,000 5,000 0
DO
Pre-training Post-training 30,000
25,000 20,000 15,000 10,000 5,000 0
AE
Pre-training Post-training 30,000
25,000 20,000 15,000 10,000 5,000 0
RT
Time of measure
(AE and RT) when compared to their baseline values, as re- flected by adecreased insulin AUC values and an increased in- sulin sensitivity index. This improvement in the RT group is consistent with the results published by Bell et al. [37] which reported that increases in insulin sensitivity is independent of changes in body composition. However, inter-group analysis did not show significant differences when compared to the other groups, but we presume that this is due to the small number of participants in each of the three groups. Puberty is normally associated with a mild increase in insulin resistance, and in susceptible children it is a high-risk developmental pe- riod for both obesity and T2DM [38]. An assumption could have been made that three months after starting the interven- tion the insulin resistance would have increased as the chil- dren matured, if it was assumed that puberty is likely to influ- ence the results of this study since the groups were comparable in sex distribution and age.
We admit that there are limitations to our selected method of evaluating insulin sensitivity. It is known that the euglyce- mic clamp technique is the recognized gold standard for mea- surement of insulin sensitivity. Even though fasting or OGTT insulin levels are strong correlates of insulin sensitivity when measured by the euglycemic clamp method, the explained variance is approximately 50% [39]. Thus, our results of how a given exercise influences OGTT insulin values provide only an estimate of how insulin acts. However, if we had measured the OGTT insulin response within 24 hours of the last exercise session (instead of the following week), then it would have been likely that the enhanced insulin action observed in re- sponse to diet and exercise would have been even more im- pressive. Because insulin responsiveness is higher in trained individuals compared to untrained individuals 24 hours after exercise [40]. In addition, we did not observe significant changes in the insulinogenic index. This is not surprising be- cause the youth in this study were all non-diabetic and pre- sumably had, for the most part, healthy β-cells.
We attempted to balance the limitations of this study with corresponding advantages. Maturation and/or age should be considered during stratification and during analysis in order to minimize potential confounding variables since they may influence metabolic factors in growing children and adoles- cents. Therefore, we adjusted for age, sex, and baseline BMI in our statistical analysis. Aerobic components (warm up and cool down periods) in the resistance training protocol and di- etary manipulations in both of the exercising group may have
led to some changes that make it more difficult to distinguish the independent effects of each group. Furthermore, data on dietary outcomes such as total energy intake and dietary fat were not available for use in the analysis. To further validate our results, we recommend additional studies that include a larger sample size, longer program duration and consideration of the maturation level and age of the study subjects. The strength of this study includes the involvement of a trained ex- ercise physiologist and the enrollment of enthusiastic students that had succeeded in a remarkable 100% attendance rate. Un- like other studies offering rewards or gifts, we did not offer any kind of economic compensation or penalty.
In conclusion, a 12-week exercise training (both resistance and aerobic) program improved insulin sensitivity in over- weight adolescents, although it failed to show superiority over a DO program. Aerobic exercise decreased both body weight and BMI, and a significant reduction in muscle mass was also noted when compared to the DO group.
CONFLICTS OF INTEREST
No potential conflict of interest relevant to this article was re- ported.
ACKNOWLEDGMENTS
This study was supported by a grant from the Seoul National University Hospital Research Fund 04-2005-024. We are grate- ful to the staff of the Department of Physical Education of the College of Education at the Seoul National University for their support in the exercise programs. Additionally, we thank the participants and their families for their involvement in the study.
REFERENCES
1. Mokdad AH, Bowman BA, Ford ES, Vinicor F, Marks JS, Ko- plan JP. The continuing epidemics of obesity and diabetes in the United States. JAMA 2001;286:1195-200.
2. Mokdad AH, Ford ES, Bowman BA, Dietz WH, Vinicor F, Bales VS, Marks JS. Prevalence of obesity, diabetes, and obesi- ty-related health risk factors, 2001. JAMA 2003;289:76-9.
3. Janssen I, Katzmarzyk PT, Boyce WF, Vereecken C, Mulvihill C, Roberts C, Currie C, Pickett W; Health Behaviour in School-Aged Children Obesity Working Group. Comparison
of overweight and obesity prevalence in school-aged youth from 34 countries and their relationships with physical activity and dietary patterns. Obes Rev 2005;6:123-32.
4. Alberti G, Zimmet P, Shaw J, Bloomgarden Z, Kaufman F, Sil- ink M; Consensus Workshop Group. Type 2 diabetes in the young: the evolving epidemic--the International Diabetes Fed- eration consensus workshop. Diabetes Care 2004;27:1798-811.
5. Ehtisham S, Barrett TG, Shaw NJ. Type 2 diabetes mellitus in UK children: an emerging problem. Diabet Med 2000;17:867- 71.
6. McMahon SK, Haynes A, Ratnam N, Grant MT, Carne CL, Jones TW, Davis EA. Increase in type 2 diabetes in children and adolescents in Western Australia. Med J Aust 2004;180:
459-61.
7. Goran MI, Ball GD, Cruz ML. Obesity and risk of type 2 dia- betes and cardiovascular disease in children and adolescents. J Clin Endocrinol Metab 2003;88:1417-27.
8. Despres JP, Lemieux S, Lamarche B, Prud’homme D, Moorjani S, Brun LD, Gagne C, Lupien PJ. The insulin resistance-dyslip- idemic syndrome: contribution of visceral obesity and thera- peutic implications. Int J Obes Relat Metab Disord 1995;19 Suppl 1:S76-86.
9. Reaven GM. Banting lecture 1988. Role of insulin resistance in human disease. Diabetes 1988;37:1595-607.
10. Hollmann M, Runnebaum B, Gerhard I. Impact of waist-hip- ratio and body-mass-index on hormonal and metabolic pa- rameters in young, obese women. Int J Obes Relat Metab Dis- ord 1997;21:476-83.
11. Csabi G, Torok K, Jeges S, Molnar D. Presence of metabolic cardiovascular syndrome in obese children. Eur J Pediatr 2000;
159:91-4.
12. Ronnemaa T, Knip M, Lautala P, Viikari J, Uhari M, Leino A, Kaprio EA, Salo MK, Dahl M, Nuutinen EM. Serum insulin and other cardiovascular risk indicators in children, adoles- cents and young adults. Ann Med 1991;23:67-72.
13. Weiss R, Dufour S, Taksali SE, Tamborlane WV, Petersen KF, Bonadonna RC, Boselli L, Barbetta G, Allen K, Rife F, Savoye M, Dziura J, Sherwin R, Shulman GI, Caprio S. Prediabetes in obese youth: a syndrome of impaired glucose tolerance, severe insulin resistance, and altered myocellular and abdominal fat partitioning. Lancet 2003;362:951-7.
14. Arslanian S, Suprasongsin C. Insulin sensitivity, lipids, and body composition in childhood: is “syndrome X” present? J Clin Endocrinol Metab 1996;81:1058-62.
15. Poehlman ET, Dvorak RV, DeNino WF, Brochu M, Ades PA.
Effects of resistance training and endurance training on insu- lin sensitivity in nonobese, young women: a controlled ran- domized trial. J Clin Endocrinol Metab 2000;85:2463-8.
16. DeFronzo RA, Sherwin RS, Kraemer N. Effect of physical training on insulin action in obesity. Diabetes 1987;36:1379-85.
17. Henriksson J. Influence of exercise on insulin sensitivity. J Car- diovasc Risk 1995;2:303-9.
18. Buemann B, Tremblay A. Effects of exercise training on ab- dominal obesity and related metabolic complications. Sports Med 1996;21:191-212.
19. Perseghin G, Price TB, Petersen KF, Roden M, Cline GW, Ge- row K, Rothman DL, Shulman GI. Increased glucose trans- port-phosphorylation and muscle glycogen synthesis after ex- ercise training in insulin-resistant subjects. N Engl J Med 1996;
335:1357-62.
20. Cauza E, Hanusch-Enserer U, Strasser B, Ludvik B, Metz- Schimmerl S, Pacini G, Wagner O, Georg P, Prager R, Kostner K, Dunky A, Haber P. The relative benefits of endurance and strength training on the metabolic factors and muscle function of people with type 2 diabetes mellitus. Arch Phys Med Reha- bil 2005;86:1527-33.
21. Holloszy JO, Narahara HT. Studies of tissue permeability. X.
Changes in permeability to 3-methylglucose associated with contraction of isolated frog muscle. J Biol Chem 1965;240:
3493-500.
22. Winett RA, Carpinelli RN. Potential health-related benefits of resistance training. Prev Med 2001;33:503-13.
23. Colberg SR, Sigal RJ, Fernhall B, Regensteiner JG, Blissmer BJ, Rubin RR, Chasan-Taber L, Albright AL, Braun B; American College of Sports Medicine; American Diabetes Association.
Exercise and type 2 diabetes: the American College of Sports Medicine and the American Diabetes Association: joint posi- tion statement. Diabetes Care 2010;33:e147-67.
24. Benson AC, Torode ME, Fiatarone Singh MA. Effects of resis- tance training on metabolic fitness in children and adolescents:
a systematic review. Obes Rev 2008;9:43-66.
25. Kim Y, Lee S. Physical activity and abdominal obesity in youth.
Appl Physiol Nutr Metab 2009;34:571-81.
26. Korea Centers for Disease Control and Prevention TKPS, The Committee for the Development of Growth Standard for Ko- rean Children and Adolescents: 2007 Korean children and ad- olescents growth standard (commentary for the development of 2007 growth chart). Government report online [in Korean].
Available from: http://www.cdc.go.kr/kcdchome/jsp/home/
common/brd/COMMBRD0200Detail.jsp?menuid=100049&
boardid=1012&pageNum=0&sub=0&boardseq=20915 (up- dated 2008 Aug 21).
27. Goodpaster BH, Thaete FL, Kelley DE. Thigh adipose tissue distribution is associated with insulin resistance in obesity and in type 2 diabetes mellitus. Am J Clin Nutr 2000;71:885-92.
28. Ryo M, Maeda K, Onda T, Katashima M, Okumiya A, Nishida M, Yamaguchi T, Funahashi T, Matsuzawa Y, Nakamura T, Shimomura I. A new simple method for the measurement of visceral fat accumulation by bioelectrical impedance. Diabetes Care 2005;28:451-3.
29. Stumvoll M, Mitrakou A, Pimenta W, Jenssen T, Yki-Jarvinen H, Van Haeften T, Renn W, Gerich J. Use of the oral glucose tolerance test to assess insulin release and insulin sensitivity.
Diabetes Care 2000;23:295-301.
30. Martin SB, Morrow JR Jr, Jackson AW, Dunn AL. Variables re- lated to meeting the CDC/ACSM physical activity guidelines.
Med Sci Sports Exerc 2000;32:2087-92.
31. Kuramoto AK, Payne VG. Predicting muscular strength in women: a preliminary study. Res Q Exerc Sport 1995;66:168-72.
32. Watts K, Jones TW, Davis EA, Green D. Exercise training in obese children and adolescents: current concepts. Sports Med 2005;35:375-92.
33. Bar-Or O, Foreyt J, Bouchard C, Brownell KD, Dietz WH, Ra- vussin E, Salbe AD, Schwenger S, St Jeor S, Torun B. Physical
activity, genetic, and nutritional considerations in childhood weight management. Med Sci Sports Exerc 1998;30:2-10.
34. Tremblay A, Despres JP, Bouchard C. The effects of exercise- training on energy balance and adipose tissue morphology and metabolism. Sports Med 1985;2:223-33.
35. Goran MI, Poehlman ET. Endurance training does not en- hance total energy expenditure in healthy elderly persons. Am J Physiol 1992;263(5 Pt 1):E950-7.
36. Cruz ML, Weigensberg MJ, Huang TT, Ball G, Shaibi GQ, Goran MI. The metabolic syndrome in overweight Hispanic youth and the role of insulin sensitivity. J Clin Endocrinol Metab 2004;89:108-13.
37. Bell LM, Watts K, Siafarikas A, Thompson A, Ratnam N, Bul- sara M, Finn J, O’Driscoll G, Green DJ, Jones TW, Davis EA.
Exercise alone reduces insulin resistance in obese children in- dependently of changes in body composition. J Clin Endocri- nol Metab 2007;92:4230-5.
38. Burt Solorzano CM, McCartney CR. Obesity and the pubertal transition in girls and boys. Reproduction 2010;140:399-410.
39. Laakso M. How good a marker is insulin level for insulin resis- tance? Am J Epidemiol 1993;137:959-65.
40. Mikines KJ, Sonne B, Farrell PA, Tronier B, Galbo H. Effect of physical exercise on sensitivity and responsiveness to insulin in humans. Am J Physiol 1988;254(3 Pt 1):E248-59.