D I A B E T E S & M E T A B O L I S M J O U R N A L
This is an Open Access article distributed under the terms of the Creative Commons At- tribution Non-Commercial License (http://creativecommons.org/licenses/by-nc/3.0/) which permits unrestricted non-commercial use, distribution, and reproduction in any medium, provided the original work is properly cited.
Effects of Aerobic Exercise Intensity on Abdominal and Thigh Adipose Tissue and Skeletal Muscle Attenuation in Overweight Women with Type 2 Diabetes Mellitus
Ji Yeon Jung1,*, Kyung Ah Han1,2,*, Hee Jung Ahn1, Hwi Ryun Kwon1, Jae Hyuk Lee2, Kang Seo Park2, Kyung Wan Min1,2
1Diabetes Center, Eulji General Hospital, Seoul,
2Department of Internal Medicine, Eulji University School of Medicine, Daejeon, Korea
Background: We investigated the effects of exercise intensity on abdominal and mid-thigh adipose tissue, attenuation of skeletal muscle, and insulin sensitivity in overweight women with type 2 diabetes mellitus (T2DM).
Methods: Twenty-eight patients were randomly assigned to control (CG, n=12), moderate intensity exercise (MEG, n=8), or vigorous intensity exercise (VEG, n=8) group. Subjects in both exercise groups completed a 12-week exercise program (MEG, 3.6 to 5.2 METs; VEG, ≥5.2 METs) that was monitored by accelerometers. We assessed body mass index (BMI), total fat area (TFA), visceral fat area (VFA), subcutaneous fat area (SFA), mid-thigh intramuscular adipose tissue (TIMAT), total skeletal muscle (TTM), low density skeletal muscle (TLDM), and normal density skeletal muscle (TNDM) using computed tomography, and measured insulin sensitivity with an insulin tolerance test (KITT), before and after the intervention.
Results: At baseline, the mean age was 53.8±7.9 years, duration of diabetes was 3.8±2.3 years, and BMI was 26.6±2.6 kg/m2. After 12 weeks, the percent change (%C) in BMI, TIMAT, and TLDM were not different among three groups. However, %C in TFA and VFA were significantly reduced in MEG compared to CG (P=0.026 and P=0.008, respectively). %C SFA was signifi- cantly reduced in VEG compared to CG (P=0.038) and %C TTM, TNDM, and KITT were significantly increased in VEG com- pared to the CG (P=0.044, P=0.007, and P=0.016, respectively).
Conclusion: Although there was no difference in the change in BMI among groups, TFA and VFA were more reduced in MEG, and only VEG increased TTM, TNDM, and insulin sensitivity compared to CG.
Keywords: Abdominal fat; Attenuation of skeletal muscle; Diabetes mellitus, type 2; Exercise intensity; Mid-thigh adipose tissue
Corresponding author: Kyung Wan Min
Diabetes Center, Eulji General Hospital, 14 Hangeulbiseong-ro, Nowon-gu, Seoul 139-872, Korea
E-mail: [email protected]
Received: Jun. 17, 2011; Accepted: Mar. 13, 2012
INTRODUCTION
Obesity is a risk factor that causes diabetes, cardiovascular dis- ease, and other metabolic disorders. These health risks associ- ated with obesity relate not only to total adiposity but also to the regional distribution of adipose tissue [1]. In addition, vis- ceral fat has a higher lipolytic rate, which contribute to in- crease the concentration of free fatty acids in plasma and cause insulin resistance.
Aerobic exercise improves insulin tolerance due to improved insulin action in skeletal muscle and in adipose tissue [2]. It also reduces visceral fat and the risk of cardiovascular disease [3]. Mourier et al. [4] reported that moderate exercise reduced 48% of visceral fat without weight loss in obese diabetic sub- jects for 8 weeks intervention. Giannopoulou et al. [5] also re- ported that among diabetic obese subjects who performed moderate intensity aerobic exercise for 14 weeks, 14% showed a decrease in visceral fat without significant changes in body http://dx.doi.org/10.4093/dmj.2012.36.3.211
pISSN 2233-6079 · eISSN 2233-6087
weight. However, recent studies suggest vigorous intensity ex- ercise is more effective in decreasing visceral fat than moder- ate intensity exercise [6], and is also more effective in decreas- ing the prevalence of diabetes and incidence of cardiovascular disease [7]. Therefore, the appropriate exercise intensity for re- ducing abdominal fat is still controversial.
The thigh muscle is divided into normal and low density muscle. Low density muscle contains significant amount of adipose tissue as much as fat stored in abdominal visceral fat and it has been reported to be associate with insulin resistance in several studies [8,9]. In addition, obese type 2 diabetic sub- jects appear to have more low density muscle than thin indi- viduals [10], which is related to their lower level of physical activity [11]. Schwartz et al. [12] found out there was increase in normal density muscle even though there was no change in low density muscle in healthy 60’s males who performed aero- bic exercise for 6 months. Boudou et al. [13] also reported that there was no change in the low density thigh muscle, but the normal thigh muscle increased significantly in obese diabetic females who performed aerobic exercise for 13 weeks. There are limited studies, however, that show changes in the compo- sition of thigh muscle solely resulting from exercise. Addition- ally, there are no studies regarding changes in thigh muscle composition based on exercise intensity.
Therefore, in this study, we investigated the effects of mod- erate or vigorous intensity exercise in equal amount of exercise in each group on abdominal fat, thigh fat and muscle compo- sition, and insulin sensitivity in overweight subjects with type 2 diabetes mellitus.
METHODS
Study subjects
We enrolled a total of 44 subjects with type 2 diabetes mellitus who visited the Eulji General Hospital Diabetes Center. Study subjects were females between 45 and 65 years old and were overweight or obese with body mass index (BMI) over 23 kg/
m2, had glycated hemoglobin levels under 10%, and were not using oral glucose insulin enhancers. Subjects with the follow- ing characteristics were excluded from this study: type 1 dia- betes, congestive heart failure, non-controlled arrhythmia, se- vere valvular heart disease, malignant tumor, undergoing re- nal replacement therapy, difficulty with following up, refusing examination, and those who were taking medication.
Measurements and methods
Anthropometric and biochemical parameters
The height, weight, and waist circumference of each subject was measured before and after 12-week study period. Height and weight measurements were taken while participants wore thin gowns, and BMI was calculated by dividing weight (kg) by height squared (m2). Waist circumference was measured using a tape measure at the narrowest point between the bottom of the ribs and the top of the iliac crest after the subjects exhaled and were in a relaxed state. Blood pressure was measured after the subjects were seated and at rest for 10 minutes, using a mercury sphygmomanometer (Yamasu, Tokyo, Japan).
Biochemical tests were performed after 10 hours of fasting.
Venous blood was collected and centrifuged at 3,000 rpm for 15 minutes, where plasma was separated. The sample was then stored at -70°C to later be used for analysis. Fasting glucose was measured using glucose oxidation, and glycated hemoglo- bin was measured using high-performance liquid chromatog- raphy. Using an enzyme reaction measurement kit, cholester- ol, triglycerides, high density lipoprotein cholesterol, and low density lipoprotein cholesterol were analyzed using a biochem- ical automatic analyzer (Hitachi 7170; Hitachi, Tokyo, Japan).
Insulin resistance was measured using an insulin tolerance test (KITT) [14]. For KITT measurements, subjects fasted for over 10 hours prior to visiting the hospital, and then a 20-G cathe- ter was inserted into the patients’ antecubital vein on one side of the body and was used to collect blood samples. On the op- posite side, 20-G catheter was inserted into a forearm vein, and after insulin shots were administered and the examination was finished, intravenous glucose was used. In a stable condition, 0.1 U of diluted insulin (Humulin R; Eli Lilly, Indianapolis, IN, USA) was calculated per kg of body weight and injected into a forearm vein. On the opposite side, blood was sampled from the antecubital vein, at 0, 3, 6, 9, 12, and 15 minutes. To prevent hypoglycemia, after 15 minutes of sampling the subjects were infused with 100 mL 20% glucose and blood samples were im- mediately centrifuged and glucose concentrations were mea- sured. During the insulin resistance test, glucose concentra- tion measurements taken over time were converted into natu- ral logs to be entered into the computer program. Using the 3 to 15 minute values, the slope of the regression line was calcu- lated, from which the point where basal blood glucose dropped by half (t1/2) was found. Then, the rate constant for plasma glucose disappearance, KITT, was calculated using the follow- ing formula:
KITT=0.693/t1/2×100 (%/min) Exercise intervention
The control group (CG) did not participate in the exercise program and education regarding walking exercises, accord- ing to American Diabetes Association (ADA) guidelines [15], was given during the initial meeting. In order to expend a total of 500 kcal per day, moderate intensity exercise group (MEG) was performed at 3.5 to 5.2 METs (Lifecorder activity level 4 to 5) [16], 5 times per week, for 60 minutes per session, and vigorous intensity exercise group (VEG) were performed at over 5.3 METs (Lifecorder activity levels >7), 5 times per week, for 30 minutes per session.
Survey of physical activity and energy intake
An accelerometer (Lifecorder; Suzuken Co., Nagoya, Japan) was used to monitor individual physical activity. Before the start of intervention program, age, sex, height, and body weight were taken, and after inputting activity durations, and exclud- ing sleep and bath times when the accelerometer could not be worn, levels of normal baseline physical activity were assessed for 2 weeks. After starting the intervention program, data were re-input every 2 weeks based on changes in body weight.
Total energy expenditure, physical activity energy expendi- ture, energy expenditure of each activity intensity levels were analyzed as follows:
1) Basal metabolic rate (BMR)
The BMR was calculated from sex, age, height, and weight us- ing a standard Japanese formula and the suitable body surface area basal metabolism criteria (Kb). Kb was then automatical- ly calculated:
BMR (kcal)=Kb×(Body weight 0.444 (kg)×height 0.663 (cm)×
88.83)×Time×(1/10,000) 2) Exercise level (EEact)
The amplitude and frequency of activity from the accelerome- ter signaled the weight and exercise coefficient (Ka) every 4 seconds to estimate activity intensity. There were 11 levels of exercise intensity, zero was absence of activity, 0.5 was micro- activity, 1 to 3 was low intensity activity, 4 to 6 was moderate intensity activity, and 7 to 9 was vigorous intensity activity.
EEact (kcal)=Ka×Body weight (kg)
3) Total energy expenditure (TEE)
TEE is the sum of calories based on calculated BMR and ther- mic effect of food, and measured energy expenditure of EEact and micro activity (EEminoract). This value was stored auto- matically.
TEE=BMR+1/10TEE+EEact+EEminoract 4) Physical activity energy expenditure
Physical activity energy expenditure was estimated by sum of activity intensity levels over 4 from active calories consumed through exercise and it was automatically saved.
Energy intake surveys were filled out for 3 days in the form of subject daily food intake records (2 weekdays and 1 weekend day). Energy intake information was reviewed once every 2 weeks during hospital visits. For subject daily food intake re- cords, simple pre-education on how to keep intake records must be given. Questionnaires regarding daily dietary intake documented each meal, food quantity, and ingredients, and all subjects were asked to write their own records. Subjects were also asked to include both health supplements and snacks. To improve the accuracy of the records, dieticians used life-size food models (Korea Mirage Replica Inc., Incheon, Korea), mea- suring cups, measuring spoons, pictures of food, and visual es- timates (The Korean Dietetic Association, 1999) to investigate recorded information when the dietary questionnaires were collected. Recorded dietary consumption data were analyzed using a computer-aided nutritional analysis program (CAN-Pro version 2.0; Korean Nutrition Society, Seoul, Korea) to convert foods consumed into nutrients.
Computed tomography (CT)
CT of abdominal fat (GE, Milwaukee, WI, USA) was performed based on methods used in previous studies, in the area between lumbar vertebra 4 to 5 and the belly button, and ranging 10 mm above and below that circumference. Fat density was measured in Housefield units (HU) in the -150 to -50 range and was re- constructed. In other words, a computer was used to calculate the total area of abdominal fat present in the peritoneal cavity, the area inside the boundary of the abdomen and peritoneum of the stomach region was measured, and the area of the vis- ceral fat was calculated. The area of subcutaneous fat was cal- culated by subtracting visceral fat area from total abdominal fat [17].
To measure skeletal muscle, the medial portion between the
upper margin of the patella and greater trochanter that falls within 0 to +100 Hounsfield units was classified as thigh total muscle. Muscle area was further characterized that 0 to +30 Hounsfield units were classified as low density muscle, and +31 to +100 were classified as normal density muscle [18].
Statistical analysis
Statistical analysis was performed using SPSS for Windows version 15.0 (SPSS Inc., Chicago, IL, USA). The means and standard deviations were calculated for each item. The effect size of the number of subjects was assumed to be 0.6, and the superiority of high intensity exercise in the moderate intensity exercise group was alpha=0.05 and beta=0.3; therefore, 9 sub- jects were selected per group for unilateral validation. To verify differences between groups, ANCOVA tests were performed, and before and after comparisons within group were performed using a paired t-test. In the interpretation of the results, P val- ues under 0.05 were considered to be statistically significant.
RESULTS
Clinical characteristics of the study subjects
During the study period, among the 44 subjects who partici- pated in this study, the 4 subjects who did not follow at a vig- orous exercise intensity (5.3 METs), the 2 subjects who did not follow at a moderate exercise intensity (3.6 to 5.2 METs), and the 10 subjects who reduced their energy intake to 3 kcal/kg/
day or more were excluded from the analysis. Thus, only the remaining 28 subjects were included in our analysis (CG, 12 subjects; MEG, 8 subjects; VEG, 8 subjects). The mean age of the subjects was 53.8±7.9, mean duration of diabetes mellitus was 3.8±2.3, and mean BMI was 26.6±2.6 kg/m2. There was no difference in age, duration of diabetes mellitus, and BMI among the three groups; however, in the post-hoc test, the mean age of the VEG was significantly lower than the MEG and the control group (P=0.044, P=0.032, respectively). There were no significant differences in glycated hemoglobin levels, cho- lesterol levels, and insulin sensitivity indicator (KITT) among the groups (Table 1).
Changes in dietary and exercise calorie and BMI
The TEE of the CG study was significantly lower than the oth- er groups (P=0.011), but physical activity energy expenditure and energy intake did not differ among the three groups before the intervention program. For 12 weeks, TEE and physical ac-
tivity energy expenditure was significantly higher in both MEG and VEG than CG (P<0.001). Mean physical activity energy expenditure of the MEG was 7.5±1.4 kcal/kg/day, and mean physical activity energy expenditure of the VEG was 7.8±0.7 kcal/kg/day, which shows that there is no significant difference in the amount of physical activity energy expenditure during the intervention period for the two groups.
For 12 weeks, there was no significant difference in mean energy intake among the three groups (Table 2). All groups decreased their BMI after 12-week period (P=0.010, P=0.012, P=0.015, respectively), but there was no significant difference in the changes among the three groups. Only the waist circum- ference of the VEG decreased significantly compared to the baseline (P=0.026), but there was no significant difference be- tween the changes among the three groups (Table 3).
Changes in fat mass in the abdomen and mid-thigh
There was significant difference in the percent change of total abdominal fat and visceral fat among the three groups after 12-week period (P=0.038, P=0.049, respectively), but there was no significant difference in subcutaneous fat between the three groups. In the post-hoc test, percent change of total ab- dominal fat and visceral fat decreased significantly in the MEG compared to the CG (P=0.026, P=0.008, respectively), and percent change of subcutaneous fat in the VEG decreased sig- nificantly compared to the CG (P=0.038) (Fig. 1). In addition, there were no significant differences in percent change of vis- ceral fat and subcutaneous fat ratios among the three groups, but in the post-hoc test, the MEG showed a significantly great- er decrease compared to the VEG after 12 weeks (P=0.044).
There were no significant percent change of the thigh sub- cutaneous fat, thigh subfascial fat, and thigh intramuscular adipose tissue among the three groups (Table 3).
Changes in mid-thigh muscle mass
There was a significant difference in percent change of normal density muscle after 12 weeks (P=0.044), but there was no sig- nificant difference in percent change of total skeletal muscle and low density muscle among the three groups. In the post-hoc test, both total skeletal muscle and normal density muscle in- creased significantly in the VEG compared to the CG (P=0.044, P=0.007, respectively) (Table 3, Fig. 1).
Changes in insulin sensitivity
There was significant difference in percent change of insulin
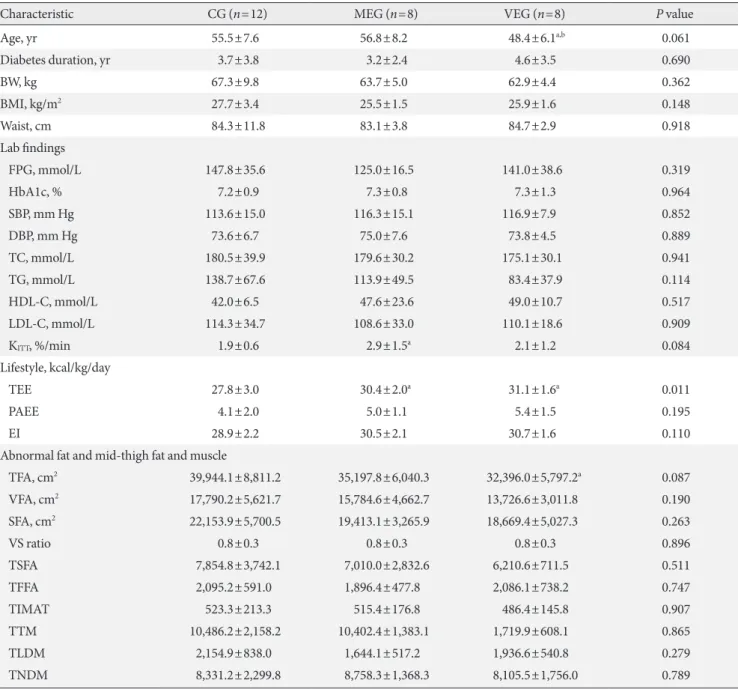
Table 1. Characteristics of the subjects at baseline
Characteristic CG (n=12) MEG (n=8) VEG (n=8) P value
Age, yr 55.5±7.6 56.8±8.2 48.4±6.1a,b 0.061
Diabetes duration, yr 3.7±3.8 3.2±2.4 4.6±3.5 0.690
BW, kg 67.3±9.8 63.7±5.0 62.9±4.4 0.362
BMI, kg/m2 27.7±3.4 25.5±1.5 25.9±1.6 0.148
Waist, cm 84.3±11.8 83.1±3.8 84.7±2.9 0.918
Lab findings
FPG, mmol/L 147.8±35.6 125.0±16.5 141.0±38.6 0.319
HbA1c, % 7.2±0.9 7.3±0.8 7.3±1.3 0.964
SBP, mm Hg 113.6±15.0 116.3±15.1 116.9±7.9 0.852
DBP, mm Hg 73.6±6.7 75.0±7.6 73.8±4.5 0.889
TC, mmol/L 180.5±39.9 179.6±30.2 175.1±30.1 0.941
TG, mmol/L 138.7±67.6 113.9±49.5 83.4±37.9 0.114
HDL-C, mmol/L 42.0±6.5 47.6±23.6 49.0±10.7 0.517
LDL-C, mmol/L 114.3±34.7 108.6±33.0 110.1±18.6 0.909
KITT, %/min 1.9±0.6 2.9±1.5a 2.1±1.2 0.084
Lifestyle, kcal/kg/day
TEE 27.8±3.0 30.4±2.0a 31.1±1.6a 0.011
PAEE 4.1±2.0 5.0±1.1 5.4±1.5 0.195
EI 28.9±2.2 30.5±2.1 30.7±1.6 0.110
Abnormal fat and mid-thigh fat and muscle
TFA, cm2 39,944.1±8,811.2 35,197.8±6,040.3 32,396.0±5,797.2a 0.087
VFA, cm2 17,790.2±5,621.7 15,784.6±4,662.7 13,726.6±3,011.8 0.190
SFA, cm2 22,153.9±5,700.5 19,413.1±3,265.9 18,669.4±5,027.3 0.263
VS ratio 0.8±0.3 0.8±0.3 0.8±0.3 0.896
TSFA 7,854.8±3,742.1 7,010.0±2,832.6 6,210.6±711.5 0.511
TFFA 2,095.2±591.0 1,896.4±477.8 2,086.1±738.2 0.747
TIMAT 523.3±213.3 515.4±176.8 486.4±145.8 0.907
TTM 10,486.2±2,158.2 10,402.4±1,383.1 1,719.9±608.1 0.865
TLDM 2,154.9±838.0 1,644.1±517.2 1,936.6±540.8 0.279
TNDM 8,331.2±2,299.8 8,758.3±1,368.3 8,105.5±1,756.0 0.789
Values are presented as mean±standard deviation. P value <0.05 statistical significance from ANOVA.
CG, control group; MEG, moderate intensity exercise group; VEG, vigorous intensity exercise group; BW, body weight; BMI, body mass index;
Waist, waist circumference; FPG, fasting plasma glucose; SBP, systolic blood pressure; DBP, diastolic blood pressure; TC, total cholesterol; TG, triglyceride; HDL-C, high density lipoprotein cholesterol; LDL-C, low density lipoprotein cholesterol; KITT, insulin sensitivity; TEE, total energy expenditure; PAEE, physical activity energy expenditure; EI, energy intake; TFA, total fat area; VFA, visceral fat area; SFA, subcutaneous fat area;
VS ratio, visceral fat to subcutaneous fat ratio; TSFA, mid-thigh subcutaneous fat area; TFFA, mid-thigh subfascial fat area; TIMAT, mid-thigh intramuscular adipose tissue; TTM, mid-thigh total muscle; TLDM, mid-thigh low density muscle; TNDM, mid-thigh normal density muscle.
aP value <0.05 compared to control group, bP value <0.05 compared to moderate intensity exercise group, significance from LSD post-hoc analysis.
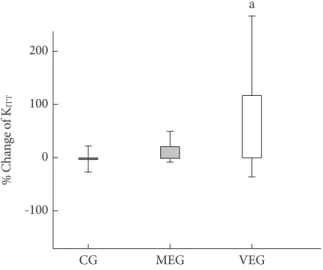
sensitivity measured by KITT among the three groups after 12 weeks (P=0.046). The percent change of KITT improved signif-
icantly in the VEG compared to the control group (P=0.016) (Table 3, Fig. 2).
DISCUSSION
Abdominal fat has been identified as an independent risk fac- tor for development of cardiovascular disease [19]. Regular moderate intensity aerobic exercise is effective in reducing vis- ceral fat without weight loss. Ross et al. [20] observed a 17%
decrease in visceral fat without weight loss and there was no significant decrease in subcutaneous fat in obese males who performed moderate intensity exercise (60% of VO2max) for 12 weeks. Lee et al. [21] also reported that there was a 22% de- crease in visceral fat without weight loss, but there was a 2.5%
decrease in subcutaneous fat in obese diabetic males who per- formed moderate intensity exercise (60% of VO2max) for 13 weeks. In this study, significant reduced total abdominal fat (9.0%) and visceral fat (14.7%) levels without weight loss were observed in the moderate intensity exercise group when com- pared to the control group. These results are consistent with previous studies, however, our study showed a smaller decrease in visceral fat when compared to other studies. This may be due to different amount of energy expenditure through exer- cise that Ross et al. (700 kcal) and Lee et al. (673 kcal) used in their studies, which was higher than what we reported in our study. In addition, exercise intensity was readjusted according to the result of two subsequent graded exercise tests at weeks 4 and 8 because as VO2max rises in previous studies.
In the previous studies, effects of exercise intensity on ab- dominal fat reduction have varied greatly. Nicklas et al. [22]
reported visceral fat decreased to a similar degree in both
moderate intensity (HR, 45% to 50%) and vigorous intensity (HR, 70% to 75%) combined with dietary intervention (400 kcal/day) (27.2%, 25.2%, respectively) in middle aged obese females for 20 weeks. Additionally, Slentz et al. [23] also re- ported that the change in abdominal fat was similar in both moderate intensity exercise group (44% to 55% VO2max) and vigorous intensity exercise group (65% to 80% VO2max) in middle aged obese females expended the same amount of physical activity kcal (14 kcal/kg/wk). In that study, they also found that high amount and vigorous intensity exercise group (23 kcal/kg/wk) showed a significant decrease in visceral and subcutaneous fat (6.9%, 7.0%), and they suggested that amount of exercise, but not intensity, was the most effective in reducing abdominal fat. However, in a study by Slentz et al., active calo- ries expended were 14 kcal/kg/wk, which was much lower than the active calorie expenditure rate in our study. Visceral fat loss by the high amount and vigorous intensity group in Slentz’s study, which resembled the vigorous intensity exercise group from our study, was 6.9%, and subcutaneous fat reduction was 7.9%, which was also similar to the results from our study.
On the other hand, Coker et al. [24] showed that vigorous intensity exercise (75% VO2max) was more effective in reduc- ing subcutaneous and visceral fat than moderate intensity ex- ercise (50% VO2max). Irving et al. [6] also showed that both subcutaneous and visceral fat loss were much greater in the vigorous exercise intensity group (RPE 15 to 17) in middle aged obese female. The stimulating effect of exercise on visceral fat degradation was explained as a result of decreasing insulin Table 2. Total and physical activity energy expenditure and dietary energy intake in the three groups at baseline and during the 12-week intervention (kcal/kg/day)
CG MEG VEG P value
TEE Baseline 27.8±3.0 30.4±2.0a 31.1±1.6a 0.011
During intervention 27.2±2.9 33.1±2.0a,b 33.9±1.6a,b <0.001
% Change -2.0±8.0 8.7±4.5a 9.2±6.0a 0.001
PAEE Baseline 4.1±2.0 5.0±1.1 5.4±1.5 0.195
During intervention 3.5±1.5 7.5±1.4a,b 7.8±0.7a,b <0.001
% Change -7.6±23.5 52.8±20.1a 53.6±45.9a <0.001
EI Baseline 28.9±2.2 30.5±2.1 30.7±1.6 0.110
During intervention 27.2±1.8b 28.8±2.8b 29.1±2.4b 0.171
% Change -5.8±2.9 -5.8±3.7 -5.5±3.4 0.975
Values are presented as mean±standard deviation. P value <0.05 statistical significance from ANCOVA adjusting for age.
CG, control group; MEG, moderate intensity exercise group; VEG, vigorous intensity exercise group; TEE, total energy expenditure; PAEE, physical activity energy expenditure; EI, energy intake.
aP value <0.05 compared to control group significance from LSD post-hoc analysis, bP value <0.05 significance from paired t-test within group.
concentration and adrenaline secretion due to exercise. Arner [25] reported that hormone-sensitive lipase activity due to cat-
echolamine stimulation is higher in visceral adipocytes than subcutaneous adipocytes, plasma catecholamine concentra- Table 3. Changes in body fat and muscle and insulin sensitivity in the three groups after the 12-week intervention
CG MEG VEG P value
Characteristic
BW, kg After 66.3±9.5c 61.8±4.7c 61.3±5.1c
% Change -1.5±1.6 -2.9±2.5 -2.5±2.3 0.321
BMI, kg/m2 After 27.3±3.4c 24.8±1.3c 25.3±1.6c
% Change -1.5±1.6 -2.9±2.5 -2.5±2.3 0.321
Waist, cm After 87.3±6.2 80.8±4.0 82.5±3.8c
% Change 7.2±30.7 -2.8±4.2 -2.7±2.7 0.456
Abnormal fat area
TFA, cm After 40,000.3±8,378.9 31,703.6±4,321.1c 29,758.5±5,788.1
% Change 0.5±6.0 -9.0±8.6a -7.6±12.2 0.038
VFA After 17,372.7±5,235.7 13,262.5±3,217.8c 12,447.4±2,252.6
% Change -1.5±7.8 -14.7±9.8a -8.0±12.8 0.049
SFA After 22,627.6±5,799.0 18,441.1±3,215.2 17,311.1±5,306.8
% Change 2.3±6.3 -4.6±10.1 -7.2±12.4a 0.053
VS ratio After 0.8±0.3 0.7±0.3 0.8±0.3
% Change 3.5±7.3 10.1±11.4 0.5±8.9b 0.181
Mid-thigh fat area
TSFA After 7,667.6±3,818.6 6,352.1±2,282.9 5,740.8±1,829.7
% Change -2.5±17.3 -3.4±39.8 -2.7±38.5 0.983
TFFA After 2,189.7±683.7 1,850.9±774.2 2,002.0±715.0
% Change 4.9±22.2 1.1±49.9 0.8±31.9 0.753
TIMAT After 459.2±170.8 398.1±135.4 459.5±185.8
% Change -2.7±43.8 -13.6±39.7 -2.5±31.9 0.457
Mid-thigh muscle
TTM After 10,311.8±1,938.7 10,302.9±1,499.3 10,476.8±1,420.5
% Change -1.4±2.8 -1.0±5.8 5.5±11.6a 0.202
TLDM After 2,138.9±1,009.5 1,395.6±335.5 1,696.8±344.5
% Change -1.7±26.5 -10.7±27.1 -8.2±26.3 0.759
TNDM After 8,172.8±2,129.3 8,907.3±1,327.1 8,780.0±1,475.3c
% Change -1.8±5.8 2.3±10.7 9.7±9.5a 0.044
KITT, %/min After 1.8±0.9 3.3±1.5 2.9±0.7
% Change -3.0±38.9 19.6±34.0 115.0±180.4a 0.046
Values are presented as mean±standard deviation. P value <0.05 statistical significance from ANCOVA adjusting for age.
CG, control group; MEG, moderate intensity exercise group; VEG, vigorous intensity exercise group; BW, body weigh; BMI, body mass index;
Waist, waist circumference; TFA, total fat area; VFA, visceral fat area; SFA, subcutaneous fat area; VS ratio, visceral fat to subcutaneous fat ratio;
TSFA, mid-thigh subcutaneous fat area; TFFA, mid-thigh subfascial fat area; TIMAT, mid-thigh intramuscular adipose tissue; TTM, mid-thigh total muscle; TLDM, mid-thigh low density muscle; TNDM, mid-thigh normal density muscle; KITT, insulin sensitivity.
aP value <0.05 compared to control group, bP value <0.05 compared to moderate intensity exercise group group, significance from LSD post- hoc analysis, cP value <0.05 significance from paired I-test within group.
tion rises during vigorous intensity exercise, and stimulates li- polysis in visceral fat. Additionally, vigorous intensity exercise increases post-exercise oxygen consumption, which brings about more energy imbalance, and increase lipolysis [26]. In our study, the vigorous intensity exercise group showed a sig- nificant decrease in subcutaneous fat (7.2%) compared to the control group without weight loss, but unlike in previous stud- ies, visceral fat did not decrease to a significant degree compared to the control group. Post-exercise abdominal fat reduction is related to the initial amount of fat [12]. In our study, , the vig- orous intensity exercise group had significantly less abdominal fat at baseline compared to the other groups, which may result in relatively low visceral fat reduction after 12 weeks. Addition- ally, the significant difference in the amount of abdominal fat reduction may be explained by the wide range of exercise in- tensities and amount of exercise employed in each study. There- fore, in the future, studies on exercise intervention with more specified intensity settings after controlling amount of active calories expended during exercise must be conducted.
Lee et al. [21] showed a significant increase in thigh normal density muscle with no significant changes in body weight and thigh low density muscle in obese diabetic subjects who per- formed moderate intensity exercise (60% VO2max) for 13 weeks. However, Boudou et al. [13] reported significant increase in thigh muscle mass without weight loss in male type 2 diabe- tes subjects who performed vigorous intensity exercise (75%
VO2max) for 12 weeks. In our study, the percent change of to- Fig. 1. Change in abdominal fat (A), mid-thigh fat (B), and
mid-thigh muscle (C) after 3-month intervention among 3 groups. TFA, total fat area; VFA, visceral fat area; SFA, subcu- taneous fat area; TSFA, mid-thigh subcutaneous fat area;
TFFA, mid-thigh subfascial fat area; TIMAT, mid-thigh intra- muscular adipose tissue; TTM, mid-thigh total muscle;
TLDM, mid-thigh low density muscle; TNDM, mid-thigh normal density muscle; CG, control group; MEG, moderate intensity exercise group; VEG, vigorous intensity exercise group. aP value <0.05 compared to control group.
TFA VFA SFA
10 0 -10
% Change of abdominal fat -20 a a a
CG MEG VEG A
TTM TLDM TNDM
20 10 0 -10 -20
% Change of mid-thigh muscle -30
a a
CG MEG VEG C
TSFA TFFA TIMAT
50 25 0 -25 -50
% Change of mid-thigh fat
CG MEG VEG B
Fig. 2. Change in insulin sensitivity after 3-month intervention among 3 groups. CG, control group; MEG, moderate intensity exercise group; VEG, vigorous intensity exercise group. aP val- ue <0.05 compared to control group.
CG MEG VEG
200 100 0 -100
% Change of KITT
a
tal mid-thigh skeletal muscle and normal density muscle was significantly higher in the vigorous intensity exercise group compared to the control group, but low density muscle was not significantly different among the groups after 12 weeks.
Muscle was classified as slow oxidative twitch fibers and fast glycolytic twitch fibers. When exercise intensity was between 40% and 60% of VO2max, the slow oxidative twitch fibers were used the most, and when exercise intensity was between 75%
and 90% of VO2max the fast glycolytic twitch fibers were used the most. Fast glycolytic twitch fibers are associated with mus- cle hypertrophy, and a greater increase in muscle mass can be observed as a result of vigorous intensity exercise group com- pared to moderate intensity exercise group in our study. Lee et al. [21] reported a significant increase in normal density mus- cle as a result of moderate intensity exercise, which is not con- sistent with the results from our study. However, this may be due to sex difference in each study. Therefore, further sex-based studies are required to confirm the interaction between sex and exercise intensity in its association with thigh composition.
Exercise improves insulin sensitivity trough AMP-kinase pathway activation [27]. It has been reported that vigorous in- tensity exercise is necessary in order to improve insulin sensi- tivity, however, when moderate exercise is performed more time is required [28,29]. Seals et al. [30], suggested that vigor- ous intensity aerobic exercise improves insulin sensitivity more than low intensity exercise after 12 weeks, and Boudou et al.
[13], also reported that KITT increased by 58% after vigorous intensity exercise (over 75% VO2max) after 8 weeks. In our study, percent changes of KITT, which reflects insulin sensitivi- ty, showed that vigorous intensity exercise group significantly improved insulin sensitivity compared to the control group, which is consistent with previous studies.
In our study, although the vigorous intensity exercise group showed a lower decrease in visceral fat than the moderate in- tensity exercise group, an increase in thigh normal density muscle and improved insulin sensitivity were observed. Al- though visceral fat increases insulin resistance [4,31], a de- crease in total muscle mass is also associated with insulin re- sistance [32,33]. In addition, since skeletal muscle is most re- sponsible for the use of insulin stimulated glucose, insulin re- sistance is associated with skeletal muscle in type 2 diabetes subjects. Kim et al. [34] showed the correlation between thigh normal density muscle and homeostasis model assessment of insulin resistance (HOMA-IR), and suggested normal density muscle is an independently associated with insulin resistance.
Goodpaster et al. [11] reported insulin sensitivity was nega- tively correlated with fat mass, visceral fat and subcutaneous fat and thigh fat and positively correlated with thigh normal density muscle and VO2max in health adult male and female.
Thus, in our study, the increase in thigh muscle is thought to improve insulin resistance in vigorous intensity exercise group.
In conclusion, the moderate intensity exercise group showed a significantly higher reduction in visceral fat than the control group, and vigorous intensity exercise group showed a signifi- cant increase in thigh normal density muscle and insulin sen- sitivity even though reducing visceral fat was lower than the moderate exercise group.
CONFLICTS OF INTEREST
No potential conflict of interest relevant to this article was re- ported.
REFERENCES
1. Nicklas BJ, Penninx BW, Cesari M, Kritchevsky SB, Newman AB, Kanaya AM, Pahor M, Jingzhong D, Harris TB; Health, Aging and Body Composition Study. Association of visceral adipose tissue with incident myocardial infarction in older men and women: the Health, Aging and Body Composition Study. Am J Epidemiol 2004;160:741-9.
2. Nishida Y, Higaki Y, Tokuyama K, Fujimi K, Kiyonaga A, Shin- do M, Sato Y, Tanaka H. Effect of mild exercise training on glucose effectiveness in healthy men. Diabetes Care 2001;24:
1008-13.
3. Sipila S, Elorinne M, Alen M, Suominen H, Kovanen V. Effects of strength and endurance training on muscle fibre character- istics in elderly women. Clin Physiol 1997;17:459-74.
4. Mourier A, Gautier JF, De Kerviler E, Bigard AX, Villette JM, Garnier JP, Duvallet A, Guezennec CY, Cathelineau G. Mobili- zation of visceral adipose tissue related to the improvement in insulin sensitivity in response to physical training in NIDDM.
Effects of branched-chain amino acid supplements. Diabetes Care 1997;20:385-91.
5. Giannopoulou I, Ploutz-Snyder LL, Carhart R, Weinstock RS, Fernhall B, Goulopoulou S, Kanaley JA. Exercise is required for visceral fat loss in postmenopausal women with type 2 dia- betes. J Clin Endocrinol Metab 2005;90:1511-8.
6. Irving BA, Davis CK, Brock DW, Weltman JY, Swift D, Barrett EJ, Gaesser GA, Weltman A. Effect of exercise training intensi-
ty on abdominal visceral fat and body composition. Med Sci Sports Exerc 2008;40:1863-72.
7. Williams PT, Franklin B. Vigorous exercise and diabetic, hy- pertensive, and hypercholesterolemia medication use. Med Sci Sports Exerc 2007;39:1933-41.
8. Kelley DE, Goodpaster BH. Skeletal muscle triglyceride: an as- pect of regional adiposity and insulin resistance. Diabetes Care 2001;24:933-41.
9. Divisova J, Kazdova L, Hubova M, Meschisvili E. Relationship between insulin resistance and muscle triglyceride content in nonobese and obese experimental models of insulin resistance syndrome. Ann N Y Acad Sci 2002;967:440-5.
10. Goodpaster BH, Thaete FL, Kelley DE. Thigh adipose tissue distribution is associated with insulin resistance in obesity and in type 2 diabetes mellitus. Am J Clin Nutr 2000;71:885-92.
11. Goodpaster BH, Thaete FL, Simoneau JA, Kelley DE. Subcuta- neous abdominal fat and thigh muscle composition predict in- sulin sensitivity independently of visceral fat. Diabetes 1997;46:
1579-85.
12. Schwartz RS, Shuman WP, Larson V, Cain KC, Fellingham GW, Beard JC, Kahn SE, Stratton JR, Cerqueira MD, Abrass IB. The effect of intensive endurance exercise training on body fat dis- tribution in young and older men. Metabolism 1991;40:545-51.
13. Boudou P, Sobngwi E, Mauvais-Jarvis F, Vexiau P, Gautier JF.
Absence of exercise-induced variations in adiponectin levels despite decreased abdominal adiposity and improved insulin sensitivity in type 2 diabetic men. Eur J Endocrinol 2003;149:
421-4.
14. Bonora E, Moghetti P, Zancanaro C, Cigolini M, Querena M, Cacciatori V, Corgnati A, Muggeo M. Estimates of in vivo in- sulin action in man: comparison of insulin tolerance tests with euglycemic and hyperglycemic glucose clamp studies. J Clin Endocrinol Metab 1989;68:374-8.
15. Sigal RJ, Kenny GP, Wasserman DH, Castaneda-Sceppa C.
Physical activity/exercise and type 2 diabetes. Diabetes Care 2004;27:2518-39.
16. Kumahara H, Schutz Y, Ayabe M, Yoshioka M, Yoshitake Y, Shindo M, Ishii K, Tanaka H. The use of uniaxial accelerome- try for the assessment of physical-activity-related energy ex- penditure: a validation study against whole-body indirect calo- rimetry. Br J Nutr 2004;91:235-43.
17. Borkan GA, Gerzof SG, Robbins AH, Hults DE, Silbert CK, Silbert JE. Assessment of abdominal fat content by computed tomography. Am J Clin Nutr 1982;36:172-7.
18. Goodpaster BH, Kelley DE, Wing RR, Meier A, Thaete FL. Ef-
fects of weight loss on regional fat distribution and insulin sensitivity in obesity. Diabetes 1999;48:839-47.
19. Despres JP. Abdominal obesity as important component of in- sulin-resistance syndrome. Nutrition 1993;9:452-9.
20. Ross R, Dagnone D, Jones PJ, Smith H, Paddags A, Hudson R, Janssen I. Reduction in obesity and related comorbid conditions after diet-induced weight loss or exercise-induced weight loss in men: a randomized, controlled trial. Ann Intern Med 2000;
133:92-103.
21. Lee S, Kuk JL, Davidson LE, Hudson R, Kilpatrick K, Graham TE, Ross R. Exercise without weight loss is an effective strategy for obesity reduction in obese individuals with and without type 2 diabetes. J Appl Physiol 2005;99:1220-5.
22. Nicklas BJ, Wang X, You T, Lyles MF, Demons J, Easter L, Ber- ry MJ, Lenchik L, Carr JJ. Effect of exercise intensity on ab- dominal fat loss during calorie restriction in overweight and obese postmenopausal women: a randomized, controlled trial.
Am J Clin Nutr 2009;89:1043-52.
23. Slentz CA, Houmard JA, Johnson JL, Bateman LA, Tanner CJ, McCartney JS, Duscha BD, Kraus WE. Inactivity, exercise train- ing and detraining, and plasma lipoproteins. STRRIDE: a ran- domized, controlled study of exercise intensity and amount. J Appl Physiol 2007;103:432-42.
24. Coker RH, Williams RH, Kortebein PM, Sullivan DH, Evans WJ. Influence of exercise intensity on abdominal fat and adi- ponectin in elderly adults. Metab Syndr Relat Disord 2009;7:
363-8.
25. Arner P. Impact of exercise on adipose tissue metabolism in humans. Int J Obes Relat Metab Disord 1995;19 Suppl 4:S18-21.
26. Pritzlaff CJ, Wideman L, Weltman JY, Abbott RD, Gutgesell ME, Hartman ML, Veldhuis JD, Weltman A. Impact of acute exercise intensity on pulsatile growth hormone release in men.
J Appl Physiol 1999;87:498-504.
27. Musi N, Fujii N, Hirshman MF, Ekberg I, Froberg S, Ljungqvist O, Thorell A, Goodyear LJ. AMP-activated protein kinase (AMPK) is activated in muscle of subjects with type 2 diabetes during exercise. Diabetes 2001;50:921-7.
28. Short KR, Vittone JL, Bigelow ML, Proctor DN, Rizza RA, Coenen-Schimke JM, Nair KS. Impact of aerobic exercise train- ing on age-related changes in insulin sensitivity and muscle oxidative capacity. Diabetes 2003;52:1888-96.
29. DiPietro L, Dziura J, Yeckel CW, Neufer PD. Exercise and im- proved insulin sensitivity in older women: evidence of the en- during benefits of higher intensity training. J Appl Physiol 2006;100:142-9.
30. Seals DR, Hagberg JM, Hurley BF, Ehsani AA, Holloszy JO.
Endurance training in older men and women. I. Cardiovascu- lar responses to exercise. J Appl Physiol 1984;57:1024-9.
31. Dvorak RV, DeNino WF, Ades PA, Poehlman ET. Phenotypic characteristics associated with insulin resistance in metaboli- cally obese but normal-weight young women. Diabetes 1999;
48:2210-4.
32. Goodpaster BH, Kelley DE. Role of muscle in triglyceride me- tabolism. Curr Opin Lipidol 1998;9:231-6.
33. Pan DA, Lillioja S, Kriketos AD, Milner MR, Baur LA, Bogar- dus C, Jenkins AB, Storlien LH. Skeletal muscle triglyceride levels are inversely related to insulin action. Diabetes 1997;46:
983-8.
34. Kim SK, Park SW, Hwang IJ, Lee YK, Cho YW. High fat stores in ectopic compartments in men with newly diagnosed type 2 diabetes: an anthropometric determinant of carotid atheroscle- rosis and insulin resistance. Int J Obes (Lond) 2010;34:105-10.