J Korean Surg Soc 2012;82:28-34
http://dx.doi.org/10.4174/jkss.2012.82.1.28
ORIGINAL ARTICLE
Journal of the Korean Surgical Society
JKSS
pISSN 2233-7903ㆍeISSN 2093-0488
Received June 7, 2011, Revised September 23, 2011, Accepted September 30, 2011 Correspondence to: Hyun Yong Hwang
Department of Laboratory Medicine, Kosin University Gospel Hospital, Kosin University College of Medicine, 34 Amnam-dong, Seo-gu, Busan 602-702, Korea
Tel: +82-51-990-6279, Fax: +82-51-990-3010, E-mail: [email protected]
cc Journal of the Korean Surgical Society is an Open Access Journal. All articles are distributed under the terms of the Creative Commons Attribution Non-Commercial License (http://creativecommons.org/licenses/by-nc/3.0/) which permits unrestricted non-commercial use, distribution, and reproduction in any medium, provided the original work is properly cited.
A practical approach for assessing chemosensitivity in colorectal cancer cell lines by comparative analysis of cell viability and thymidylate synthase mRNA
expression
Hyun Yong Hwang
Department of Laboratory Medicine, Kosin University Gospel Hospital, Kosin University College of Medicine, Busan, Korea
Purpose: The purpose of this study is to suggest a probable problem in chemosensitivity tests performed in practice and to speculate on practicable measures for more accurate chemosensitivity evaluation. Methods: Three colorectal cancer cells (RSC, RRC1, and RRC2) were treated with 5-fluorouracil (5-FU). Inhibition percentage (%inhibition) of cancer cells and rela- tive quantitation of thymidylate synthase (TS) mRNA were measured on day 2, day 5 after replacement of 70% media on day 2, day 7, and day 3 after replacement of all media on day 7. Doses that produced 50% inhibition (Dm) were calculated to eval- uate drug effect. Relative quantitation of TS mRNA and correlations between TS mRNA levels and 5-FU concentrations were analyzed. Results: RRC1 was more resistant than RRC2 on day 7, but Dm value of RRC2 increased three days after replace- ment of media from 12.3 to 18.1. Mean TS mRNA levels of RSC on D2 and D7 were significantly lower than those of RRC1 and RRC2, respectively (P = 0.004, P = 0.004 on D2; P = 0.010, P = 0.006 on D7). TS mRNA levels in RRC1 were significantly re- versely correlated with 5-FU concentrations on day 2 (correlation coefficient = -0.867, P = 0.015). On the other hand, correla- tions were not significant in RRC2 (r = 0.067). Conclusion: Evaluating %inhibition of cancer cells at one point in chemo- sensitivity tests seems to be inadequate in determining chemotherapeutic regimens. Multilateral approaches, such as trials evaluating cancer cell survival before and after media replacement and correlations between TS mRNA levels and 5-FU con- centrations, needs to be implemented for the practical application of chemosensitivity tests.
Key Words: Drug effects, 5-fluorouracil, Thymidylate synthase
INTRODUCTION
When chemosensitivity testing is performed for chemo- therapy in patients, the interpretation of it is usually done on day 2 to 7 after test [1-5]. This is just considering in-
hibition percentage (%inhibition) of cancer cells at one point in the lifetime of the cancer cells; however, the in- hibition rates of cancer cells in vivo may differ depending on the characteristics of the cancer cell, which might cause some unexpected results in practice. If unexpected behav-
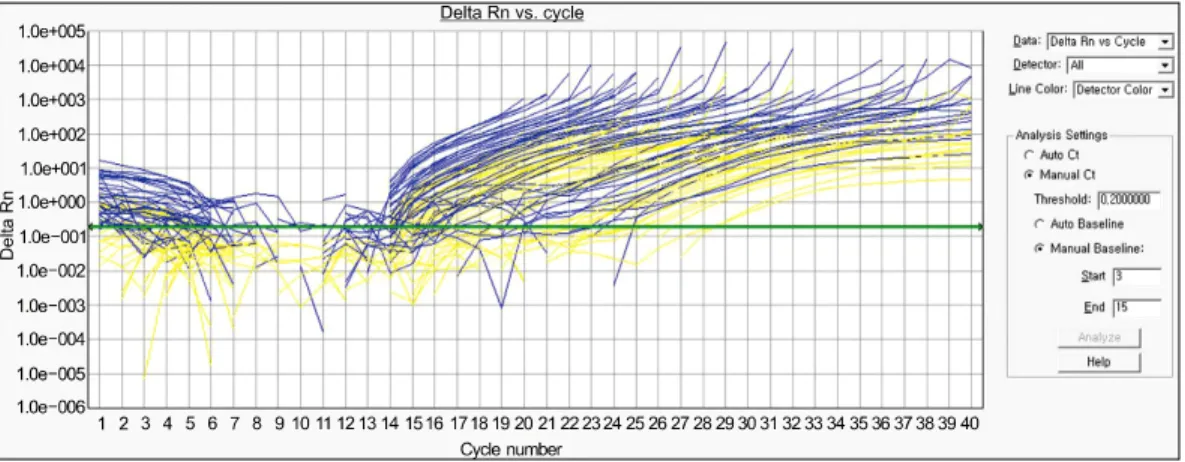
Fig. 1. Amplification curve of realtime quantitative polymerase chain reaction (PCR) for thymidylate synthase (TS) mRNA and glyceraldehyde-3-phosphate dehydrogenase (GAPDH). FAM dye and JOE dye were used for TS mRNA and GAPDH, respectively. One cycle of reverse transcription (stage 1, 42oC 5 minutes; stage 2, 95oC 10 seconds) and 40 cycles of PCR reaction (stage 3, 95oC 5 seconds; 60oC 30 seconds) were performed for real-time quantitative PCR. Blue lines and yellow lines indicate TS mRNA and GAPDH, respectively. All tested extracted RNAs were drawn in the figure together.
iors relating to genetic characteristics are observed in can- cer cells after chemosensitivity tests have been completed, it might be dangerous to treat patients according to the re- sults of the test. Here, the author intends to suggest a likely problem in chemosensitivity testing performed in practice and speculates on practicable measures for more accurate chemosensitivity evaluation.
METHODS
Cancer cell and chemical
Three kinds of cancer cells (RSC, RRC1, and RRC2) were derived from SNU-C2A and SNU-C1 colorectal cancer cell lines purchased from the Korean cell line bank. The cancer cells were cultured in Dulbecco's Modified Eagle’s Medi- um (Invitrogen, Carlsbad, CA, USA) containing 10% fetal bovine serum (Invitrogen), 50,000 U/L penicillin (Invitro- gen), 80 μM streptomycin (Invitrogen), and 0.25 μg ampho- tericin B (Invitrogen) in a humidified incubator (Sanyo, Gunma, Japan) at 37oC with an atmosphere of 10% CO2. 5-fluorouracil (5-FU) was used as a cancer drug. 50 μg/mL was used as 100% treatment dose of 5-FU.
Culture and treatment
Cancer cells were cultured in 96-well plates for chemo- sensitivity and 6-well plates for mRNA quantitation. Can-
cer cells were treated with serially diluted 5-FU from 0 (no drug) to 200% treatment dose. Each cancer cell line was plated in a 96-well plate at a density of 5 × 10³ cells/well and in a 6-well plate at a density of 8 × 10⁴ cells/well, respec- tively. Negative control (no cell) was also included in each evaluation plate. Inhibition percentage of cancer cell and relative quantitation of thymidylate synthase (TS) mRNA were measured in each 96-well plate and 6-well plate on day 2 (D2), day 5 after 70% media replacement on day 2 (D2+5), day 7 (D7), and day 3 after 100% media replace- ment on day 7 (D7+3), respectively. Here, media replace- ment was intended to induce regrowth of cancer cells.
Chemosensitivity evaluation
The effect of the drug on cell viability was tested using a CellTiter 96 Aqueous non-radioactive cell proliferation assay kit (Promega Co., Madison, WI, USA). After incubat- ing the test plate with reagents of the assay kit for 2 hours at 37°C in a humidified 5% CO2 atmosphere, absorbance at 490 nm was measured using a microplate reader. Tests were repeated three times, and the means of the test results were used for analyses. Inhibition percentage of cancer cell line was calculated using the following equations:
T/C = Absorbance of cultured cancer cell treated with 5-FU / Absorbance of cultured cancer cell not treated with 5-FU
%inhibition of cancer cell = (1-T/C) × 100 [6]
Fig. 2. Dose-effect curve on each evaluation day. Shown are dose-effect curve on D2 and D2+5 (A) and D7and D7+3 (B) in each cancer cell line. D2, day 2; D2+5, day 5 after 70% media replacementon day 2; D7, day 7; D7+3, day 3 after 100% media replacement on day 7.
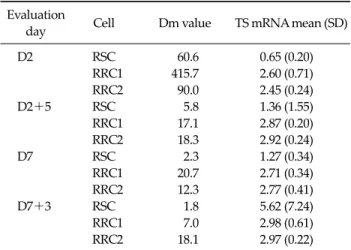
Table 1. Dm values and mean values of TS mRNA in each cancer cell
Evaluation
day Cell Dm value TS mRNA mean (SD)
D2 RSC 60.6 0.65 (0.20)
RRC1 415.7 2.60 (0.71)
RRC2 90.0 2.45 (0.24)
D2+5 RSC 5.8 1.36 (1.55)
RRC1 17.1 2.87 (0.20)
RRC2 18.3 2.92 (0.24)
D7 RSC 2.3 1.27 (0.34)
RRC1 20.7 2.71 (0.34)
RRC2 12.3 2.77 (0.41)
D7+3 RSC 1.8 5.62 (7.24)
RRC1 7.0 2.98 (0.61)
RRC2 18.1 2.97 (0.22)
Dm, median-effect dose; TS, thymidylate synthase. D2, day 2; D2+
5, day 5 after 70% media replacement on day 2; D7, day 7; D7+3, day 3 after 100% media replacement on day 7.
Median-effect dose (Dm), the dose that produces 50%
effect, was calculated with CalcuSyn (Biosoft, Cambridge, UK).
Relative quantitation of TS mRNA
RNA was extracted from cancer cell using the Absolute- ly RNA Microprep kit (Stratagene, La Jolla, CA, USA).
Quantitative real-time polymerase chain reaction (PCR) was performed with the One Step PrimeScript RT-PCR kit (Takara Bio Inc., Shiga, Japan); transcription of cDNA and quantitation of TS mRNA with TaqMan TS mRNA gene
expression assay kit (Applied Biosystems, Foster City, CA, USA) were performed in the ABI prism 7700 (Applied Biosystems). TaqMan glyceraldehyde-3-phosphate dehy- drogenase (GAPDH) (Applied Biosystems) was used as an internal control. Relative quantitation of TS mRNA was calculated with TS mRNA and GAPDH (Fig. 1).
Statistical analysis
TS mRNA levels in each cancer cell on four evaluation days were compared by Mann-Whitney U test. To analyze the difference of TS mRNA quantitation according to the change of 5-FU concentration on each evaluation day, the correlation between TS mRNA level and 5-FU concen- tration was evaluated with Kendall’s tau-b. Statistical sig- nificance was established at the P < 0.05 level for each analysis.
RESULTS
Chemosensitivity evaluation
RSC was the most sensitive on all evaluation days (Table 1, Fig. 2). RRC1 was the most resistant against 5-FU on D2 and D7. Dm values of RRC1 were 6.9 times and 4.6 times higher than RSC and RRC2 on D2, respectively, and those of RRC1 on D7 were 9 times and 1.7 times higher than RSC and RRC2 on D7, respectively. RRC2 was the most resistant on D2+5 and D7+3. Dm values of RRC2 were 3.1 times
Table 2. Change of Dm values after media replacement
Change of Dm value after media replacement (%) D2 vs. D2+5 D7 vs. D7+3
RSC 9.6↓a) 78.3↓
RRC1 4.1↓ 33.8↓
RRC2 20.3↓ 147.2↑b)
Dm, median-effect dos; D2, day 2; D2+5, day 5 after 70% media replacement on day 2; D7, day 7; D7+3, day 3 after 100% media replacement on day 7.
a)Decrease. b)Increase.
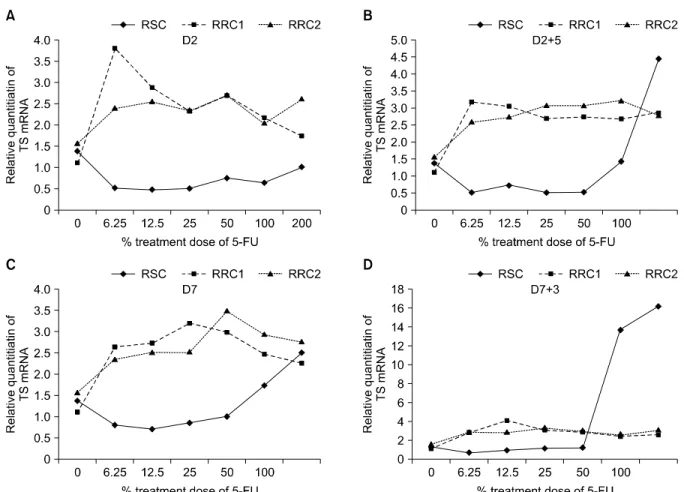
Fig. 3. Relative quantitation of thymidylate synthase (TS) mRNA in serially diluted 5-fluorouracil (5-FU) concentrations. Correlations between TS mRNA levels and 5-FU concentrations were evaluated with Kendall’s tau-b on D2 (A), D2+5 (B), D7 (C), and D7+3 (D). D2, day 2; D2+5, day 5 after 70% media replacement on day 2; D7, day 7; D7+3,day 3 after 100% media replacement on day 7.
and 1.1 times higher than RSC and RRC1 on D2+5, respec- tively, and those of RRC2 on D7+3 were 10.1 times and 2.6 times higher than RSC and RRC1 on D7+3, respectively.
Dm values on D2 decreased after media replacement on D2+5 (9.6%, 4.1%, and 20.3% in RSC, RRC1, and RRC2, re- spectively). Dm values on D7 decreased after media re-
placement on D7+3 (78.3% and 33.8% in RSC, RRC1, re- spectively), on the other hand, Dm value on D7 increased in RRC2 after media replacement on D7+3 (147.2%) (Table 2).
Relative quantitation of TS mRNA
Mean TS mRNA levels in RSC in tested 5-FU concen- trations were lower than those of RRC1 and RRC2 on D2, D2+5, and D7; however, TS mRNA value of RSC was higher than those of RRC1 and RRC2 on D7 (Table 1).
Mean TS mRNA levels of RSC on D2 and D7 were sig- nificantly lower than those of RRC1 and RRC2, re- spectively (P = 0.004, P = 0.004 on D2; P = 0.010, P = 0.006 on D7).
Correlation between TS mRNA values and 5-FU concentrations
TS mRNA levels in RRC1 were significantly reversely correlated with 5-FU concentrations on D2 (correlation co- efficient, r = -0.867). On the other hand, correlations were not significant in RRC2 (r = 0.067) (Fig. 3). Those correla- tions in RSC were not as strong on D2 (r = 0.600) but sig- nificantly strong on D7 and D7+3 (r = 0.867, r = 1.000, re- spectively).
DISCUSSION
In Table 1 and Fig. 2, chemosensitivity against 5-FU on D7 indicated that RSC was the most sensitive and RRC1 was the most resistant among tested cancer cells. RRC1 is more resistant to 5-FU than RRC2 on D7, but %inhibition in RRC1 and RRC2 showed some changes on D7+3. Dm value increased from 12.3 to 18.1 in RRC2 while decreasing continuously in RRC1 (Tables 1, 2). If the chemosensitivity is decided on D7, RRC1 is definitely the most resistant among tested cancer cells in this study. However, the most resistant to 5-FU is RRC2 on D7+3. If this happens in pa- tients, it would be difficult to decide whether or not to ac- cept the results of chemosensitivity on D7. This also raises the question of whether the chemosensitivity test measur- ing %inhibition of cancer cells at one point of their lifetime could completely guarantee the destination of cancer cells after chemotherapy in vitro.
Here, the author evaluated %inhibition of cancer cells before and after media replacement intended to help re- growth of cancer cells after chemotherapy. This was also an attempt to make a cultural environment closer in sim- ilarity to in vivo status, because less damaged cancer cells would normally obtain enough nutrients from the body after the direct effects of chemotherapy ended. As a result, evaluating %inhibition of cancer cells before and after me- dia replacement seemed to be helpful to better differ- entiate between sensitive and resistant cancer cells in this study.
When 5-FU is administered to patients, its metabolite, 5-fluoro-2’-deoxyuridine-5’-monophosphate, binds to TS involved in DNA synthesis [7-9]. Significant relations be-
tween TS levels and 5-FU sensitivity have been reported [10,11]. Although the correlation between TS mRNA and protein expression is not always significant [12], TS mRNA levels are known to be higher in the 5-FU resistant cancer group compared to the 5-FU sensitive group [13-15].
In Table 1, mean values of TS mRNA in RSC on D2 and D7 showed significantly low values compared to those in RRC1 and RRC2, respectively (P = 0.004, P = 0.004 on D2; P
= 0.010, P = 0.006 on D7). On D2+5 and D7+3, relative quantitations of TS mRNA at 100 and 200% treatment dose of 5-FU in RSC were very high compared to those at other concentrations. After all, these increased levels are thou- ght to make it difficult to differentiate between RSC and RRC1 or between RSC and RRC2 on D2+5 and D7+3.
TS levels as determined by enzyme activity assays, im- munohistochemistry and mRNA expression were repor- ted to be initially decreased by 5-FU treatment, which were followed by induction of TS [16]. When patients with colorectal cancer were given one presurgery bolus of 5-FU, TS mRNA expressions in primary cancer cells of exposed patients were higher than in those of unexposed patients [17]. These studies indicate that 5-FU exposure can affect TS mRNA expression levels in cancer cells. However, the correlations between TS mRNA levels and 5-FU concen- trations are not well known.
In Fig. 3, significant correlation between TS mRNA lev- els in RRC1 and 5-FU concentrations were observed on D2 (correlation coefficient, r = -0.867), but such significant correlations were not found in RRC2 (r = 0.067) (Fig. 3).
And those correlations in RSC were also significantly strong on D7 and D7+3 (r =0.867, r = 1.000, respectively).
Correlations between TS mRNA values and 5-FU concen- trations, as well as mean values of TS mRNA in Table 1, combine to be able to differentiate among RSC, RRC1, and RRC2 in this study. Although TS enzyme activity was not measured in this study, changes in TS mRNA expression levels to 5-FU concentrations seem to affect the response of cancer cells against 5-FU treatment.
Each cancer cell has its own genetic characteristic re- ported to cause different responses against the same che- motherapeutic environment [18-20]. And chemotherapy itself is a very invasive procedure compared to antibiotics
treatment in patients, which makes physicians very care- ful and sometimes hesitant to treat patients according to the chemosensitivity results. Therefore, various approa- ches to provide more accurate chemosensitivity have to be developed for practical application.
In Korea, two assay methods for chemosensitivity, his- toculture drug response assay and adenosine triphos- phate-based chemotherapy response assay are being used in practice [4,5]. As previously mentioned, those tests only evaluate %inhibition of cancer cell at one point after che- motherapy, which might not always predict the destina- tion of cancer cells due to different characteristics of in- dividual cancer cells.
Chemosensitivity tests measuring inhibition of cancer cells do not evaluate pharmacokinetic and pharmacoge- netic processes significantly affecting chemosensitivity in the body. An integrated approach based on a pharmacoki- netic analysis combined with dihydropyrimidine dehy- drogenase genotyping and/or phenotyping has been sug- gested to be a safer strategy for optimizing the admin- istration of 5-FU [21]. And a combination of germline TS polymorphisms was reported to be an independent prog- nostic marker in selecting colorectal cancer patients with poor prognosis [22]. However, commercially available chemosensitivity tests measuring cancer cell survival have excluded these pharmacokinetic and pharmacogenetic perspectives until now.
Although more numbers of cases showing conversion of Dm values as seen in this study are needed to make con- clusive results more concrete, evaluating %inhibition of cancer cells at one point in a chemosensitivity test seems to be insufficient to determine chemotherapeutic regimens.
Multilateral approaches, such as trials in this study evalu- ating cancer cell survival before and after media replace- ment and correlations between TS mRNA levels and 5-FU concentrations, need to be implemented for the practical application of chemosensitivity testing.
CONFLICTS OF INTEREST
No potential conflict of interest to relevant this article was reported.
ACKNOWLEDGEMENTS
This research was supported by the Basic Science Research Program through the National Research Foun- dation of Korea (NRF) funded by the Ministry of Educa- tion, Science and Technology (KRF-2008-331-E00311).
REFERENCES
1. Rubinstein LV, Shoemaker RH, Paull KD, Simon RM, Tosini S, Skehan P, et al. Comparison of in vitro anti- cancer-drug-screening data generated with a tetrazolium assay versus a protein assay against a diverse panel of hu- man tumor cell lines. J Natl Cancer Inst 1990;82:1113-8.
2. Sevin BU, Peng ZL, Perras JP, Ganjei P, Penalver M, Averette HE. Application of an ATP-bioluminescence as- say in human tumor chemosensitivity testing. Gynecol Oncol 1988;31:191-204.
3. Kinoshita M, Kodera Y, Hibi K, Nakayama G, Inoue T, Ohashi N, et al. Gene expression profile of 5-fluorouracil metabolic enzymes in primary colorectal cancer: potential as predictive parameters for response to fluorour- acil-based chemotherapy. Anticancer Res 2007;27:851-6.
4. Huh JW, Park YA, Lee KY, Sohn SK. Heterogeneity of ad- enosine triphosphate-based chemotherapy response assay in colorectal cancer--secondary publication. Yonsei Med J 2009;50:697-703.
5. Furukawa T, Kubota T, Hoffman RM. Clinical applications of the histoculture drug response assay. Clin Cancer Res 1995;1:305-11.
6. Blumenthal RD. Chemosensitivity. Vol. 1, In vitro assays.
Totowa: Humana Press; 2005.
7. Ishikawa Y, Kubota T, Otani Y, Watanabe M, Teramoto T, Kumai K, et al. Dihydropyrimidine dehydrogenase activ- ity and messenger RNA level may be related to the anti- tumor effect of 5-fluorouracil on human tumor xenografts in nude mice. Clin Cancer Res 1999;5:883-9.
8. Langenbach RJ, Danenberg PV, Heidelberger C. Thymidy- late synthetase: mechanism of inhibition by 5-fluoro-2'- deoxyuridylate. Biochem Biophys Res Commun 1972;48:
1565-71.
9. Jung H, Lee JI, Lee HH, Kim SH, Hur H, Jeon HM. Gastric cancer susceptibility according to methylenetetrahydrofo- late reductase and thymidylate synthase gene polymor- phism. J Korean Surg Soc 2010;79:27-34.
10. Johnston PG, Drake JC, Trepel J, Allegra CJ. Immunologi- cal quantitation of thymidylate synthase using the mono- clonal antibody TS 106 in 5-fluorouracil-sensitive and -resistant human cancer cell lines. Cancer Res 1992;52:
4306-12.
11. Van Triest B, Peters GJ. Thymidylate synthase: a target for combination therapy and determinant of chemotherapeu- tic response in colorectal cancer. Oncology 1999;57:179-94.
12. Grem JL, Danenberg KD, Behan K, Parr A, Young L, Danenberg PV, et al. Thymidine kinase, thymidylate syn- thase, and dihydropyrimidine dehydrogenase profiles of cell lines of the National Cancer Institute's Anticancer Drug Screen. Clin Cancer Res 2001;7:999-1009.
13. Johnston PG, Lenz HJ, Leichman CG, Danenberg KD, Allegra CJ, Danenberg PV, et al. Thymidylate synthase gene and protein expression correlate and are associated with response to 5-fluorouracil in human colorectal and gastric tumors. Cancer Res 1995;55:1407-12.
14. Salonga D, Danenberg KD, Johnson M, Metzger R, Gro- shen S, Tsao-Wei DD, et al. Colorectal tumors responding to 5-fluorouracil have low gene expression levels of dihy- dropyrimidine dehydrogenase, thymidylate synthase, and thymidine phosphorylase. Clin Cancer Res 2000;6:1322-7.
15. Okumura K, Mekata E, Shiomi H, Naitoh H, Abe H, Endo Y, et al. Expression level of thymidylate synthase mRNA reflects 5-fluorouracil sensitivity with low dose and long duration in primary colorectal cancer. Cancer Chemother Pharmacol 2008;61:587-94.
16. Peters GJ, Backus HH, Freemantle S, van Triest B, Codacci- Pisanelli G, van der Wilt CL, et al. Induction of thymidylate synthase as a 5-fluorouracil resistance mechanism. Biochim Biophys Acta 2002;1587:194-205.
17. Mauritz R, van Groeningen CJ, Smid K, Jansen G, Pinedo HM, Peters GJ. Thymidylate synthase and dihydropyr-
imidine dehydrogenase mRNA expression after admin- istration of 5-fluorouracil to patients with colorectal cancer.
Int J Cancer 2007;120:2609-12.
18. Brennetot C, Buhard O, Jourdan F, Flejou JF, Duval A, Hamelin R. Mononucleotide repeats BAT-26 and BAT-25 accurately detect MSI-H tumors and predict tumor con- tent: implications for population screening. Int J Cancer 2005;113:446-50.
19. Elsaleh H, Joseph D, Grieu F, Zeps N, Spry N, Iacopetta B.
Association of tumour site and sex with survival benefit from adjuvant chemotherapy in colorectal cancer. Lancet 2000;355:1745-50.
20. Ribic CM, Sargent DJ, Moore MJ, Thibodeau SN, French AJ, Goldberg RM, et al. Tumor microsatellite-instability status as a predictor of benefit from fluorouracil-based ad- juvant chemotherapy for colon cancer. N Engl J Med 2003;349:247-57.
21. Bocci G, Di Paolo A, Barbara C, Masi G, Fornaro L, Loupakis F, et al. Pharmacokinetics, a main actor in a many-sided approach to severe 5-FU toxicity prediction. Br J Clin Pharmacol 2009;67:132-4.
22. Hitre E, Budai B, Adleff V, Czeglédi F, Horáth Z, Gyergyay F, et al. Influence of thymidylate synthase gene poly- morphisms on the survival of colorectal cancer patients re- ceiving adjuvant 5-fluorouracil. Pharmacogenet Genomics 2005;15:723-30.