TCP
Transl Clin Pharmacol http://dx.doi.org/10.12793/tcp.2017.25.1.28 2017;25(1):28-33Hydrochlorothiazide does not increase
furosemide’s effects in end-stage renal disease
Wooseong Huh
1, Ha-Young Oh
1, Jin Suk Han
2, In-Jin Jang
3and Dong-Seok Yim
4*
1Department of Internal Medicine, Samsung Medical Center, Sungkyunkwan University School of Medicine, Seoul 06351, Korea,
2Department of Internal Medicine, College of Medicine, Seoul National University College of Medicine and Hospital, Seoul 03080, Korea, 3Department of Clinical Pharmacology and Therapeutics, Seoul National University College of Medicine and Hospital, Seoul 03080, Korea, 4PIPET (Pharmacometrics Institute for Practical Education and Training), College of Medicine, The Catholic University of Korea, Seoul 06591, Korea
*Correspondence: D. S. Yim; Tel: +82-2-2258-7327, E-mail: [email protected]
Introduction
Congestive heart failure (CHF) is one of common diseases found in dialysis patients. When present at the initiation of dialysis, CHF is an adverse, independent, prognostic indicator of mortality, and hypertension is known as its major risk fac- tor in dialysis patients.[1] One of the important goals of blood pressure control in these patients is the prevention of excessive weight gain (edema) between successive episodes of dialysis.[2]
Diuretics are useful in the treatment of hypertension and edema in renal patients. However, patients with chronic renal insufficiency also have diuretic resistance. Causes of the resis- tance that have been suggested are decreased numbers of func- tioning nephrons, decreased tubular delivery of diuretics, and augmented sodium reabsorption in the distal tubules.[3,4] To circumvent such limitations, combination diuretic treatment is
recommended; its aim is to act on different nephron segments so that each diuretic might enhance the response of the other.[5]
If combination diuretic therapy were effective for the treatment of edema in dialysis patients, it would improve the prognosis for those with CHF. However, it is difficult to evaluate the efficacy of diuretic combination in patients under dialysis, as their he- modynamic states vary with dialysis time and the intervals be- tween episodes of dialysis. We therefore performed a crossover study to evaluate the efficacy of furosemide alone and in com- bination with hydrochlorothiazide in patients with end stage renal disease (ESRD: creatinine clearance < 10 ml/min/1.73 m2) before the initiation of dialysis therapy.
Methods
Subjects
We recruited 10 patients with creatinine clearance less than 10 ml/min/1.73 m2 who had never undergone any renal replace- ment therapy such as hemodialysis or peritoneal dialysis. The patients had been followed up for known renal failure as outpa- Diuretic therapy for the treatment of edema in patients with end-stage renal disease (ESRD) is un- satisfactory, and a combination of thiazide and loop diuretics may produce better clinical effects.
To evaluate the influence of thiazide on loop diuretic therapy for ESRD, we performed a crossover study of furosemide versus hydrochlorothiazide plus furosemide treatment. The diuretic effects of furosemide (160 mg i.v.) alone versus a combination of hydrochlorothiazide (100 mg p.o.) and furosemide were studied in ten ESRD patients with proteinuria greater than 1 g/day. The diuretic effects were compared for 24 h urine volume and electrolyte excretion. To detect the influence of thiazide that may have been obscured in the widely dispersed data, pharmacodynamic analysis of urine furosemide excretion rate versus fractional excretion of sodium (FeNa) was also performed using mixed-effect modeling. Combination therapy was not significantly different from furosemide monotherapy in terms of 24 h urine volume, chloride, or sodium excretion. Hydrochlorothiazide was not a significant covariate in the furosemide effect for the pharmacodynamic model. In patients with ESRD and severe proteinuria (>1,000 mg/day), the combination of hydrochlorothiazide with furosemide therapy did not increase the diuretic effect of furosemide.
Received 6 Feb 2017 Revised 27 Feb 2017 Accepted 27 Feb 2017
Keywords
Furosemide, Thiazide, ESRD
pISSN: 2289-0882 eISSN: 2383-5427
Copyright © 2017 Translational and Clinical Pharmacology
It is identical to the Creative Commons Attribution Non-Commercial License (http://creativecommons.org/licenses/by-nc/3.0/).
This paper meets the requirement of KS X ISO 9706, ISO 9706-1994 and ANSI/NISO Z.39.48-1992 (Permanence of Paper).
ORIGINAL ARTICLE
TCP
Transl Clin Pharmacol
tients. When the disease status had advanced to the end-stage, they were admitted and the present study was performed just before their first hemodialysis.
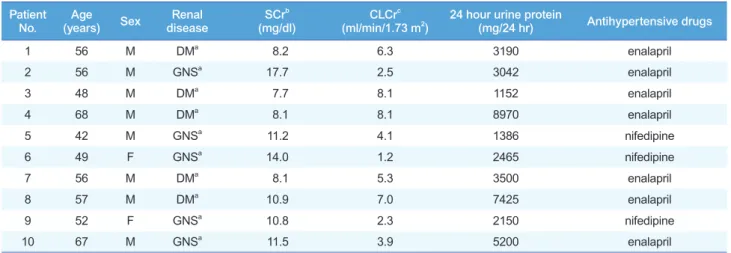
The patients were aged 56–67 years (eight men, two women) with underlying diabetes mellitus (five patients) or suspected glomerulonephritis (five patients: Table 1). Severe proteinuria (>1,000 mg/day) was a common finding, regardless of the pa- tient’s underlying disease. All patients were taking enalapril or nifedipine to control their hypertension. Although the dos- age regimens of anti-hypertensive agents were kept constant throughout the study period, prescribed diuretics—if any—
were withheld at least 48 h before the initiation of the study.
The patients gave written informed consent to this trial after full explanation of the protocol. However, those who needed emergency hemodialysis for pulmonary edema, hyperkalemia with abnormal electrocardiogram, severe metabolic acidosis, or uremia were precluded. The Institutional Review Board of Sam- sung Medical Center approved the research protocol.
Study Design
Patients were admitted at least two days before the study and a low salt diet was prescribed. Diuretics were discontinued on the day of admission without changing the other medications. A randomized crossover study of furosemide monotherapy versus coadministration of furosemide and hydrochlorothiazide (PK/
PD) was performed with a 24 h washout period. The scheme of the study is summarized as: first baseline data collection (urine collection for 24 h); diuretic PK/PD study (first phase, 24 h);
washout (24 h); second baseline data collection (24 h); diuretic PK/PD study (second phase, 24 h). One hundred and sixty milligrams of furosemide, dissolved in 100 ml of 5% dextrose solution, was intravenously infused into the patients for 30 min- utes starting at 09:00 on each of the two study phases. During coadministration, which was randomly allocated into the first
or second phase, 25 mg of oral hydrochlorothiazide was given four times every 6 h beginning at 09:00. Urine was collected at
Furosemide only
0 10 20 30 40 50
0 10 20 30 40
Furosemide Excretion Rate (mg/min) FeNa (%)
Furosemide + Hydrochlorothiazide
Time (Hour)
0 10 20 30 40 50
0 10 20 30 40
Figure 1. Furosemide excretion rate (closed circles) and FeNa (frac- tional excretion of sodium, open circles) observed with and without hydrochlorothiazide treatment. (Means ± S.D.)
Patient
No. Age
(years) Sex Renal
disease SCrb
(mg/dl) CLCrc
(ml/min/1.73 m2) 24 hour urine protein
(mg/24 hr) Antihypertensive drugs
1 56 M DMa 8.2 6.3 3190 enalapril
2 56 M GNSa 17.7 2.5 3042 enalapril
3 48 M DMa 7.7 8.1 1152 enalapril
4 68 M DMa 8.1 8.1 8970 enalapril
5 42 M GNSa 11.2 4.1 1386 nifedipine
6 49 F GNSa 14.0 1.2 2465 nifedipine
7 56 M DMa 8.1 5.3 3500 enalapril
8 57 M DMa 10.9 7.0 7425 enalapril
9 52 F GNSa 10.8 2.3 2150 nifedipine
10 67 M GNSa 11.5 3.9 5200 enalapril
Table 1. Demographic profile of the patients with ESRD
aDM, diabetic nephropathy; GNS, glomerulonephritis suspected. bSCr, serum creatinine. cCLCr, creatinine clearance.
Wooseong Huh, et al.
TCP
Transl Clin Pharmacolintervals of 0–3, 3–6, 6–12 and 12–24 h for both of the study phases, as well as for baseline phases. As the washout period between the phases could not be allowed long enough because of the patients’ disease status, 24 h urine collection for baseline data was performed one day before each study phase. This was also to examine whether the degree of electrolyte excretion was influenced by the previous diuretic medication, i.e. the appro- priateness of the washout interval, which could not be given for long enough in these ESRD patients.
To evaluate whether the pharmacokinetics of furosemide were changed by thiazide administration, 10 ml of venous blood was drawn into heparinized tubes at 0, 0.5, 1, 3, 6, 12 and 24 h after the start of furosemide infusion in both of the study phases. The plasma, separated immediately after sampling, was stored –70°C until the furosemide concentration assay could be performed.
Analysis of Urine and Plasma Samples
We measured urine sodium and urea by ion-selective methods (Synchron CX3, Beckman, Germany) and creatinine in blood and urine by Jaffe’s method (Hitachi 747, Hitachi, Japan). Pro- tein in 24 h urine samples was measured by the pyrogallol red- molybdate complex method (Hitachi 747, Hitachi, Japan). Fu- rosemide concentrations in urine and plasma were measured by high performance liquid chromatography (HPLC) as described elsewhere.[6]
Plasma Furosemide Pharmacokinetics
The area under the curve (AUC), plasma clearance rates and half-life of furosemide in plasma were obtained by the non- compartmental analysis method using PkCalc.[7] The urinary excretion rate of furosemide was calculated on the basis of the urine concentration and volume per collection time interval.
Statistical Tests
To compare the effects between monotherapy and coadmin- istration, pharmacokinetic parameters, 24 h urine volumes and excreted amounts of sodium and chloride were tested by Wilcoxon signed rank tests. Changes in electrolyte excretion in comparison with the baseline values after each phase were also tested by Wilcoxon signed rank tests.
Pharmacodynamic Modeling We performed a mixed-effects model analysis using NONMEMâ (Ver- sion 5.0)[8] to detect the influence of hydrochlorothiazide that may not be found significant by the statistical tests mentioned above. The fractional excretion of sodium (FeNa), which is less influenced by diet and water in- take, was used as a surrogate endpoint and its relationship with urine furo- semide excretion rate was assessed.
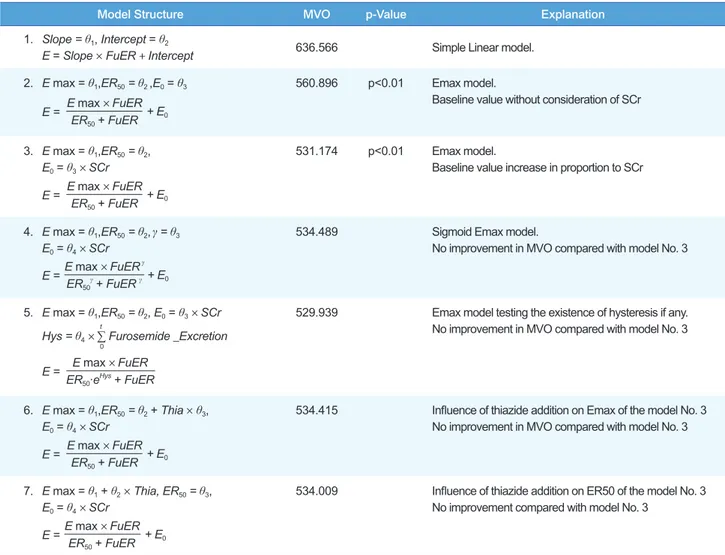
To find the appropriate model, we compared linear, Emax and sigmoid Emax models. The existence of hysteresis was also tested by adding cumulative amount of excreted furosemide as a covariate.[9] As the Emax model was better than the linear and sigmoid Emax models, further evaluation of pharmacody- namic parameters, such as Emax, ER50 (the excretion rate which shows effect equivalent to 50% of Emax) and E0 (baseline FeNa value) and their distribution, was performed. Serum creatinine concentrations and the addition of thiazide (1 for thiazide addi- tion, 0 for furosemide only) were tested for their contribution to the pharmacodynamic parameters. Inter-individual differences were estimated with an exponential model and the residual er- ror with a proportional model.
Difference in the minimal value of objective function (MVO) was used as a selection criterion between models. The level of statistical significance was set at P < 0.01 (a decrease in the MVO of > 6.6).
Results
Urine volume and excreted amounts of sodium and chloride
The 24 h urine volume increased significantly following furo- semide monotherapy. Although the increase was also significant in coadministration, there was no statistically significant differ- ence between monotherapy and coadministration (Table 2). The amounts of excreted sodium, chloride and urea were greater in diuretic than in baseline phases. However, no significant differ- ence between monotherapy and coadministration was apparent (Table 2). The same results were observed for urine volumes and excreted amounts of electrolytes and urea.
Pharmacokinetics of furosemide
The pharmacokinetic parameters of monotherapy and coad- ministration (in parentheses) were 86.7 ± 49.1 (87.8 ± 37.9) µg/
ml per hour for AUC24, 39.2 ± 18.4 (35.3 ± 13.9) ml/min for plasma clearance, 2.47 ± 0.64 (3.01 ± 0.60) h for the half-life and 5.93 ± 3.87 (6.50 ± 4.88) % for the excreted furosemide fraction.
Coadministration thus had no significant effects on furosemide
Parameters of
24 h Urine Monotherapy (baseline) Coadministration (baseline) Volume (ml) 2094 ± 810* (1643 ± 529) 2164 ± 701* (1595 ± 509) Sodium (mEq) 149.4 ± 59.5* (89.6 ± 28.2) 151.7 ± 60.8* (75.8 ± 39.9) Chloride (mEq) 154.6 ± 66.5* (87.2 ± 41.1) 142.8 ± 61.2* (64.6 ± 35.3) Creatinine (mg) 850.7 ± 288.5 (910.5 ± 311.8) 821.3 ± 258.9 (856.7 ± 233.5) Table 2. Cumulative 24 h urine volume, sodium, chloride and creatinine excretions in patients with ESRD after furosemide monotherapy and coadministration of furosemide and hydrochlorothiazide (Means ± S.D.)
*: p < 0.05 when compared with baseline (E0). None of the parameters showed difference between monotherapy and coadministration.
Thiazide and Furosemide in ESRD
TCP
Transl Clin Pharmacol
Wooseong Huh, et al.
pharmacokinetics.
Pharmacodynamic Modeling
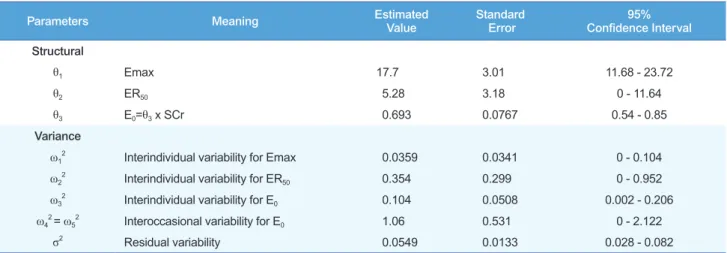
Using the Emax model, the influence of hydrochlorothiazide coadministration was assessed for Emax and ER50. No contrib- utable covariates were found (Table 3). Final estimated fixed effect parameters; their inter-individual variations and residual errors are shown in Table 4. The standard error of ER50 estimat- ed with $COV was very large (90% C.I. included 0). We guess this negative 90% C.I. may be simply because of the large varia- tion in the ER50 estimates, which cannot be negative. Some of the standard errors of the estimated θ or ω were very large. The baseline FeNa observed was positively correlated with serum creatinine concentrations and this is known to result through the compensation of the remaining nephrons. To consider the daily fluctuation of baseline FeNa, the term IOV (inter-occa-
sional variability) was also added. Neither counter-clockwise nor clockwise hysteresis was found. We also screened the rela- tion between Emax and ER50 with the $OMEGA BLOCK op- tion in the NONMEM control file, but it did not improve the scatter plot or MVO. No covariates significantly influencing Emax or ER50 were found.
Discussion
Study Design
This study was performed to explore the effect of thiazide diuretics on furosemide therapy in patients with ESRD (creati- nine clearance < 10 ml/min/1.73 m2). A beneficial effect of such coadministration in patients undergoing hemodialysis has been proposed.[10] However, with the rapid hemodynamic changes occurring during dialysis, it is not easy to obtain reliable data
Model Structure MVO p-Value Explanation
1. Slope = θ1, Intercept = θ2
E = Slope × FuER + Intercept 636.566 Simple Linear model.
2. E max = θ1,ER50 = θ2 ,E0 = θ3
E max × FuER ER50 + FuER
E = + E0
560.896 p<0.01 Emax model.
Baseline value without consideration of SCr
3. E max = θ1,ER50 = θ2, E0 = θ3 × SCr
E max × FuER ER50 + FuER
E = + E0
531.174 p<0.01 Emax model.
Baseline value increase in proportion to SCr
4. E max = θ1,ER50 = θ2,γ = θ3
E0 = θ4 × SCr E max × FuERγ
ER50γ + FuER γ
E = + E0
534.489 Sigmoid Emax model.
No improvement in MVO compared with model No. 3
5. E max = θ1,ER50 = θ2, E0 = θ3 × SCr Hys = θ4 × ∑ Furosemide _Excretiont
0
E max × FuER ER50∙eHys + FuER E =
529.939 Emax model testing the existence of hysteresis if any.
No improvement in MVO compared with model No. 3
6. E max = θ1,ER50 = θ2 + Thia × θ3, E0 = θ4 × SCr
E max × FuER ER50 + FuER
E = + E0
534.415 Influence of thiazide addition on Emax of the model No. 3 No improvement in MVO compared with model No. 3
7. E max = θ1 + θ2 × Thia, ER50 = θ3, E0 = θ4 × SCr
E max × FuER ER50 + FuER
E = + E0
534.009 Influence of thiazide addition on ER50 of the model No. 3 No improvement compared with model No. 3
Table 3. Screening of effect models and its covariates for furosemide excretion rate and FeNa. The model 3 (Emax model) was found most appro- priate to explain the pharmacodynamic relationship
FuER: Excretion rate of furosemide.
TCP
Transl Clin Pharmacolin such patients. We therefore tested the effect of diuretic co- administration in patients with ESRD who had not undergone renal replacement therapy.
Furosemide has a smaller hepatic clearance fraction than other loop diuretics. This makes its diuretic effect closely correlated with renal function and last longer than other agents.[11] As Fliser et al.[10] used 50 mg torasemide, which is about three times as potent as furosemide,[12] we administered 160 mg fu- rosemide for comparability.
Synergistic mechanisms of thiazide and loop diuretics have been proposed that rebound augmentation of sodium reabsorp- tion in the distal renal tubule with the declining effects of loop diuretics might be inhibited by thiazide.[13–15] In accordance with this postulate, we administered hydrochlorothiazide in divided doses, not in a single dose, after infusion of furosemide.
Although the interval needed for the complete washout of hemodynamic effects caused by diuretics may be longer, we es- tablished it at 48 h (including a second baseline data collection period) for the safety and compliance of our patients. Baseline data obtained one day before each phase showed that this 48 h washout was appropriate, and there were no significant differ- ences in the baseline data of monotherapy or coadministration (Table 2).
Pharmacodynamic Modeling
We performed pharmacodynamic analysis to evaluate whether there was any effect of coadministered thiazide that might have
been obscured in the widely dispersed data. Because the direct action of loop diuretics and thiazide involves the renal tubule, urinary diuretic excretion rate is generally regarded as a better predictor of tubular diuretic concentration than serum concen- tration. Several methods have been proposed for the pharmaco- kinetic-pharmacodynamic modeling of loop diuretics. Recent reports have used the so-called physiological model (indirect effect model) using differential equations to describe the time–
effect relation. However, this was hard to apply to our data be- cause of the relatively small number of observations caused by long sampling intervals.
Observing raw data, we found overt counter-clockwise hyster- esis in three of the 10 patients. However, the structural model with a hysteresis term (Model No. 5 in Table 3) was not helpful in decreasing the MVO or improving the appearance of scatter plots. This seems to have been caused by the influence of the other seven patients’ data. The longer urine sampling intervals compared with those of previous studies in healthy individuals also influenced our ability to delineate the hysteresis. Although the pharmacodynamic model proposed here does not present a detailed explanation of the time course of the effect or the phar- macokinetics or pharmacodynamics of furosemide treatment, it seems worthwhile to apply mixed effect modeling methods for the in-depth investigation of pharmacodynamic interactions in patients.
We could not find any significant effect of hydrochlorothiazide added to furosemide treatment in our patients. Pharmacody-
Parameters Meaning Estimated
Value Standard
Error 95%
Confidence Interval Structural
θ1 Emax 17.7 3.01 11.68 - 23.72
θ2 ER50 5.28 3.18 0 - 11.64
θ3 E0=θ3 x SCr 0.693 0.0767 0.54 - 0.85
Variance
ω12 Interindividual variability for Emax 0.0359 0.0341 0 - 0.104
ω22 Interindividual variability for ER50 0.354 0.299 0 - 0.952
ω32 Interindividual variability for E0 0.104 0.0508 0.002 - 0.206
ω42 = ω52 Interoccasional variability for E0 1.06 0.531 0 - 2.122
σ2 Residual variability 0.0549 0.0133 0.028 - 0.082
Table 4. Fixed effect parameters, inter-individual variability and residual errors of the final model
- Final Model - E max = θ1 × eη1 ER50 = θ2 × eη2
E0 = θ3 × SCr × eη3 + IOV IOV = OC1 × η4 + OC2 × η5
E max × FuER ER50 + FuER
E = + E0
Observed _FeNa = E(1+ε)
Emax: Maximum FeNa by furosemide excretion rate, ER50: Furosemide excretion rate producing 50% of Emax, E0: Baseline FeNa, E: FeNa predicted by Emax model, IOV: Interoccasional variance, OC1 or OC2: Occasion with or without hydrochlorothiazide, alternates between 1 and 0. FuER: Excretion rate of furose- mide, Observed_FeNa: Raw data of FeNa measured in the present study, η1: Interindividual difference of Emax, assumed mean value 0 with standard error ω1, η2: Interindividual difference of ER50, assumed mean value 0 with standard error ω2, η3: Interindividual difference of E0, assumed mean value 0 with standard error ω3, η4, η5: Interindividual difference of IOV, assumed mean values 0 with standard errors ω4 and ω5 re- spectively. ε: Residual variability of E, assumed mean value 0 with standard error σ
Thiazide and Furosemide in ESRD
TCP
Transl Clin Pharmacol
Wooseong Huh, et al.
namic analysis using a mixed effect model also failed to detect any influence of hydrochlorothiazide. Although the effective- ness of diuretic combination therapy in patients with chronic renal insufficiency has been reported by some authors,[10,16]
only four of the 10 subjects in Fliser’s report[10] and only three of the 19 subjects in Knauf ’s report[16] were patients with ESRD. Neither of the two reports mentioned the degree of pro- teinuria in their subjects. In contrast to these reports, all of the ESRD subjects enrolled in the present study had a creatinine clearance less than 10 ml/min/1.73 m2 and showed significant proteinuria (1152–7425 mg/day). We suggest that the decreased number of functioning nephrons in patients with ESRD and the lower unbound concentration of diuretics in the renal tubule caused by massive proteinuria have resulted in such a lack of ef- ficacy of diuretic combination therapy.
Acknowledgements
The authors have nothing to declare.
Conflict of interest
The authors have nothing to declare.
References
1. Harnett JD, Foley RN, Kent GM, Barre PE, Murray D, Parfrey PS. Conges- tive heart failure in dialysis patients: prevalence, incidence, prognosis and risk factors. Kidney Int 1995;47:884-890.
2. Hörl MP, Hörl WH. Hemodialysis-associated hypertension: pathophysiolo- gy and therapy. Am J Kidney Dis 2002;39:227-244.
3. Ritz E, Fliser D, Nowicki M, Stein G. Treatment of high doses of loop diuret-
ics in chronic renal failure. Nephrol Dial Traspl 1994;9 Suppl 3:S40-S43.
4. Loon NR, Wilcox CS, Unwin RJ. Mechanism of impaired natriuretic re- sponse to furosemide during prolonged therapy. Kidney Int 1989;36:682- 689.
5. Brater DC. Pharmacology of diuretics. Am J Med Sci 2000;319:38-50.
6. Benet LZ, Smith DE, Lin ET, Vincenti F, Gambertoglio JG. Furosemide as- says and disposition in healthy volunteers and renal transplant patients.
Fed Proc 1983;42:1695-1698.
7. Shumaker RC. PKCALC: a BASIC interactive computer program for statis- tical and pharmacokinetic analysis of data. Drug Metab Rev 1986;17:331- 348.
8. Boeckmann AJ, Sheiner LB, Beal SL. NONMEM Users guide. San Fran- cisco: University of California, USA 1992.
9. Hammarlund MM, Odlind B, Paalzow LK. Acute tolerance to furosemide diuretics in humans. Pharmacokinetic-pharmacodynamic modeling. J Pharmacol Exp Ther 1985;233:447-453.
10. Fliser D, Schröter M, Neubeck M, Ritz E. Coadministration of thiazides increase the efficacy of diuretics even in patients with advanced renal failure. Kidney Int 1994;46:482-488.
11. Suki WN. Use of diuretics in chronic renal failure. Kidney Int 1997;51 Sup- pl 59:S33-S35.
12. Brater DC. Clinical pharmacology of loop diuretics. Drugs 1991;41 Suppl 3:S14-S22.
13. Ellison DH. The physiological basis of diuretics synergism: its role in treat- ing diuretics resistance. Ann Intern Med 1991;114:886-894.
14. Wilcox CS, Mitch WE, Kelly RA, Skorecki K, Meyer TW, Friedman PA, et al. Response of the kidney to furosemide I: Effects of salt intake and renal compensation. J Lab Clin Med 1983;102:450-458.
15. Sigurd B, Olesen KH, Wennevold A. The supra-additive natriuretic effect addition of bendroflumethiazide and bumetanide in congestive heart fail- ure. Am Heart J 1975;89:163-170.
16. Knauf H, Mutschler E. Diuretic effectiveness of hydrochlorothiazide and furosemide alone and in combination in chronic renal failure. J Cardiovasc Pharmacol 1995;26:394-400.