2004, Vol. 48, No. 4
Printed in the Republic of Korea
시간 분해능 전자회절 분광법을 이용한 CClF3분자의 평형 구조 연구
Seong S. Seo* and John D. Ewbank†
Department of Natural Science, Albany State University, Albany, GA 31705, USA
†Department of Chemistry and Biochemistry, University of Arkansas, Fayetteville, AR 72701, USA (2004. 4. 21 접수)
Equilibrium Structure for CClF
3Using Real-Time and Time-Resolved Gas Electron Diffraction
Seong S. Seo* and John D. Ewbank†
Department of Natural Science, Albany State University, Albany, GA 31705, USA
†Department of Chemistry and Biochemistry, University of Arkansas, Fayetteville, AR 72701, USA (Received April 21, 2004)
요 약. 피코초 시간분해능 전자 회절 분광법(TRED)을 이용하여 CClF3분자의 평형 구조를 연구하였다. 이 분광법
의 분해능은 전자파의 선폭에 의하여 결정된다. 본 연구 방법에 의하여 결정된 CClF3분자의 결합 길이들을 고전적인
실시간 전자회절 분광법(GED/RT)에 의하여 보고된 결과들과 비교하였다. GED/RT 방법에 의하여 결정된 C-F 결합 길 이와 C-Cl 결합 길이는 각각 132.00(2) pm, 175.20(3) pm이고, TRED 방법에 의하여 결정된 C-F, C-Cl 결합 길이 는 각각 132.23(13) pm, 177.23(19) pm 로써 이 두 실험 방법에 의하여 결정된 분자 결합 길이는 좋은 일치성을 보 여준다.
주제어: 분자 구조, 시간분해능 전자회절 분광법, 기체 전자회절 분광법
ABSTRACT. The simplified cumulant method was applied to diffraction data of CClF3 to study the equilibrium molec- ular parameters over a range of temperatures. The molecular parameters of CClF3 by the simplified cumulant method were compared with those from the traditional method. Also the instrumentation of picosecond time resolved electron diffraction (TRED) and the experimental details are described. The total experimental temporal resolution was discussed in terms of the electron pulse width. The TRED system was applied to study the molecular structures for CClF3 at room temperature.
The molecular structural parameters CClF3 from TRED are compared with those from GED/RT. The molecular parameters (re)of bonded C-F and C-Cl for CClF3 by simplified CA are 132.00(2) pm and 175.20(3) pm, respectively, by using GED/
RT. From the results of TRED experiments ra for bonded C-F and C-Cl are 132.23(13) pm and 177.23(19) pm.
Keywords: Molecular Structure, Time-Resolved Electron Diffraction, Gas Electron Diffraction
INTRODUCTION
A real time gas electron diffraction (GED/RT)1,2 instrument was constructed with a multichannel photodiode array (PDA) detector, and is thus an online technique. GED/RT has been applied to dis- criminate among various molecular force fields as derived from high-resolution spectroscopy. In con-
junction with cumulant analysis,3-5 the method determines not only the vibrational average struc- tures, but also the equilibrium molecular geome- tries. The method applies to both equilibrium and non-equilibrium molecular ensembles. A simplified- CA (cumulant analysis) procedure6 was developed recently to allow for data refinements without the need for extraneous information from spectroscopy.
To capture the dynamics of structures in transi- tion states, ultrafast time resolution must be intro- duced to the diffraction. Previously, it was possible to probe such changes with femtosecond and pico- second spectroscopy to reveal the elementary nuclear motion.7 The use of an ultrafast laser beams at the scattering center of GED/RT in order to photoex- cite the molecules, and at the photocathode to make ultrashort electron pulses, provides a similar pump- and-probe process.
The first time resolved electron diffraction (TRED) system was used to study the structure of radical products formed in the IR multi-photon dissocia- tion of CF3I in the microsecond time domain.8 The temporal resolution was further improved to nano- seconds (ns) by combining a laser initiated electron source with a linear diode array detector to study the 193 nm photodissociation of CS2 in the time interval from 20-120 ns after excitation.9 Recently, a TRED system has been reported to observe the UV-dissociation of CF3I with picosecond (ps) time resolution.7 Also, the photodissociations of Fe (CO)5 and CF2I2 were studied with picosecond time resolution10, but a clear result has not yet been attained. In recent years a number of other dynamic methods such as Time of Flight (TOF) mass spec- troscopy and Femtosecond Transition-state Spec- troscopy (FTS), have probed chemical reactivity in attempts to ascertain critical reactive intermediates and kinetic pathways.7
On the theoretical side, time-dependent equa- tions for diffraction intensities have been derived for non equilibrium vibrational distributions for the case of photodissociated CS211 and for the photoin- duced coherent intramolecular dynamics of disso- ciative and predissociative transient states of ICN, IBr and NaI.11 Also a new approach was developed to measure directly the quantum state of a molecu- lar ensemble.12 Only very recently TRED has become available as a new and complementary source of “structural kinetic” information for excited state species. In addition, the simplified-CA method was applied to the diffraction data of CClF3. The TRED system was used to determine molecular structures for CClF3. The molecular
structural parameters CClF3 from TRED are com- pared with those from GED/RT.
Theoretical Procedures
There exist alternative methods for calculating Imol(s) by making the vibrational and rotational averages, < exp[ i s(ri - rj)]>.13 Displacements of the nuclear positions with respect to their equilibrium positions are expanded in terms of the normal coor- dinates and vibrational averages taken; then, the average over random orientations of the molecule is obtained. One can get reduced molecular intensi- ties with cumulant average and the vibrational probability density function as follows 14
sM(s) = ΣΣi≠j=1,Ngij(s) exp [Qij(s)]/re,ij{Aij(s) sin [s(re,ij + Pij(s))] + Bij(s) cos [s(re,ij + Pij(s))]} (1) where (omitting the subscripts ij for simplicity)
Q(s) = - s2 < ∆r2 >c / 2 + s4 < ∆r4 >c / 24 P(s) = < ∆r > - s2 < ∆r3 >c / 6
A(s) = 1- [< ∆r > - s2 < ∆r3 >c / 2] / re + … B(s) = [- s < ∆r2 >c + s3 < ∆r4 >c / 6] / re +…
Equation (1) provides a basis for least-squares model refinement from GED data. One can adjust the equilibrium internuclear distances re and cumu- lants < ∆rn >c with n = 1~4. The latter can be assigned a clear meaning in terms of properties determining the vibrational probability density function: < r > = re + < ∆r > is the mean position,
< ∆r2 >c = lg2 is the dispersion, < ∆r3 >c is the skew, and < ∆r4 >c is the excess, respectively, of the prob- ability density.
It is useful to consider the dimensionless cumu- lant coefficients, gn, which are defined 15 by
γn = < ∆rn >c / < ∆r2 >cn/2 n = 1, 3, 4, … (2) The gn values are sensitive functions of the molecular force field and vibrational distribution.
By inserting Eq. (2) into Eq. (1) one obtains sM(s) = ΣΣi≠j=1,Ngij(s) exp [Qij(s)]/re,ij{Aij(s) sin [s(re,ij + Pij(s))] + Bij(s) cos [s(re,ij + Pij(s))]} (3)
where,
Qij(s) = - s2 < ∆r2 >c / 2 + s4 g4 < ∆r2 >c2 / 24
3
Pij(s) = g1< ∆r2 >c1/2 - s2 g3< ∆r2 >c3/2 / 6
Aij(s) = 1- [g1< ∆r2 >c1/2 - s2 g3< ∆r2 >c3/2 / 2] / re + … Bij(s) = [- s < ∆r2 >c + s3 g4< ∆r2 >c2 / 6] / re +…
To summarize, the cumulant method establishes a general relationship between diffraction intensity and cumulant averages defined with regard to the Pij (r) or Pij(r)/r functions. This relationship is accurate to any desired degree of approximation. The CA equation is based on geometrically consistent re parameters and is valid for non-equilibrium sys- tems without extraneous information on harmonic and anharmonic potential constants. The traditional intensity equation is based on ra geometries which are geometrically inconsistent. The molecular parameters obtained by cumulant analysis are more precise than those obtained by the traditional method. Further, the method may be applied to check the validity of anharmonic force fields derived from various spectroscopic investigations.
The simplified version of the CA of GED intensi- ties was developed some time ago. In actual refine- ments of re and γn from GED data, extensive parameter correlations were found.15 Therefore, some approx- imate constraints between the cumulant coefficients are needed to apply Eq. (3) to GED data analyses without auxiliary spectroscopic calculations.
The least square refinements of molecular inten- sities can be performed on the basis of Eq. (3) with the approximate constraints. This is the scheme known as simplified CA. This simplified CA retains the conceptual consistency of full CA but allows for GED data refinements without the need for extraneous information or additional computa- tional analysis. The simplified CA procedure can be applied to molecular ensembles at high tempera- tures and to excited systems. However, the omis- sion of information on vibrational populations and potential constants in the simplified CA procedure is expected somewhat to diminish the accuracy in comparison to the full formalism.
In order to derive theoretical intensity expres- sions for non-equilibrium systems, one may use the theory afforded by cumulant expansions of the dif- fraction intensities. This level can be applied in studies of intramolecular vibrational redistribution
processes at low levels of vibrational excitation, when the normal mode description of the molecu- lar vibrations is still adequate. The processes of relating the harmonic and anharmonic force con- stants to electron diffraction intensities and spectro- scopic constants are quite involved. First of all, the renormalized frequencies are calculated at the appropriate temperatures. Then, curvilinear internal coordinates are transformed to normal coordinates by a nonlinear transformatiom. Next the moments are calculated in terms of the potential function in normal coordinate space. Then the cumulants are calculated in internal coordinates and the molecular intensity function is obtained. The refinements are carried out with a Hooke and Jeeves computer algo- rithm.16
Instrumentation and Experimental Procedures of GED/RT and TRED
A) Instrumentation and Procedures for GED/RT The GED/RT system has been described else- where.1,2,17,18 There are three chambers (diffraction, electron and detector) with molecular inlet system and temperature controller. The diffraction and electron chambers are separated from each other and pumped independently. The electron chamber provides a stable high vacuum region for the colli- mation and positioning of the electron beam. The collimated electron beam interacts with the molecu- lar beam in the diffraction chamber. A PDA is used for on line detection of the diffraction pattern on a fluorescent screen in the detector chamber.
The electron beam with well-defined wavelength is produced in an electron gun with a hot cathode filament of tungsten. The electrons are emitted ther- mally and are drawn and accelerated by the poten- tial of the anode. The accelerated electrons leave the electron gun through a central hole in the anode.
The electron beam is focused onto the registration plane by a magnetic lens.
Most groups still use densitometers which are single channel measuring devices to analyze the electron diffraction data. The method has proven to be successful but the stepping procedure is some-
what time consuming and, like all mechanical pro- cesses, it involves inevitable positioning uncertainties.
Therefore, a position sensitive multichannel ana- lyzer (PDA) is applied for analyses of the full dif- fraction pattern in one measurement. The PDA provides precise spatial resolution and offers high sensitivity and a large dynamic range. In the GED/
RT instrument, a focused electron beam is crossed by a molecular jet, and the diffraction pattern is dis- played on a fluorescent screen. The screen is opti- cally coupled to a photodiode array which records the intensity distribution on-line, in a multichannel mode, and without the intervention of the rotating mechanical sector needed in photographic GED.
The diffracted electrons are transformed into pho- tons by the aluminized P20-type phosphor. The PDA is aligned on the opening of the butterfly slit.
The PDA consists of a set of 1024 independent sil- icon photodiodes of pixel size 25µm by 2.5 mm.
The intensity distribution of the diffraction pattern with s range (50~280 nm-1) is obtained and stored in digital form for immediate analysis. The real- time procedure allows for direct comparison of the scattered electron distributions from different sub- stances.
Exposure time is usually 6 seconds at a PDA temperature of -30oC. Row data output can be viewed immediately on an oscilloscope, or more highly processed data can be displayed on the com- puter system monitor. Experimental variables such as the conditions of electron beam and scan state are maintained as constant as possible, and only the sample gas under study is changed. Gold thin film is used for alignment and focusing of the GED /RT system and N2 is used for calibration purposes. For these studies a sample of CClF3 (99.0%) was obtained from Aldrich and the purity checked with FT-IR.
CF3Cl were studied under consistent experimen- tal conditions at various temperatures. Instrumental variables such as electron accelerating voltage, scat- tering distance, sample temperature, detector tem- perature, and scan state were maintained as nearly constant as possible, and only the sample under study was changed. Argon gas yields a smooth
intensity profile which is used to correct for slit unevenness, for nonuniformity of response of indi- vidual diode channels, and for other constant instru- mental imperfections. N2 gas is used for calibration of the electron diffraction instrument.
For an ideal GED apparatus, the total experimen- tal scattered intensity of a molecule IEtot (s) is repre- sented as the sum of an atomic background, Ieat (s) and a contribution IEmol (s) from its internuclear dis- tances. JEat (s), the experimental intensity of argon, consists only of the featureless background type scattering. For two substances I and J, one defines the experimental ratio of their scattered intensities to be 19
REIJ = (IEtot - D) / (JEtot - D) (1)
where D is the detector dark current or PDA sig- nal when no sample gas is entering the diffraction chamber, but the main electron beam is present.
The theoretical ratio is RTIJ = ITtot / JTtot where I Ttot = ITat + ITmol + ITtria, and the symbols have their usual meanings. ITat is the atomic scattering, ITmol is the molecular interference, and ITtria is the triatomic con- tribu-tion. One method of extracting the experimen- tal molecular information is to apply the inverse atomic background ratio, BTJI = JTat / ITat to the experimental data. In case the theoretical function J is monatomic, one obtains BTJI RTIJ = 1 + MTI(s) + TTI(s) where MTI(s) is the leveled molecular inten- sity. Similarly, when the theoretical inverse back- ground ratio is applied to the experimental data, then
BTJI REIJ = K(s) + R [MEI(s)] (2)
where K(s) is a smooth function of the scattering variable s and R is an amplitude scaling constant which may be identified with the index of resolu- tion. The K(s) and R values are determined that best fit the reduced experimental data to the current the- oretical model. Eq. (2) is equivalent with the con- ventional M(s) curve of GED suited for structural analysis. Least-squares analyses are performed on the sM(s) functions of both the traditional and CA
3
methods until a self-consistent view of the experi- mental intensities and their theoretical counterparts are obtained. The molecular parameters (ra, λa) for the traditional method and the molecular parame- ters (re, λe, γ1, γ3 and γ4) for CA are obtained over the temperature range from 298K to 673K. As a parameter of accuracy of theoretical fit to the exper- imental GED data one uses a reduced reproducibil- ity factor Rf defined as an integral standard deviation over the whole s-range between experi- mental and theoretical sM(s). The radial distribu- tion (RD) curve shows maxima of radial probability which correspond to the internuclear distances.
B) Experimental Apparatus for TRED
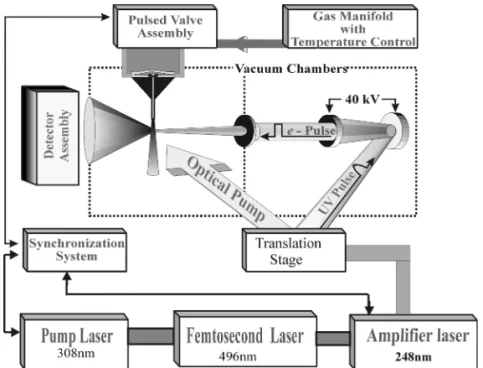
The TRED apparatus is shown schematically in Fig. 1 for picosecond TRED. In Fig. 1 the optical pump laser pulses are directed to the diffraction chamber to excite the molecular sample. The probe laser pulses enter the electron chamber to generate picosecond electron pulses. The time delay between the pump and the electron pulses is controlled by a translation stage. The diffraction patterns are recorded with the electronic detection system. The following sections describe the individual compo-
nents of picosecond TRED.
B. 1) Femtosecond Laser System
The laser system is divided into excimer pump laser, femtosecond laser20, and excimer amplifier.
The excimer pump laser (LEXTRA 100, Lambda Physik) is filled with premix XeCl (80mJ, 15ns pulses at 308 nm). The pump energy is distributed among the various dye cells of the femtosecond laser by quartz plates. The energy of the femtosec- ond system (Lambda Physik, FAMP/LEXtra) including amplified spontaneous emission (ASE) after the second amplifier was 250µJ at 496 nm with 500fs pulse duration. The second harmonic generation in a BBO crystal provided the energy of 10-12µJ at 248 nm, as measured by a Molectron J4 joulemeter. Also, the wavelength was measured with an Acton Research Corporation, SpectroPro- 300I spectrometer.
The amplification of femtosecond pulses was accomplished by a slightly modified excimer laser (Questek). This laser was originally an oscillator with a 20 ns pulse of 100 mJ at 248 nm. The oscil- lator was converted to an amplifier by replacing the rear resonator mirror with a window. The amplifier
Fig. 1. The Schematic Diagram of the Picosecond TRED.
was filled with a mixture of 150 mbar F2, 150mbar Kr and remainder He to give a total pressure of 2700 mbar. After the first pass, the beam was fil- tered by a pinhole as shown in Fig. 2, and then sent through the amplifier a second time. By this dou- ble-pass amplification scheme, the pulse energy at 248 nm, 500fs was boosted to 3.5 mJ with no more than 7% amplified spontaneous emission (ASE).
B. 2) Electron Beam
The electron gun consists of two electrodes, a magnetic lens and diaphragms as shown in Fig. 3.
The cathode is a circular tantalum (Ta) disk within a pierce-type electron gun.21 The emitted electrons are accelerated through a potential of 40 keV. The picosecond electron pulses are reduced to a width of less then 2 mm at the intersection with the molecular beam. The ultrafast electron pulses travel to the dif- fraction center over a distance of about 50 cm.
The total temporal resolution (tTOT) of an ultrafast electron pulse depends on the duration of the initial energy spread of the photoelectrons (∆tTD), the cou- lombic dispersion of the electron pulse (∆tQT) due to local space charge (LSC) during its time of flight,
the duration of the laser pulse (∆tLP), and a geome- try factor (∆tGF), as shown in Fig. 3. Therefore
(∆tTOT)2 = (∆tGF)2 + (∆tTD)2 + (∆tQT)2 + (∆tLP)2 The geometric effect (∆3ps) on the duration of the picosecond electron pulse is calculated by (w/
c)tan(αp), where w = 2 mm is the diameter of the laser beam at the photocathode, αp = 40o is the illu- mination angle for the laser beam, and c is the speed of light. The broadening of the pulse due to the initial energy spread is ~0.5ps. When electrons are ejected, the electron pulses traveled to the detec- tor with collimation and focusing. After the moment of generation, electron-electron coulombic repulsion causes additional temporal broadening (∆tQT). We estimate this space-charge temporal broadening is ~4-15 ps. The last term (∆tLP) corre- sponds to the temporal duration of the laser pulse which creates the photoelectrons. As mentioned earlier, ∆tLP~0.5ps. Thus the overall electron pulse duration is in the range ∆tTOT = ~8-19ps.
B. 3) Pulsed Inlet System
TRED consists of two vacuum chambers. The electron chamber is maintained at a vacuum of 10 -6 torr and the diffraction chamber at 10-4-10-6 torr.
The vacuum is maintained by two diffusion pumps (Edwards Models 160 and 63 Diffstaks) backed by two mechanical pumps (Edwards Model E2M40 and Varian SD 300, respectively).
We have used a modified commercial (Jordan)
Fig. 3. The Schematic Diagram of the Electron Chamber and the Temporal Broadening Factors in the Formation of Picosecond Electron Pulses.
Fig. 2. Experimental Arrangement for Amplification of Femtosecond Laser Pulses.
3
supersonic molecular beam pulsed valve (PV) inlet to maximize the scattering intensities for picosec- ond TRED. The PV consists of a hairpin loop of highly conductive metal22 and is clamped on both ends with a hole in the bottom plate. A Viton O- ring is placed at the inside of the hole, and sealed by the upper plate. The magnetic repulsion generated by the opposing currents pushes the flexible upper plate away from the O-ring seal and allows gas to flow through the O-ring. The general pulse dura- tion determined by the mechanical response of the upper plate is 30 to 100 ms depending on the pres- sure and drive current. The maximum repetition rate is 12Hz. The PV can operate at a maximum 10 atm pressure and about 100oC. The output orifice (d
= 0.5 mm) of the free jet is extended with a cylin- drical channel formed by a stainless hypodermic needle of length 25 mm and inside diameter 0.5 mm to achieve higher molecular densities in the scattering region.
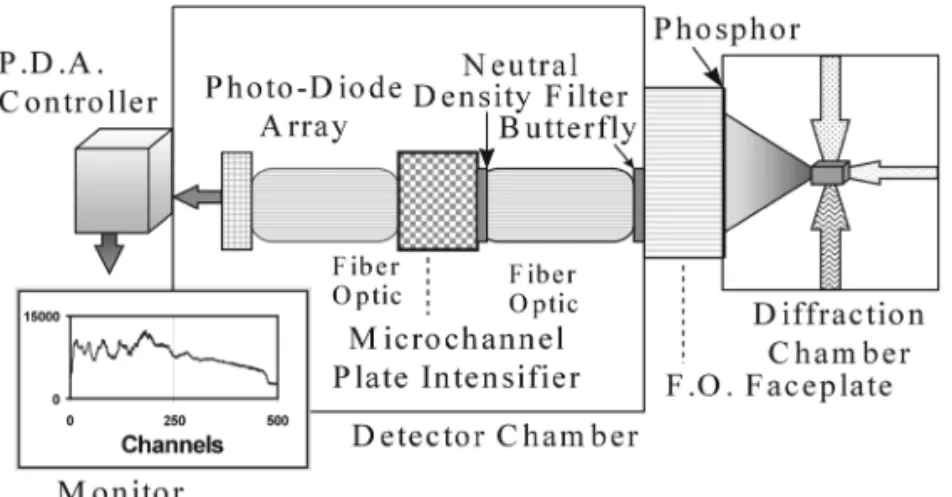
B. 4) Data Acquisition System
The schematic diagram of the data acquisition system23 is shown in Fig. 4. The diffraction pat- terns are recorded through an aluminized P-20 phosphor screen coated onto the surface of a vac- uum tight fiberoptics faceplate. The phosphor screen is mounted on a standard 10-inch stainless steel flange that provides enough room to place a trap for the main electron beam. The butterfly is used to avoid the over saturation of the signal at small scat-
tering angles and to compensate for signal fall off at larger angles. Furthermore, a linear neutral density filter was designed on the opposite end of the fiber optic coupler. The intensity angular range was nearly equalized with the EF but the signals were still weak for the picosecond experiment. Two fiber optic couplers (Schott) were used for the data acquisition system. The fiber optic couplers consist of a core glass (n = 1.6) and an outside tube of clad- ding glass which has a lower index of refraction (n
= 1.4). Integration over a longer exposure time was previously used to compensate for weak signals but the dark noise became unacceptably large. The use of a microchannel plate (MCP) intensifier (ITL Ltd, MCP-140) has provided good results with shorter exposure times. A microchannel plate (MCP) is an array of 104-107 miniature electron multipliers ori- ented parallel to one another; typical channel diam- eters are in the range 10-100µm. Channel multipliers typically operate at gains of 103-105. The photo- diode array (PDA) (RY-2048 diode array, Prince- ton Instruments) detector consists of 2048 side-by- side elements having pixel dimensions of 25µm x 2.5 mm. All the diodes in the array are read out after a single integration period and the spectral data stored in the computer memory for display.
The CSMA (Princeton Instruments) is a complete control and data collection system. The cooling of the system is essential to reduce the dark current of the PDA. After the system is turned on, it usually takes about two hours for the thermoelectrically
Fig. 4. Schematic Diagram of the Detector System for TRED.
cooled detector to reach its preset temperature of - 37oC.
The electron beam is first visualized on the phos- phor screen for alignment and focusing, and then placed inside the trap. After the initial alignment, the detector system is butted up against the phos- phor screen, and then fine-tuned for the maximum diffraction signals. To align the PV, first the needle is placed on the center of the electron beam, then moved up. The laser pulses are first placed on the PV needle then moved slightly below to complete the intersection of electron pulses, molecular pulses and laser pulses.
RESULTS AND DISCUSSIONS
A) Investigation of Chlorotrifluoromethane (CClF3) by GED/RT
A method for direct evaluation of equilibrium molecular geometries from GED/RT intensities was reported previously.23,24 Based on a cumulant expansion for the molecular diffraction intensities, the method was applied to determine the equilib- rium structures of sulfur hexafluoride SF623 and selenium hexafluoride.24 However, information on harmonic and anharmonic potential constants is required for the full cumulant analysis. The simpli- fied CA as reported for SF625 allows for data refine- ments without the need for such extraneous information. The molecular parameters [re, λa, and γ3, γ4] were refined over a wide temperature range.
The application of the new intensity expression to CClF3 is important because it avoids the geometri- cally inconsistent ra scheme of the traditional method commonly used in GED investigations.
The simplified CA can be applied to equilibrium ensembles at elevated temperatures due to thermal heating or optical pumping, where the traditional method is inoperable.
The results of GED/RT investigations for CClF3 comparing the simplified CA and traditional meth- ods are presented. N2 (99.998 %) was used as an internal standard for calibration of the GED/RT instrument. The mean equilibrium N≡N distance as determined from the calibration intensity data by
excess CA is re = 109.74(1) pm. The calculated temperature-dependent distances ra and rg, mean amplitudes λa, λg, and phase shift parameter k agree well with the result of previous work 24.
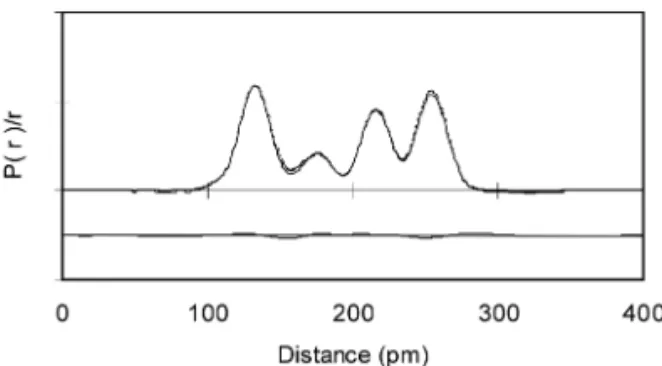
The molecule CClF3 displays a well resolved dis- tribution of internuclear distances. This molecule has been the subject of three prior photographic electron diffraction studies26,27. The simplified CA analysis was applied to GED intensities of CClF3 without spectroscopic information over the temper- ature range from 298K to 673K. The experimental and theoretical intensity curves for CClF3 are com- pared in Fig. 5. The radial distribution curves are shown in Fig. 6. The molecular parameters at vari- ous temperatures of CClF3 by simplified CA are presented in Tables 1~3.
The positions, rRD, of the maximum of the radial distribution peaks (rRD = 1.328 ± 0.002Å for C-F, 1.751±0.004 Å for C-Cl, and ∠ FCF = 108.6 ± 0.4o) were reported by Bartell in 1955. The thermal average distances ra=1.3257(14) Å for C-F, 1.7489 (39) Å for C-Cl, and ∠ FCF = 108.6 ± 0.2o were
Fig. 5. Theoretical and Experimental Intensity Curves of CCIF3 at 298K.
Fig. 6. Theoretical and Experimental RD Curves of CCIF 3 at 298K.
3
presented by Oberhamer in 1978. The microwave study of CClF3 was reported in 1952 28 where the values of dCF = 1.328 ± 0.005Å and dCCl = 1.740 ± 0.0018Å were presented. The stretching and bend- ing anharmonicity of CClF3 was studied by Bartell
29, but only the thermal average distances (ra) at room temperature and bond asymmetry parameters were reported.
The molecular parameters of bonded C-F and C- Cl for CClF3 by simplified CA are shown in Tables
1~5; the mean equilibrium distances are re = 132.00 (2) pm and 175.20(3) pm, respectively. As expected, re is essentially independent of temperature as shown in Figures 7~8. As shown in Table 4 the temperature dependent mean distance is ra = 132.64 (2) pm for C-F and ra = 176.08(6) pm for C-Cl obtained at the room temperature by the traditional method. Also the temperature dependent vibra- tional amplitudes from the simplified CA are com- pared with those from the traditional method. The temperature dependent vibrational amplitudes λa of C-F, C-Cl, F…Cl, and F…F also increased and increases of the F…Cl amplitudes much larger than the others. The angles of Cl-C-F are 110.3 ± 0.2o and 110.0 ± 0.1o by the simplified CA and the tradi- tional methods, respectively. Also, the increases of g3 and the decreases of g4 for both nonbonded F…F and Cl…F are much larger than for bonded C - F.
The data analyses of this study offer the opportu- nity to directly compare the results obtained by the traditional method and simplified CA. In the tradi- tional method, κ asymmetry values are often assumed to be zero which leads to systematic shifts of the ra distances. In view of this consideration and the results of this thesis, we expect that simplified Fig. 7. The Comparison of re(●) and ra(◆) of C-F for CCIF3 Versus Temperatue.
Fig. 8. The Comparison of re (●) and ra (◆) for C-Cl of CCIF3 Versus Temperature.
Table 1. The Equilibrium Molecular Parameters for C-F of CClF3 by Simplified CA
T/K re λa γ3 γ4 Rf (%)
298 132.00 (2) 4.42 (1) 0.14448 -0.11634 4.6 373 132.01 (2) 4.43 (1) 0.14575 -0.11826 4.3 473 131.98 (2) 4.48 (1) 0.14670 -0.11970 4.7 573 132.02 (3) 4.65 (2) 0.15335 -0.12997 5.6 673 132.01 (3) 4.76 (2) 0.15777 -0.13699 6.4 The values of the parameters are given from analysis of averaged data sets at each temperature.
Uncertainties in parentheses for re (pm) and λe (pm) are 1σ.
The reproducibilities (Rf) are presented in percent.
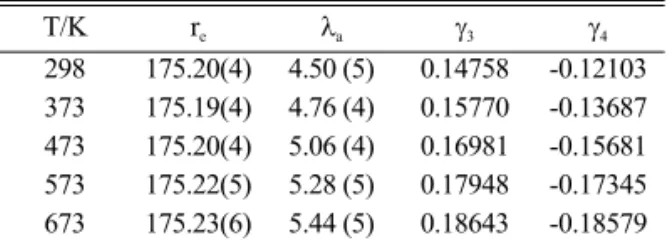
Table 2. The Equilibrium Molecular Parameters of C-Cl for CClF3 by Simplified CA
T/K re λa γ3 γ4
298 175.20(4) 4.50 (5) 0.14758 -0.12103 373 175.19(4) 4.76 (4) 0.15770 -0.13687 473 175.20(4) 5.06 (4) 0.16981 -0.15681 573 175.22(5) 5.28 (5) 0.17948 -0.17345 673 175.23(6) 5.44 (5) 0.18643 -0.18579 The values of the parameters are given from analysis of averaged data sets at each temperature.
Uncertainties in parentheses for re (pm) and λe (pm) are 1σ.
Table 3. The Equilibrium Molecular Parameters for F…F and F…Cl of CClF3 by Simplified CA
F…F F…Cl
T/K re λa re λa
298 214.38 5.4(3) 253.22 6.4(2)
373 214.34 5.5(3) 253.30 6.8(2)
473 214.31 5.8(3) 253.34 7.3(2)
573 214.46 6.1(3) 253.39 7.7(2)
673 214.42 6.4(3) 253.36 8.2(3)
The values of the parameters are given from analysis of averaged data sets at each temperature.
Uncertainties in parentheses for λe (pm) are 1σ.
CA provides a more adequate account of the GED/
RT experiments. When the simplified CA is applied directly to the GED/RT data, then the equilibrium molecular geometries are refined without informa- tion from spectroscopy. The simplified CA scheme may be applied to molecular ensembles at high temperatures and to IR-laser excited systems. Thus, we see its greatest value as establishing the much needed basis for structural kinetic studies of laser excited species by TRED. It will be interesting in the future to compare the results reported in this thesis for CClF3 with those obtained from a full cumulant (excess) analysis including spectroscopic information on the molecular force field.
B) TRED Molecular Parameters of CClF3 CClF3 were studied under similar TRED experi- mental conditions at room temperature. Each frame of data (about 500 channels) contained the com- plete intensity pattern and required about 20 sec-
onds integration time, and typically 20 to 50 frames were averaged to yield the data sets used for fur- ther processing. In a typical experiment, the data set of the molecule to be studied is recorded together with dark current (no gas present), and argon gas (atomic reference), as in GED/RT experiments.
The energy of the 500 fs laser pulses was ampli- fied about 300 times with our modified amplifier.
10% of the amplifier output was directed to the electron chamber to make picosecond electron pulses. After focusing onto the photocathode, the spot diameter is about 2 mm. The other 90% pro- vided the excitation source of molecular samples for the pump-probe experiment. The total temporal broadening (∆tTOT) of the electron pulses was esti- mated to be ~20 ps.
Measurements of the temporal behavior of the molecular beam were conducted in two different configurations of the pulsed inlet. In the case of
“free jet,” the molecular pulse length was about 80 µs with argon or SF6 gases. The measured pulse length is very close to the 110µs pulse predicted by theoretical calculations.
The amplified femtosecond laser pulses yielded stronger diffraction signals than previous experi- ments for picosecond TRED. The use of the EF allows an increase in quality of diffraction intensi- ties. The diffraction pattern from ~20 ps electron pulses was recorded by the PDA detector during exposure times of ~20 seconds. The total data acquisition time was about 7 minutes.
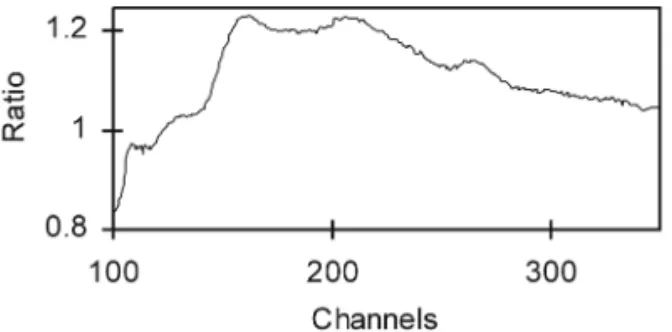
A lecture bottle of CClF3 (Aldrich, 99%) was connected directly to the sample inlet of the pulsed valve of TRED to get the molecular structural parameters at room temperature. The ground state picosecond TRED patterns were recorded with 4000 electron pulses. The experimental ratio curve without any smoothing is presented in Fig. 9. The molecular intensity sM(s) and radial distribution curves are shown in Fig. 10 and 11, respectively.
The structural parameters for CClF3 with GED/RT and TRED are compared in Tables 6 and 7.
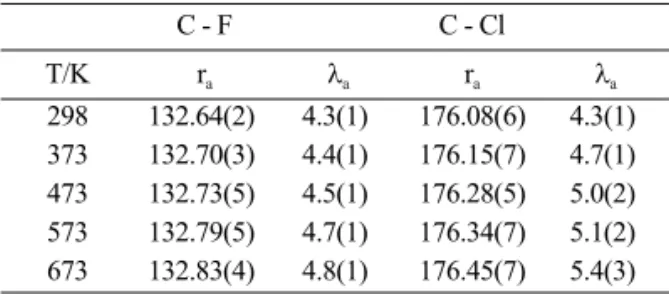
From our GED/RT, ra for bonded C-F, C-Cl are 132.64(2) pm and 176.08 (6) pm, ra for nonbonded F…F, F…Cl are 215.89(4) pm and 254.20(4) pm, Table 4. The Thermal Averaged Molecular Parameters for C-
F and C-Cl of CClF3 by Traditional Method
C - F C - Cl
T/K ra λa ra λa
298 132.64(2) 4.3(1) 176.08(6) 4.3(1) 373 132.70(3) 4.4(1) 176.15(7) 4.7(1) 473 132.73(5) 4.5(1) 176.28(5) 5.0(2) 573 132.79(5) 4.7(1) 176.34(7) 5.1(2) 673 132.83(4) 4.8(1) 176.45(7) 5.4(3) The values of the parameters are given from analysis of averaged data sets at each temperature.
Uncertainties in parentheses for ra (pm) and λa (pm) are 1σ.
Table 5. The Thermal Averaged Molecular Parameters of F…F and F…Cl for CClF3 by Traditional Method
F…F F…Cl
T/K ra λa ra λa
298 215.89(4) 5.4(1) 254.20(4) 6.6(1) 373 215.88(3) 5.6(1) 254.32(3) 6.9(1) 473 215.94(4) 5.8(1) 254.46(4) 7.4(1) 573 216.08(6) 6.1(1) 254.58(5) 7.9(1) 673 216.17(6) 6.5(1) 254.72(5) 8.4(1) The values of the parameters are given from analysis of averaged data sets at each temperature.
Uncertainties in parentheses for ra (pm) and λa (pm) are 1σ.
3
and the angle of ∠ClCF is 110.0 ± 0.1o by the tra- ditional method. From the results of TRED experi- ments ra for bonded C-F and C-Cl are 132.23(13) pm and 177.23(19) pm; ra for nonbonded F…F and F…Cl are 215.90(12) pm and 254.05(14) pm, and the angle ∠ClCF is 109.5 ± 0.2o. The vibrational amplitudes laof C-F and F…F are summarized in Tables 6 and 7. When we compare the picosecond TRED results with those of GED/RT, the results of TRED are very close to those of GED/RT. In the future the TRED system can be used for studying transition states and photodissociation processes
with picosecond time resolution.
CONCLUSIONS
The data analysis of CClF3has compared the results obtained by the traditional method and by simplified CA. The equilibrium molecular geome- try for CClF3 was determined directly from the GED/RT data without extraneous information from spectroscopy. When the simplified CA is applied directly to the GED/RT data, then the equilibrium molecular geometries are refined without informa- tion from spectroscopy. The simplified CA scheme can be applied to molecular ensembles at high tem- peratures and to IR-laser excited systems. Thus, we see its greatest value as establishing the much needed basis for structural kinetic studies of laser excited species by TRED. It will be interesting in the future to compare the results reported in this paper with those obtained from a full cumulant (excess) analysis including spectroscopic informa- tion on the molecular force field.
In this study, the TRED apparatus was tested and improved. The 500fs laser pulses are amplified, the total temporal broadening of the electron pulses is Fig. 10. Therotical (dot) and Experimental (solid) Intensity
Curves of CCIF3 with TRED.
Table 6. The Comparison of Molecular Parameters of C - F and C - Cl for CClF3 with GED/RT and TRED by Traditional Method at 298K
C - F C - Cl
ra λa ra λa
GED/RT 132.64(6) 4.3(3) 176.1(2) 4.3(3) TRED 132.23(40) 4.7(9) 177.2(6) 5.5(3) The values of the parameters (in pm) are given as obtained from analyses of averaged data. Uncertainties in parenthe- ses for ra and λa are 3σ.
Table 7. The Comparison of Molecular Parameters of F…F and F…Cl for CClF3 with GED/RT and TRED by Traditional Method at 298K
F…F F…Cl
ra λa ra λa
GED/RT 215.89(4) 5.4(1) 254.20(4) 6.6(1) TRED 215.90(12) 6.6(1) 254.05(14) 10.3(4) The values of the parameters (in pm) are given as obtained from analyses of averaged data. Uncertainties in parenthe- ses for ra and λa are 1σ.
Fig. 11. Theoretical (dot) and Experimental (solid) RD Curves of CCIF3 with TRED.
Fig. 9. TRED Experimental Ratio Curves of CCIF3 from 4,000 Electron pulses.
estimated to be ~20 ps, current data collection has become routine in picosecond time resolution, col- lection times have decreased, and the TRED sys- tem is applied to study the molecular structures of ground state CClF3 system in picosecond time domain.
REFERENCES
1. J. D. Ewbank, L. Schäfer, D. W. Paul, O. J. Benston, J.
C. Lennox, Rev. Sci. Instrum., 1984, 55, 1598.
2.a) J. D. Ewbank, L. Schäfer, D. W. Paul, D. L. Monts, W. L. Faust, Rev. Sci. Instrum., 1986, 57, 967, b) L.
Schäfer, J. D. Ewbank, Acta Chem. Scand., 1988, A42, 358, c) J. D. Ewbank, D. W. Paul, L. Schäfer, R. Bakh- tiar, Appl. Spectrosc., 1989, 43, 415.
3. V. P. Spiridonov, A. G. Gersikov, E. Z. Zasorin, B. S.
Butayev, Diffraction Studies on Non-Crystalline Sub- stances, I. Hargittai, W. J.Orville-Thomas, Eds., Arka- demiai Kiado: Budapest, 1981.
4. A. A. Ischenko, J. D. Ewbank, L. Schäfer, J. Phys.
Chem., 1994, 98, 4287.
5. P. Maggard, A. A. Ischenko, V. A. Lobastov, L. Schäfer, J. D. Ewbank, J. Phys. Chem., 1995, 99, 13115.
6. A. A. Ischenko, V. A. Lobastov, L. Schäfer, J. D.
Ewbank, J. Mol. Struct., 1996, 377, 261.
7. A. H. Zewail, Femtochemistry, Vols. 1 and 2, World Scientific, Singapore, Hong-Kong, 1994.
8. A. A. Ischenko, V. V. Golubkov, V. P. Spiridonov, et al., Appl. Phys., 1983, B32, 161.
9. J. D. Ewbank, W. L. Faust, J. Y. Luo, et al., Rev. Sci.
Instrum., 1992, 63, 3352.
10. a) J. Cao, H. Ihee, and A. H. Zewail, Chem. Phys.
Lett., 1997, 281, 10. b) M. Dantus, S. B. Kim, J. C.
Williamson, A. H. Zewail, J. Phys. Chem., 1994, 98, 2782. c) J. C. Williamson and A. H. Zewail, J. Phys.
Chem., 1994, 98, 2766.
11. A. A. Ischenko, L. Schäfer, and J. D. Ewbank, Time- Resolved Diffraction, Edited by J. R. Helliwell and P.
M. Rentzepis, Clarendon Press, Oxford, 1997.
12. A. A. Ischenko, L. Schäfer, and J. D. Ewbank, Tomog- raphy of theMolecular Quantum State by Time- Resolved Electron Diffraction, Proc. SPIE 1999, 3516, 90.
13. J. Karle, in I. Hargittai and W. J. Orville-Thomas, Eds., Diffraction Studies of Non-Crystalline Substances, Akademiai Kiado, Budapest, 1981.
14. A. A. Ischenko, V. P. Spiridonov, et al, J. Mol. Struct., 1988, 172, 255-273.
15. A. A. Ischenko, V. V. Lobastov, L. Schäfer, J. D.
Ewbank, J. Mol. Struct., 1996, 377, 261-269.
16. J. L. Kuester, J. H. Mize, Optimization Technique with FORTRAN, McGraw-Hill, New York, 1973.
17. A. A. Ischenko, J. D. Ewbank; L. Schäfer, J. Phys.
Chem., 1994, 98, 217.
18. J. D. Ewbank, D. W. Paul, L. Schäfer, IR 100 Awards, Research and Development, October, 1985.
19. A. A. Ischenko, L. Schäfer, and J. D. Ewbank, Time- Resolved Diffraction, Edited by J. R. Helliwell and P.
M. Rentzepis, Clarendon Press, Oxford, 1997.
20. a). S. Szatmari and F. P. Schäfer, Appl. Phys., 1988, B49, 305. b) S. Szatmari, G. Almasi, and P. Simon, Appl. Phys., 1991, B53, 82.
21. J.R. Pierce, Theory and Design of Electron Beams, Van Nostand, Princeton, NJ, 1954.
22. W. R. Gentry and C. F. Giese, Rev. Sci. Instrum., 1978, 49, 595.
23. A. A. Ischenko, L. Schäfer, and J. D. Ewbank, Time- Resolved Diffraction, Edited by J. R. Helliwell and P.
M. Rentzepis, Clarendon Press, Oxford, 1997.
24. A. A. Ischenko, J. D. Ewbank and L. Schäfer, J. Phys.
Chem., 1994, 98, 4287.
25. P. Maggard, V. A. Lobastov, L. Schäfer, J. D. Ewbank, A. A. Ischenko, J. Phys. Chem., 1995, 99, 13115.
26. A. A. Ischenko, V. A. Lobastov, L. Schäfer and J. D.
Ewbank, J. Mol. Struct., 1996, 377, 261.
27. L. S. Bartell and L. O. Brockway, J. Chem. Phys., 1955, 23, 1860.
28. V. Typke, M. Dakkouri, H. Oberhammer, J. Mol.
Struct., 1978, 44, 85.
29. D. K. Coles, R. H. Hughes, Phys. Rev., 1949, 76, 858.