D I A B E T E S & M E T A B O L I S M J O U R N A L
This is an Open Access article distributed under the terms of the Creative Commons At- tribution Non-Commercial License (http://creativecommons.org/licenses/by-nc/3.0/) which permits unrestricted non-commercial use, distribution, and reproduction in any medium, provided the original work is properly cited.
Serum Ceruloplasmin Level as a Predictor for the Progression of Diabetic Nephropathy in Korean Men with Type 2 Diabetes Mellitus
Min Jung Lee*, Chang Hee Jung*, Yu Mi Kang, Jung Eun Jang, Jaechan Leem, Joong-Yeol Park, Woo Je Lee
Department of Internal Medicine, Asan Medical Center, University of Ulsan College of Medicine, Seoul, Korea
Background: Oxidative stress is known to be associated with progression of diabetic kidney disease. Ceruloplasmin acts as a pro-oxidant under conditions of severe oxidative stress. Thus, we conducted a longitudinal observational study to evaluate whether the serum ceruloplasmin level is a predictive biomarker for progression of diabetic nephropathy.
Methods: A total of 643 Korean men with type 2 diabetes mellitus were enrolled. Serum ceruloplasmin was measured using a nephelometric method. Progression of diabetic nephropathy was defined as transition in albuminuria class (i.e., normoalbumin- uria to microalbuminuria, microalbuminuria to macroalbuminuria, or normoalbuminuria to macroalbuminuria) and/or a greater than 2-fold increase of serum creatinine at follow-up compared with the baseline value.
Results: During the follow-up period (median, 2.7 years; range, 0.3 to 4.4 years), 49 of 643 patients (7.6%) showed the progres- sion of diabetic nephropathy and three patients (0.5%) developed end-stage renal disease. Baseline ceruloplasmin levels were higher in the progressors than in the nonprogressors (262.6±40.9 mg/L vs. 233.3±37.8 mg/L, P<0.001). Kaplan-Meier analysis showed a significantly higher incidence of nephropathy progression according to ceruloplasmin tertile (log-rank test, P<0.001).
The hazard ratio (HR) for progression of diabetic nephropathy was significantly higher in the highest ceruloplasmin tertile cate- gory compared with the lowest ceruloplasmin tertile category, even after adjusting for confounding variables (HR, 3.32; 95%
confidence interval, 1.28 to 8.61; P=0.003).
Conclusion: Baseline serum ceruloplasmin is an independent predictive factor for the progression of diabetic nephropathy in patients with type 2 diabetes mellitus.
Keywords: Ceruloplasmin; Diabetic nephropathies; Oxidative stress
Corresponding author: Woo Je Lee
Department of Internal Medicine, Asan Medical Center, University of Ulsan College of Medicine, 88 Olympic-ro 43-gil, Songpa-gu, Seoul 138-736, Korea E-mail: [email protected]
*Min Jung Lee and Chang Hee Jung contributed equally to this study as first
INTRODUCTION
Diabetic kidney disease is the most common cause of chronic kidney disease, leading to end-stage renal disease (ESRD) and premature death [1]. In addition, it negatively affects a patient’s quality of life and social environment, and poses a burden on national health care budgets [2]. Although various therapeutic approaches, such as hypoglycemic agents, antihypertensive drugs, and renin-angiotensin system inhibitors, have been tried
to slow the progression of nephropathy, the number of patients with diabetic kidney disease continues to rise with the preva- lence of type 2 diabetes mellitus [3]. Thus, early identification of patients at risk of developing diabetic nephropathy and initi- ation of appropriate therapy is important to improve patient outcomes.
Ceruloplasmin, a copper-carrying metalloenzyme, acts as an antioxidant through its ferroxidase activity [4]. However, in conditions of elevated oxidative stress, it may act as a pro-oxi- http://dx.doi.org/10.4093/dmj.2015.39.3.230
pISSN 2233-6079 · eISSN 2233-6087
dant by donating of free copper ions, which induces reactive oxygen species (ROS) formation and low density lipoprotein (LDL) oxidation [5]. In addition, as an acute phase protein, the ceruloplasmin level reflects acute and chronic inflammation in an organism [5]. Elevated serum ceruloplasmin levels have been observed in both type 1 and type 2 diabetes [6,7] and in patients with diabetic retinopathy [8]. In line with that, in our previous cross-sectional study, we observed a positive associa- tion between serum ceruloplasmin level and albuminuria in patients with type 2 diabetes mellitus [9]. However, longitudi- nal studies investigating the association between serum cerulo- plasmin and development of diabetic nephropathy had not been conducted. Thus, to evaluate the role of serum ceruloplas- min as a biomarker for predicting progression of diabetic ne- phropathy, we conducted this longitudinal observational study.
METHODS
Study population
Study subjects were recruited from an outpatient clinic at a ma- jor referral center, Asan Medical Center (Seoul, Korea). A total of 703 patients whose serum ceruloplasmin levels were measured were followed up from January 2009 through December 2013.
Ceruloplasmin were measured in patients with type 2 diabetes mellitus who visited our diabetes clinic for the first time after reg- istration at the Asan Diabetes Registry as well as in patients with type 2 diabetes mellitus who underwent screening tests for dia- betic microvascular complications regularly every 1 to 2 years.
There was no doctor’s intention in the recruitment process.
All patients visited the diabetes clinic on a regular basis (ev- ery 3 or 6 months). Subjects with histories of chronic inflam- matory processes (n=1, ulcerative colitis; n=2, rheumatoid ar- thritis) or liver cirrhosis (n=6; due to hepatitis B infection in four cases and alcohol use in two cases), and those with leuko- cytosis or leukopenia (blood leukocyte count >10.0×10³/mm3 or <4.0×10³/mm3, n=51) at baseline were excluded. After the exclusion of ineligible subjects, 643 subjects with a mean age of 57.0 years (range, 24 to 86 years) were included in the analysis.
The Institutional Review Board of Asan Medical Center ap- proved this retrospective observational study, and waived for requirement of written informed consent because personal in- formation was not included in this analysis and risk of this study was considered to be negligible.
Lifestyle factors and measurements
All participants were interviewed by a specially trained nurse,
and information on medication and history of previous medical or surgical diseases was obtained. Smoking habits were catego- rized as “never,” “previous,” or “current.” A history of cardiovas- cular disease (CVD) was defined as a history of angina, myocar- dial infarction, and/or cerebrovascular incidents. Antidiabetic treatments were categorized as none, oral hypoglycemic agents (OHAs), insulin, or insulin combined with OHAs. The antihy- pertensive medications that subjects were taking were catego- rized as angiotensin-converting enzyme inhibitors (ACEi), an- giotensin II receptor blockers (ARBs), or others (β-blockers, calcium-channel blockers, diuretics, or α-blockers). Height (m) and weight (kg) were measured while subjects were wearing light clothing without shoes. Body mass index (BMI, kg/m2) was calculated as weight in kilograms divided by the square of height in meters. Blood pressure was measured using an auto- matic manometer with an appropriate cuff size on the right arm after a resting period of ≥5 minutes at intervals of 6 months, and mean systolic blood pressure (SBP) and diastolic blood pressure (DBP) values for the observation period were used as follow-up data. The presence of retinopathy was assessed by ret- inal photography (two fields per eye) with a wide-angle camera and scored centrally by an ophthalmologist.
After overnight fasting, early morning blood samples were drawn from the antecubital vein. Fasting total cholesterol, high density lipoprotein cholesterol, LDL cholesterol (LDL-C), tri- glyceride (TG), and uric acid levels were measured using an en- zymatic colorimetric method (Toshiba Medical System Co., Ltd., Tokyo, Japan). High sensitivity C-reactive protein (hsCRP) and fasting plasma glucose (FPG) concentrations were mea- sured using immunoturbidimetric (Toshiba) and enzymatic colorimetric (Toshiba) methods, respectively. Glycosylated he- moglobin (HbA1c) was measured using an immunoturbidimet- ric method and an Integra 800 System (Roche Diagnostics, Ba- sel, Switzerland) every 6 months, and calculated mean HbA1c values for the observation period were used as follow-up data.
The extent of albuminuria was determined from the urinary albumin-to-creatinine ratio (UACR), which was measured by a photometric method using the Integra 800 system (Roche Di- agnostics) in a random spot urine collection. The category of albuminuria was defined as normoalbuminuria if the UACR was <30 mg/g, microalbuminuria if the UACR was 30 to 299 mg/g, and macroalbuminuria if the UACR was ≥300 mg/g [10]. Creatinine was measured using the Jaffe method, and es- timated glomerular filtration rate (eGFR) was calculated using the Modification of Diet in Renal Disease study equation [11].
Serum ceruloplasmin level was measured using a nephelomet- ric method (BN II System; Siemens, Marburg, Germany).
Definition of diabetic nephropathy progression
The outcome in terms of “progression of diabetic nephropathy”
was defined as transition in albuminuria class (i.e., normo- to microalbuminuria, micro- to macroalbuminuria, or normo- to macroalbuminuria) and/or a greater than 2-fold increase in se- rum creatinine at follow-up compared with the baseline value.
Transition in albuminuria class and doubling of creatinine val- ue were confirmed by at least two consecutive tests to reduce misclassification.
Statistical analyses
Subjects were categorized into three tertile groups (i.e., Q1
≤219 mg/L, Q2=220 to 249 mg/L, and Q3 ≥250 mg/L) ac- cording to the baseline ceruloplasmin concentration. Continu- ous variables with a normal distribution were expressed as the mean±standard deviation, and continuous variables with a skewed distribution were expressed as the median (interquar- tile range). Categorical variables were expressed as percentages (%). Characteristics of the study population according to ceru- loplasmin tertile categories were compared using one-way analysis of variance or the Kruskal-Wallis test for continuous variables, and the chi-square test for categorical variables.
Demographic and biochemical characteristics of the study population with respect to the progression of diabetic nephrop- athy were compared using an independent t-test or the Mann- Whitney U test for continuous variables, and the chi-square test for categorical variables. Time to progression of diabetic ne- phropathy was estimated by the Kaplan-Meier method and sta- tistical differences among groups were compared by the log- rank test. The follow-up time was censored if diabetic nephrop- athy progressed or if the patient was lost to follow-up. To calcu- late the hazard ratios (HRs) and 95% confidence intervals (CIs) of each ceruloplasmin tertile category for the development of diabetic nephropathy, multivariate Cox proportional hazard models were applied after adjustment for conventional risk fac- tors of diabetic nephropathy. Traditional diabetic nephropathy risk factors were included in model 1 and factors that showed a statistically significant (P<0.05) or borderline significant (P<
0.10) associations in the univariate analysis were included in model 2. All the variables in models 1 and 2 were included in model 3.
All statistical analyses were carried out using SPSS version
19.0 (SPSS Inc., Chicago, IL, USA). A P value of <0.05 was con- sidered statistically significant.
RESULTS
Table 1 shows the clinical and biochemical characteristic of the subjects according to serum ceruloplasmin tertile category at baseline. There were significant positive associations between ceruloplasmin tertile category and SBP, current smoking status, HbA1c, total cholesterol, LDL-C, hsCRP, UACR, and percentage of subjects using insulin therapy at baseline. There was a border- line significant positive association between ceruloplasmin ter- tile and the prevalence of retinopathy at baseline. Among follow- up data, UACR measured at the time of last follow-up or at event occurrence increased according to ceruloplasmin tertile.
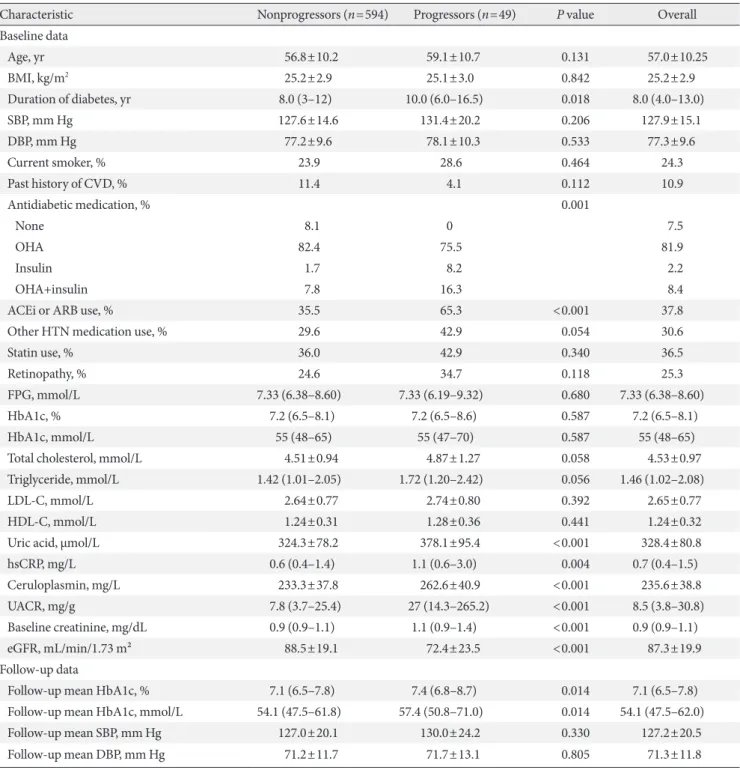
During the follow-up period (median, 2.7 years; range, 0.3 to 4.4 years), 49 of 643 patients (7.6%) showed the progression of diabetic nephropathy and three patients (0.5%) developed ESRD. The clinical and biochemical characteristics at baseline and during follow-up for progressors and non-progressors are shown in Table 2. Duration of diabetes was significantly longer in progressors compared with nonprogressors. Progressors tended to use of insulin therapy and ACEi or ARB at baseline more frequently than nonprogressors. The percentage of sub- jects taking other antihypertensive medication tended to be higher in progressors, with borderline statistical significance.
Progressors had significantly higher levels of uric acid, hsCRP, UACR, and creatinine at baseline, but a lower eGFR compared with non-progressors. They had higher values of total choles- terol and TG at baseline, although the associations were bor- derline significant. Baseline ceruloplasmin levels were signifi- cantly higher in the progressors than in the non-progressors (262.6±40.9 mg/L vs. 233.3±37.8 mg/L, P<0.001). During the follow-up period, the two groups did not differ in terms of mean SBP and DBP, but mean HbA1c was significantly higher in progressors than nonprogressors. At the time of event oc- currence or the last observation, the progressors had higher UACR and creatinine, but lower eGFR compared with non- progressors (all P values <0.001).
Kaplan-Meier analysis demonstrated a significantly higher incidence of progression of diabetic nephropathy according to baseline ceruloplasmin tertile (log-rank test, P<0.001) (Fig. 1).
Above all, subjects in Q3 showed a significantly increasing trend of diabetic nephropathy progression compared with Q1 and Q2 (Q1 vs. Q3, P<0.001; Q2 vs. Q3, P=0.002). No difference
Table 1. Clinical and biochemical characteristics of the study subjects according to serum ceruloplasmin tertile categories at baseline Characteristic
Ceruloplasmin tertile categories
P value Q1 (≤219 mg/L)
(n=222) Q2 (220−249 mg/L)
(n=210) Q3 (≥250 mg/L)
(n=211) Baseline data
Age, yr 56.7±9.9 57.4±9.5 56.9±11.4 0.807
BMI, kg/m2 25.3±2.8 25.3±2.7 25.1±3.2 0.597
Duration of diabetes, yr 8.0 (4.0–12.0) 8.0 (5.0–13.0) 7.0 (3.0–13.0) 0.209
SBP, mm Hg 126.5±14.1 127.3±14.8 130.1±16.3 0.035
DBP, mm Hg 77.0±9.0 76.8±9.6 78.1±10.2 0.326
Current smoker, % 18.5 28.6 26.1 0.038
Past history of CVD, % 12.6 11.0 9.0 0.484
Antidiabetic medication, % <0.001
None 6.8 8.1 7.6
OHA 90.1 82.3 72.9
Insulin 0.5 0 6.2
OHA+insulin 2.7 9.6 13.3
ACEi or ARB use, % 33.3 41.0 39.3 0.225
Other HTN medication use, % 27.9 33.8 30.3 0.413
Statin use, % 36.5 35.7 37.4 0.934
Retinopathy, % 19.8 28.6 28.0 0.064
FPG, mmol/L 7.3 (6.48–8.23) 7.33 (6.11–8.82) 7.38 (6.44–8.99) 0.443
HbA1c, % 7.0 (6.5–7.7) 7.2 (6.4–8.2) 7.5 (6.7–8.4) 0.001
HbA1c, mmol/L 53 (48–61) 55 (46–66) 58 (50–68) 0.001
Total cholesterol, mmol/L 4.42±0.93 4.48±0.90 4.71±1.06 0.005
Triglyceride, mmol/L 1.38 (0.98–1.98) 1.51 (1.11–2.11) 1.46 (1.01–2.16) 0.513
LDL-C, mmol/L 2.54±0.74 2.62±0.76 2.79±0.81 0.004
HDL-C, mmol/L 1.27±0.34 1.23±0.30 1.21±0.29 0.114
Uric acid, μmol/L 321.4±74.1 334.3±80.6 329.9±87.3 0.243
hsCRP, mg/L 0.5 (0.3–0.8) 0.6 (0.3–1.2) 1.3 (0.7–2.8) <0.001
Ceruloplasmin, mg/L 197.3±17.3 233.6±8.4 277.8±29.6 -
UACR, mg/g 5.9 (3.1–13.9) 9.7 (4.2–39.9) 11.9 (4.5–46.3) <0.001
Creatinine, mg/dL 1.0 (0.9–1.1) 1.0 (0.9–1.1) 0.9 (0.8–1.1) 0.376
eGFR, mL/min/1.73 m² 87.1±17.1 86.0±19.4 88.9±23.0 0.325
Follow-up data
Follow-up mean HbA1c, % 7.1 (6.6–7.7) 7.1 (6.5–8.0) 7.2 (6.5–8.0) 0.766
Follow-up mean HbA1c, mmol/L 54 (49–61) 54 (48–63) 55 (48–64) 0.766
Follow-up mean SBP, mm Hg 126.0±23.0 126.0±20.0 129.7±17.9 0.123
Follow-up mean DBP, mm Hg 70.9±13.3 70.4±11.2 72.5±10.6 0.192
Last UACR, mg/ga 7.6 (3.7–17.5) 9.1 (4.4–44.0) 12.0 (5.0–71.8) <0.001
Last creatinine, mg/dL 0.9 (0.8–1.0) 0.9 (0.8–1.1) 0.9 (0.8–1.1) 0.542
Last eGFR, mL/min/1.73 m² 89.5±18.3 88.1±24.1 90.9±29.6 0.488
Progression of diabetic nephropathy, n (%) 6 (2.7) 12 (5.7) 31 (14.7) <0.001
(Continued to the next page)
Values are presented as mean±standard deviation, median (range) unless otherwise indicated.
BMI, body mass index; SBP, systolic blood pressure; DBP, diastolic blood pressure; CVD, cardiovascular disease; OHA, oral hypoglycemic agent; ACEi, angiotensin-converting enzyme inhibitor; ARB, angiotensin II receptor blocker; HTN, hypertension; FPG, fasting plasma glucose;
HbA1c, glycosylated hemoglobin; LDL-C, low density lipoprotein cholesterol; HDL-C, high density lipoprotein cholesterol; hsCRP, high sensi- tivity C-reactive protein; UACR, urinary albumin-to-creatinine ratio; eGFR, estimated glomerular filtration rate.
aLast UACR represent UACR in spot urine sample at last follow-up or at the time of event occurrence.
Table 1. Continued
Table 2. Baseline and follow-up clinical and biochemical characteristics of progressors and nonprogressors of diabetic nephropathy
Characteristic Nonprogressors (n=594) Progressors (n=49) P value Overall
Baseline data
Age, yr 56.8±10.2 59.1±10.7 0.131 57.0±10.25
BMI, kg/m2 25.2±2.9 25.1±3.0 0.842 25.2±2.9
Duration of diabetes, yr 8.0 (3–12) 10.0 (6.0–16.5) 0.018 8.0 (4.0–13.0)
SBP, mm Hg 127.6±14.6 131.4±20.2 0.206 127.9±15.1
DBP, mm Hg 77.2±9.6 78.1±10.3 0.533 77.3±9.6
Current smoker, % 23.9 28.6 0.464 24.3
Past history of CVD, % 11.4 4.1 0.112 10.9
Antidiabetic medication, % 0.001
None 8.1 0 7.5
OHA 82.4 75.5 81.9
Insulin 1.7 8.2 2.2
OHA+insulin 7.8 16.3 8.4
ACEi or ARB use, % 35.5 65.3 <0.001 37.8
Other HTN medication use, % 29.6 42.9 0.054 30.6
Statin use, % 36.0 42.9 0.340 36.5
Retinopathy, % 24.6 34.7 0.118 25.3
FPG, mmol/L 7.33 (6.38–8.60) 7.33 (6.19–9.32) 0.680 7.33 (6.38–8.60)
HbA1c, % 7.2 (6.5–8.1) 7.2 (6.5–8.6) 0.587 7.2 (6.5–8.1)
HbA1c, mmol/L 55 (48–65) 55 (47–70) 0.587 55 (48–65)
Total cholesterol, mmol/L 4.51±0.94 4.87±1.27 0.058 4.53±0.97
Triglyceride, mmol/L 1.42 (1.01–2.05) 1.72 (1.20–2.42) 0.056 1.46 (1.02–2.08)
LDL-C, mmol/L 2.64±0.77 2.74±0.80 0.392 2.65±0.77
HDL-C, mmol/L 1.24±0.31 1.28±0.36 0.441 1.24±0.32
Uric acid, μmol/L 324.3±78.2 378.1±95.4 <0.001 328.4±80.8
hsCRP, mg/L 0.6 (0.4–1.4) 1.1 (0.6–3.0) 0.004 0.7 (0.4–1.5)
Ceruloplasmin, mg/L 233.3±37.8 262.6±40.9 <0.001 235.6±38.8
UACR, mg/g 7.8 (3.7–25.4) 27 (14.3–265.2) <0.001 8.5 (3.8–30.8)
Baseline creatinine, mg/dL 0.9 (0.9–1.1) 1.1 (0.9–1.4) <0.001 0.9 (0.9–1.1)
eGFR, mL/min/1.73 m² 88.5±19.1 72.4±23.5 <0.001 87.3±19.9
Follow-up data
Follow-up mean HbA1c, % 7.1 (6.5–7.8) 7.4 (6.8–8.7) 0.014 7.1 (6.5–7.8)
Follow-up mean HbA1c, mmol/L 54.1 (47.5–61.8) 57.4 (50.8–71.0) 0.014 54.1 (47.5–62.0)
Follow-up mean SBP, mm Hg 127.0±20.1 130.0±24.2 0.330 127.2±20.5
Follow-up mean DBP, mm Hg 71.2±11.7 71.7±13.1 0.805 71.3±11.8
(Continued to the next page)
Table 2. Continued
Characteristic Nonprogressors (n=594) Progressors (n=49) P value Overall
Last UACR, mg/ga 8.0 (3.9–21.1) 279.6 (51.5–667.1) <0.001 9.0 (4.1–30.5)
Last creatinine, mg/dL 0.9 (0.8–1.0) 1.1 (0.9–2.1) <0.001 0.9 (0.8–1.1)
Last eGFR, mL/min/1.73 m2 91.0±21.8 71.0±41.1 0.001 89.5±24.3
Values are presented as mean±standard deviation, median (range) unless otherwise indicated.
BMI, body mass index; SBP, systolic blood pressure; DBP, diastolic blood pressure; CVD, cardiovascular disease; OHA, oral hypoglycemic agent; ACEi, angiotensin-converting enzyme inhibitor; ARB, angiotensin II receptor blocker; HTN, hypertension; FPG, fasting plasma glucose;
HbA1c, glycosylated hemoglobin; LDL-C, low density lipoprotein cholesterol; HDL-C, high density lipoprotein cholesterol; hsCRP, high sensi- tivity C-reactive protein; UACR, urinary albumin-to-creatinine ratio; eGFR, estimated glomerular filtration rate.
aLast UACR represent UACR in spot urine sample at last follow-up or at the time of event occurrence.
was found between Q1 and Q2 (P=0.167).
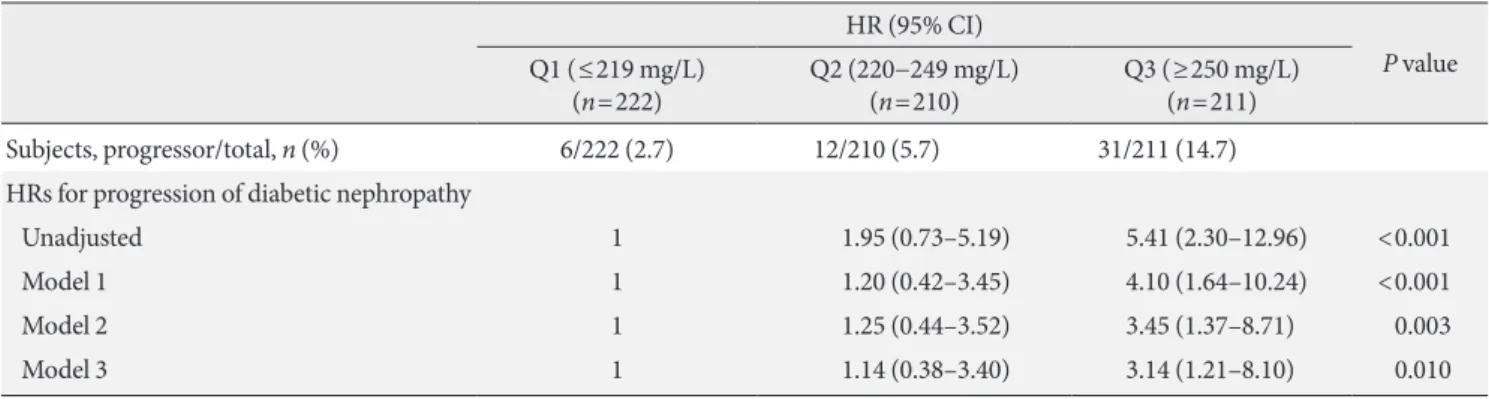
When we performed multivariate Cox regression analysis adopting various models, the HRs for progression of diabetic nephropathy according to baseline ceruloplasmin tertile catego- ry consistently showed an increasing trend (Table 3). In the un- adjusted model, the HRs and 95% CIs based on ceruloplasmin tertile groups were 1.95 (0.73 to 5.19) for Q2, and 5.41 (2.30 to 12.96) for Q3, respectively (P<0.001), with Q1 as reference. Af- ter adjusting for confounding variables including age, BMI, du- ration of diabetes, current smoker, past history of CVD, antidia- betic medication, ACEi or ARB use, other HTN medication, retinopathy, FPG, total cholesterol, uric acid, hsCRP, baseline UACR, baseline creatinine, follow-up mean HbA1c, follow-up mean SBP and follow-up mean DBP, the HRs (95% CI) for pro- gression of diabetic nephropathy were 1.14 (0.38 to 3.40) for Q2
40 30 20 10 Cumulative incidence (%) 0
0 6 12 18 24 30 36 42 48 54 60 Follow-up (mo)
P<0.001
Q3
Q2 Q1
Q1 222 175 175 175 171 160 115 153 15 Q2 210 186 182 171 161 147 114 61 23 Q3 211 180 180 169 156 141 107 59 17
No. at risk
Fig. 1. Kaplan-Meier curves for progression of diabetic ne- phropathy according to serum ceruloplasmin tertile categories.
Table 3. HRs and 95% CI for progression of diabetic nephropathy based on serum ceruloplasmin tertile categories HR (95% CI)
P value Q1 (≤219 mg/L)
(n=222) Q2 (220−249 mg/L)
(n=210) Q3 (≥250 mg/L)
(n=211)
Subjects, progressor/total, n (%) 6/222 (2.7) 12/210 (5.7) 31/211 (14.7)
HRs for progression of diabetic nephropathy
Unadjusted 1 1.95 (0.73–5.19) 5.41 (2.30–12.96) <0.001
Model 1 1 1.20 (0.42–3.45) 4.10 (1.64–10.24) <0.001
Model 2 1 1.25 (0.44–3.52) 3.45 (1.37–8.71) 0.003
Model 3 1 1.14 (0.38–3.40) 3.14 (1.21–8.10) 0.010
Model 1: adjusted for conventional diabetic nephropathy risk factors (age, body mass index, duration of diabetes, current smoker, angiotensin- converting enzyme inhibitor (ACEi) or angiotensin II receptor blocker (ARB) use, other hypertension medication, high sensitivity C-reactive protein, baseline urinary albumin-to-creatinine ratio (UACR), baseline creatinine, follow-up mean glycosylated hemoglobin (HbA1c), follow- up mean systolic blood pressure (SBP), follow-up mean diastolic blood pressure). Model 2: adjusted for factors that showed a statistically sig- nificant (P<0.05, i.e., antidiabetic medication, ACEi or ARB use, fasting plasma glucose, total cholesterol, uric acid, baseline UACR, baseline creatinine, follow-up mean HbA1c) or borderline significant (P<0.10, i.e., duration of diabetes, baseline SBP, past history of cardiovascular dis- ease, retinopathy) association in the univariate analysis. Model 3: adjusted for all the variables in models 1 and 2.
HR, hazard ratio; CI, confidence interval.
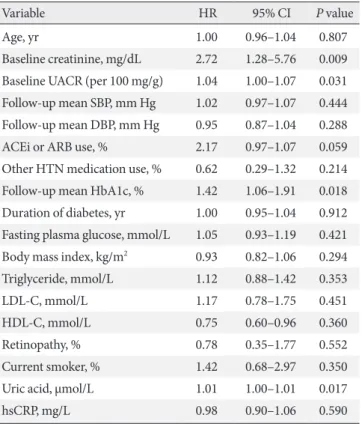
Table 4. Other risk factors for progression of diabetic nephrop- athy demonstrated by multivariate Cox regression analysis
Variable HR 95% CI P value
Age, yr 1.00 0.96–1.04 0.807
Baseline creatinine, mg/dL 2.72 1.28–5.76 0.009 Baseline UACR (per 100 mg/g) 1.04 1.00–1.07 0.031 Follow-up mean SBP, mm Hg 1.02 0.97–1.07 0.444 Follow-up mean DBP, mm Hg 0.95 0.87–1.04 0.288
ACEi or ARB use, % 2.17 0.97–1.07 0.059
Other HTN medication use, % 0.62 0.29–1.32 0.214 Follow-up mean HbA1c, % 1.42 1.06–1.91 0.018 Duration of diabetes, yr 1.00 0.95–1.04 0.912 Fasting plasma glucose, mmol/L 1.05 0.93–1.19 0.421 Body mass index, kg/m2 0.93 0.82–1.06 0.294 Triglyceride, mmol/L 1.12 0.88–1.42 0.353
LDL-C, mmol/L 1.17 0.78–1.75 0.451
HDL-C, mmol/L 0.75 0.60–0.96 0.360
Retinopathy, % 0.78 0.35–1.77 0.552
Current smoker, % 1.42 0.68–2.97 0.350
Uric acid, μmol/L 1.01 1.00–1.01 0.017
hsCRP, mg/L 0.98 0.90–1.06 0.590
HR, hazard ratio; CI, confidence interval; UACR, urinary albumin-to- creatinine ratio; SBP, systolic blood pressure; DBP, diastolic blood pres- sure; ACEi, angiotensin-converting enzyme inhibitor; ARB, angiotensin II receptor blocker; HTN, hypertension; HbA1c, glycosylated hemoglo- bin; LDL-C, low density lipoprotein cholesterol; HDL-C, high density lipoprotein cholesterol; hsCRP, high sensitivity C-reactive protein.
In this longitudinal observational study, elevated ceruloplas- min levels at baseline were found to be positively associated with progression of diabetic nephropathy. After adjusting for conventional risk factors, ceruloplasmin levels still remained an independent risk factor for the progression of diabetic ne- phropathy. This result indicates that an elevated ceruloplasmin level might be a strong predictor of diabetic nephropathy pro- gression.
The exact mechanism underlying this positive association between ceruloplasmin levels and progression of diabetic ne- phropathy is largely unknown. One plausible explanation is that ceruloplasmin might act as a pro-oxidant under condi- tions of increased oxidative stress, such as in type 2 diabetes mellitus [8]. Although ceruloplasmin possesses antioxidant properties due to its ferroxidase activity [4], increased genera- tion of ROS disrupts the binding of copper from ceruloplas- min which further induces ROS formation and LDL oxidation [5]. Considering that increased oxidative stress and oxidized LDL are known to be associated with progression of diabetic kidney disease [13], elevated ceruloplasmin level might reflect or augment progression of diabetic nephropathy.
In addition, as an acute phase protein, ceruloplasmin might reflect subclinical inflammation, which plays a critical role in the pathogenesis of diabetic nephropathy [14]. Navarro et al.
[15] reported that inflammatory parameters including hsCRP are independently associated with urinary albumin excretion.
However, when we performed multivariate Cox regression analysis, serum hsCRP levels were not associated with the pro- gression of diabetic nephropathy (HR, 0.98; 95% CI, 0.90 to 1.06; P=0.590) (Table 4), which contrasts with the results of a previous study [15]. Although the reasons for these discrepan- cies are unclear, we suspect that, compared with hsCRP, elevat- ed ceruloplasmin might reflect chronic subclinical inflamma- tion more sensitively or play a more important role in the pro- gression of diabetic nephropathy.
In multivariate Cox regression analysis, baseline creatinine, UACR, and follow-up mean HbA1c were found to be predic- tive factors for the progression of diabetic nephropathy, which is in line with previous studies [16-18]. However, multivariate Cox regression analysis did not indicate that SBP was an inde- pendent predictor of progressive diabetic nephropathy, which was inconsistent with previous studies [19]. Since progressors tend to take ACEi or ARB and other hypertension medication at baseline more often than non-progressors, the difference in hypertensive medications between groups during the follow- and 3.14 (1.21 to 8.10) for Q3, respectively (P=0.010). Besides
baseline ceruloplasmin, baseline creatinine, baseline UACR, fol- low-up mean HbA1c, and uric acid were predictive factors for the development of diabetic nephropathy in model 3 (Table 4).
DISCUSSION
Diabetic nephropathy is a leading cause of ESRD and greatly contributes to all-cause mortality in type 2 diabetes [1]. To slow the progression of diabetic nephropathy, early detection and treatment of those patients at risk of developing nephropathy is regarded as an important goal [12]. Recently, several novel bio- markers have been investigated to predict nephropathy in pa- tients with type 2 diabetes. However there were few longitudi- nal studies with suitable methodological quality that properly adjusted for traditional conventional risk factors for diabetic nephropathy [12].
up period might affect this outcome.
Furthermore, in our study, an increased baseline uric acid level was predictive for the progression of diabetic nephropa- thy, which is in accordance with previous studies [18,20]. Sev- eral studies showed that high uric acid level as well as cerulo- plasmin was associated with increased oxidative stress [5,21], but further study is need to clarify the connections between those biomarkers and mechanisms of how they contributes to diabetic nephropathy.
Although not statistically significant, we observed a tenden- cy for eGFR to be increased in patients with the highest cerulo- plasmin tertile category (Table 1). Since glomerular hyperfiltra- tion usually occurs in early stages of diabetic nephropathy [22], it can be speculated that an elevated eGFR in the highest tertile category might reflect the early stages of renal dysfunction.
Long-term extension studies will be required to evaluate the as- sociation between serum ceruloplasmin and changes in eGFR.
This study has several limitations. First, we investigated the relationship between ceruloplasmin and progression of diabetic nephropathy only in men. Since medications such as oral con- traceptives can affect ceruloplasmin levels [23], women were not included in this study and the result cannot be generalized to both sexes. Second, although we postulated that dissociated free copper, ROS, and oxidized LDL might play a role in cerulo- plasmin-mediated diabetic nephropathy, we did not measure these values. Considering the previous report that ceruloplas- min was positively correlated with makers of ROS under the oxidative stress conditions [24], it might be better to measure oxidative stress makers as well as the level of ceruloplasmin in our study. Third, in this study, ceruloplasmin was measured by nephelometry. It has been suggested that the ratio of enzymatic to immunoreactive ceruloplasmin is a better indicator of cop- per status than either enzyme activity or immunoreactive ceru- loplasmin level alone [25]. Thus, it might be better to assess ce- ruloplasmin using both methods. Forth, since increased uri- nary excretions of ceruloplasmin also predicted development of microalbuminuria in type 2 diabetic patients [26], concur- rent measure of serum and urinary ceruloplasmin might be beneficial to evaluate the association between these markers, but we did not measure the level of urinary ceruloplasmin. In addition, we did not measure follow-up ceruloplasmin values and could not evaluate whether participants remained in ini- tially allocated tertile category at the end of study. Lastly, to eval- uate the long-term prognosis, it might be better to evaluate the occurrence of ESRD or death rather than transition of albumin-
uria class as the primary outcome. Although three patients de- veloped ESRD (one event in group Q1, two events in group Q3) in this study, long-term follow-up of large numbers of subjects will be required to evaluate the ultimate outcome.
Despite these limitations, our study has some robust features, in that we properly adjusted for various conventional risk fac- tors that might affect the progression of diabetic nephropathy.
It should be noted that the predictive value of ceruloplasmin in our Cox model was found to be equal to or even stronger than that of well-known risk factors for the progression of diabetic nephropathy, including hyperglycemia, baseline creatinine, UACR, and uric acid. Furthermore, we observed that the number of subjects who exceeded a 2-fold increase of creatinine at follow- up tended to rise with ceruloplasmin tertile group (one event in group Q1, three events in group Q2, and six events in group Q3). Although this subgroup analysis was not statistically sig- nificant, due to the small number of events, this result prompts further investigation of the possibility that an increased cerulo- plasmin level predicts renal dysfunction as well as transition in albuminuria class.
Albuminuria has been traditionally considered as the hall- mark for diabetic nephropathy [27], but recent studies showed that one third to one half of type 2 diabetes with chronic kidney disease have no proteinuria [28,29]. Although it is not widely available in clinical practice, measurements of serum cerulo- plasmin might be used to compensate this limitation of ‘albu- minuria’ as a predictive marker for diabetic nephropathy. To evaluate the predictive role of ceruloplasmin on progression of
‘nonalbuminuric diabetic nephropathy,’ further study will be required.
In conclusion, these data suggest that an elevated serum ce- ruloplasmin is a strong prognostic marker for progression of diabetic nephropathy in patients with type 2 diabetes mellitus.
This effect remains significant even after adjustment for con- ventional risk factors for diabetic nephropathy. Therefore, mea- suring ceruloplasmin levels in addition to UACR might be used for early identification of patients at risk of diabetic nephropa- thy in order to initiate appropriate therapy.
CONFLICTS OF INTEREST
No potential conflict of interest relevant to this article was re- ported.
REFERENCES
1. Afkarian M, Sachs MC, Kestenbaum B, Hirsch IB, Tuttle KR, Himmelfarb J, de Boer IH. Kidney disease and increased mor- tality risk in type 2 diabetes. J Am Soc Nephrol 2013;24:302-8.
2. Gordois A, Scuffham P, Shearer A, Oglesby A. The health care costs of diabetic nephropathy in the United States and the Unit- ed Kingdom. J Diabetes Complications 2004;18:18-26.
3. de Boer IH, Rue TC, Hall YN, Heagerty PJ, Weiss NS, Himmel- farb J. Temporal trends in the prevalence of diabetic kidney dis- ease in the United States. JAMA 2011;305:2532-9.
4. Harris ZL. Aceruloplasminemia. J Neurol Sci 2003;207:108-9.
5. Shukla N, Maher J, Masters J, Angelini GD, Jeremy JY. Does ox- idative stress change ceruloplasmin from a protective to a vas- culopathic factor? Atherosclerosis 2006;187:238-50.
6. Cunningham J, Leffell M, Mearkle P, Harmatz P. Elevated plas- ma ceruloplasmin in insulin-dependent diabetes mellitus: evi- dence for increased oxidative stress as a variable complication.
Metabolism 1995;44:996-9.
7. Daimon M, Susa S, Yamatani K, Manaka H, Hama K, Kimura M, Ohnuma H, Kato T. Hyperglycemia is a factor for an increase in serum ceruloplasmin in type 2 diabetes. Diabetes Care 1998;
21:1525-8.
8. Memisogullari R, Bakan E. Levels of ceruloplasmin, transfer- rin, and lipid peroxidation in the serum of patients with type 2 diabetes mellitus. J Diabetes Complications 2004;18:193-7.
9. Jung CH, Lee WJ, Yu JH, Hwang JY, Shin MS, Koh EH, Kim MS, Park JY. Elevated serum ceruloplasmin levels are associated with albuminuria in Korean men with type 2 diabetes mellitus. Dia- betes Res Clin Pract 2011;94:e3-7.
10. Molitch ME, DeFronzo RA, Franz MJ, Keane WF, Mogensen CE, Parving HH, Steffes MW; American Diabetes Association.
Nephropathy in diabetes. Diabetes Care 2004;27 Suppl 1:S79-83.
11. Levey AS, Bosch JP, Lewis JB, Greene T, Rogers N, Roth D. A more accurate method to estimate glomerular filtration rate from serum creatinine: a new prediction equation. Modification of Diet in Renal Disease Study Group. Ann Intern Med 1999;
130:461-70.
12. Hellemons ME, Kerschbaum J, Bakker SJ, Neuwirt H, Mayer B, Mayer G, de Zeeuw D, Lambers Heerspink HJ, Rudnicki M.
Validity of biomarkers predicting onset or progression of ne- phropathy in patients with type 2 diabetes: a systematic review.
Diabet Med 2012;29:567-77.
13. Ujihara N, Sakka Y, Takeda M, Hirayama M, Ishii A, Tomona- ga O, Babazono T, Takahashi C, Yamashita K, Iwamoto Y. As-
sociation between plasma oxidized low-density lipoprotein and diabetic nephropathy. Diabetes Res Clin Pract 2002;58:
109-14.
14. Wada J, Makino H. Inflammation and the pathogenesis of dia- betic nephropathy. Clin Sci (Lond) 2013;124:139-52.
15. Navarro JF, Mora C, Maca M, Garca J. Inflammatory parame- ters are independently associated with urinary albumin in type 2 diabetes mellitus. Am J Kidney Dis 2003;42:53-61.
16. UK Prospective Diabetes Study (UKPDS) Group. Intensive blood-glucose control with sulphonylureas or insulin com- pared with conventional treatment and risk of complications in patients with type 2 diabetes (UKPDS 33). Lancet 1998;352:
837-53.
17. de Zeeuw D, Remuzzi G, Parving HH, Keane WF, Zhang Z, Shahinfar S, Snapinn S, Cooper ME, Mitch WE, Brenner BM.
Proteinuria, a target for renoprotection in patients with type 2 diabetic nephropathy: lessons from RENAAL. Kidney Int 2004;
65:2309-20.
18. Hsu CY, Iribarren C, McCulloch CE, Darbinian J, Go AS. Risk factors for end-stage renal disease: 25-year follow-up. Arch In- tern Med 2009;169:342-50.
19. Bakris GL, Weir MR, Shanifar S, Zhang Z, Douglas J, van Dijk DJ, Brenner BM; RENAAL Study Group. Effects of blood pres- sure level on progression of diabetic nephropathy: results from the RENAAL study. Arch Intern Med 2003;163:1555-65.
20. Jalal DI, Maahs DM, Hovind P, Nakagawa T. Uric acid as a me- diator of diabetic nephropathy. Semin Nephrol 2011;31:459-65.
21. Zhang Y, Yamamoto T, Hisatome I, Li Y, Cheng W, Sun N, Cai B, Huang T, Zhu Y, Li Z, Jing X, Zhou R, Cheng J. Uric acid induc- es oxidative stress and growth inhibition by activating adenos- ine monophosphate-activated protein kinase and extracellular signal-regulated kinase signal pathways in pancreatic beta cells.
Mol Cell Endocrinol 2013;375:89-96.
22. Brenner BM, Lawler EV, Mackenzie HS. The hyperfiltration theory: a paradigm shift in nephrology. Kidney Int 1996;49:
1774-7.
23. Sontakke AN, More U. Changes in serum ceruloplasmin levels with commonly used methods of contraception. Indian J Clin Biochem 2004;19:102-4.
24. Kedziora-Kornatowska K, Kornatowski T, Bartosz G, Pawluk H, Czuczejko J, Kedziora J, Szadujkis-Szadurski L. Production of ni- tric oxide, lipid peroxidation and oxidase activity of ceruloplas- min in blood of elderly patients with primary hypertension. Ef- fects of perindopril treatment. Aging Clin Exp Res 2006;18 :1-6.
25. Milne DB, Johnson PE. Assessment of copper status: effect of
age and gender on reference ranges in healthy adults. Clin Chem 1993;39:883-7.
26. Narita T, Sasaki H, Hosoba M, Miura T, Yoshioka N, Morii T, Shimotomai T, Koshimura J, Fujita H, Kakei M, Ito S. Parallel increase in urinary excretion rates of immunoglobulin G, ce- ruloplasmin, transferrin, and orosomucoid in normoalbumin- uric type 2 diabetic patients. Diabetes Care 2004;27:1176-81.
27. Williams ME. Diabetic nephropathy: the proteinuria hypothe-
sis. Am J Nephrol 2005;25:77-94.
28. Kramer HJ, Nguyen QD, Curhan G, Hsu CY. Renal insufficien- cy in the absence of albuminuria and retinopathy among adults with type 2 diabetes mellitus. JAMA 2003;289:3273-7.
29. Retnakaran R, Cull CA, Thorne KI, Adler AI, Holman RR; UK- PDS Study Group. Risk factors for renal dysfunction in type 2 diabetes: U.K. Prospective Diabetes Study 74. Diabetes 2006;
55:1832-9.