DOI:10.4078/jkra.2010.17.4.368
<접수일:2010년 8월 2일, 수정일:2010년 9월 1일, 심사통과일:2010년 9월 24일>
※통신저자:전 재 범
서울시 성동구 행당동 산 17번지
한양대학교 의과대학 류마티스병원 내과학교실
Tel:02) 2290-9244, Fax:02) 2298-8231, E-mail:[email protected]
한국에서 흔한 주류의 퓨린 농도
한양대학교 의과대학 류마티스병원 내과학교실1, 한양대학교 류마티즘연구소2, 한양대학교 의과대학 약리학교실3
전재범
1ㆍ나영인
2ㆍ김현진
3ㆍ김신희
3ㆍ박유신
3ㆍ강주섭
3= Abstract =
Measurement of Purine Contents in Korean Alcoholic Beverages
Jae-Bum Jun1, Young-In Na2, Hyun-Jin Kim3, Shin-Hee Kim3, Yoo-Sin Park3, Juseop Kang3
Department of Internal Medicine, Hanyang University Hospital for Rheumatic Diseases
1, Institute of Rheumatism, Hanyang University
2, Department of Pharmacology &
Clinical Pharmacology Lab, College of Medicine, Hanyang University
3, Seoul, Korea
Objective: Gout is one of the most common forms of inflammatory arthritides among men, which is caused primarily by chronic hyperuricemia. Although pharmacological therapy is the mainstay treatment to manage gout, limiting the consumption of dietary purine is also important.
Several epidemiological studies have reported that alcohol consumption is closely related to hyperuricemia and gout. The objective of this study was to determine the purine content in common Korean alcoholic beverages using high performance liquid chromatography (HPLC) to provide a dietary guideline for those with hyperuricemia or gout.
Methods: Thirty-five alcoholic beverages were analyzed. Blindly labeled samples of each alcoholic beverage were degassed and frozen. The sample preparation prior to HPLC followed the methods of Japanese researchers. HPLC was performed to analyze adenine, guanine, hypoxanthine, and xanthine content in the alcoholic beverages.
Results: The standard curves were linear for all purines. Purine contents were as follows:
beer (42.26∼146.39 μmol/L, n=12), medicinal wine (8.2 and 40.41 μmol/L, n=2), rice wine (13.19 μmol/L), Makgeolri (11.71 and 24.72 μmol/L, n=2), red wine (0, 6.03, and 17.9 μmol/L, n=3). No purines were found in fruit wine (n=2), Kaoliang (n=1), white wine (n=1), or distilled alcoholic beverages, such as soju (n=10) or whiskey (n=1).
Conclusion: Among popular Korean alcoholic beverages, beer contained a considerable amount of purines, whereas distilled alcoholic beverages did not. Patients with either gout or hyperuricemia should avoid alcoholic beverages, especially those containing large amounts of purines.
Key Words: Gout, Purine, Alcohol, HPLC
서 론
통풍은 장기간의 고요산혈증 후에 monosodium urate 결정이 관절 또는 주위 조직에 침착함으로써 발생하 는 흔한 관절염이다 (1). 역학적 연구에 의하면, 통 풍의 유병률이 증가하고 있으며, 식이와 생활습관의 변화, 그리고 수명의 연장이 원인으로 거론된다 (2).
오늘날 통풍은 모든 전신 류마티스 질환 중에서 가 장 잘 이해되고 치료될 수 있는 질병인데 (3) 그럼 에도 불구하고 통풍에 대한 관리는 부적절한 경우가 많다 (4). 따라서 환자에 대한 교육이 중요한데, 특히 식이와 관련한 요소로서 체중감량, 술과 붉은 고기 (red meat), 해산물, 그리고 과당(fructose)함유 음료수 를 줄이는 것이 중요하다 (5). 특히 알코올의 섭취가 고요산혈증과 통풍의 발생과 연관이 깊다는 것은 오 래 전부터 알려져 왔으며 (6,7) 최근 잘 밝혀지고 있 다 (8). 알코올 섭취가 많은 사람은 그렇지 않은 사 람에 비해 통풍의 발생률이 높았으며, 알코올 음료 중 에서는 맥주의 영향이 가장 컸다. 최근 Kaneco 등은 일 본에서 유통되는 알코올 음료에서 high performance liquid chromatography (HPLC)를 이용하여 퓨린의 양 을 측정하여 발표한 바 있다 (9). 본 연구에서는 국 내에서 유통되는 대표적인 알코올 음료에서 같은 방법 을 이용하여 퓨린, 즉 adenine, guanine, hypoxanthine, 그리고 xanthine의 양을 측정하여 통풍 환자의 식이 요법에 도움을 주고자 하였다.
대상 및 방법 1. 알코올 음료 및 전처리
국내에서 많이 유통되는 알코올성 음료를 대형마 트에서 구입하였다. 알코올성 음료에는 맥주 12종(국 내산 5종, 수입산 7종), 소주 10종, 약주 2종, 막걸리 2종, 과실주 2종, 정종 1종, 와인 4종(레드와인 3종,
와이트와인 1종), 고량주 1종, 양주 1종이 포함되었다.
탈기된(degassed) 알코올성 음료 20 mL를 50 mL 원추관(cornical tube)에 넣어 동결건조(freeze drying) 시켰다. 잔류물에 70% HClO4를 28 mL을 넣어 녹였다.
이 용액을 100 mL 배지병(media bottle)에 옮기고 섭씨 90∼100도에서 1시간 가열한 후 1시간 가량 방냉 (coldness release)하였다. 그 후 30% KOH 60∼65 mL (pH 7.0)를 넣어 중화시키고 중화된 시료는 증류수를 사용하여 최종 100 mL가 되게 만들었다. 3,000 rpm 으로 10분간 원심분리 한 후 상층액을 취하여 0.2 μm 의 필터로 여과한 뒤 이 중 10 μL를 취하여 HPLC에 주입한 후 분석하였다.
2. HPLC 조건
퓨린 분석을 위한 HPLC의 기기와 각종 시약, 이 동상(mobile phase)의 시약 및 조건 등은 표 1과 같 다 (9,10).
결 과 1. 퓨린염에 대한 HPLC
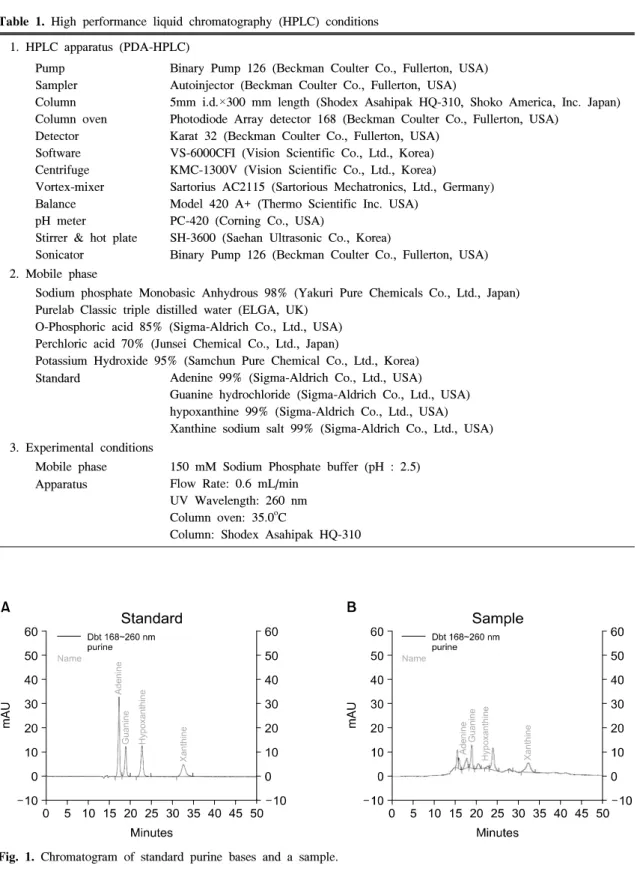
퓨린염인 adenine, guanine, hypoxanthine, 그리고 xan- thine은 HPLC로 잘 구분되었다(그림 1). 정량은 외적 표준법을 사용하였으며 주입한 퓨린의 양과 크로마 토그램의 피크면적은 좋은 연관성을 보였다(표 2). 표 준곡선(standard curve)은 adenine (mean r2=0.9999, CV=
1.89%, n=3), guanine (mean r2=0.9999, CV=1.68%, n=
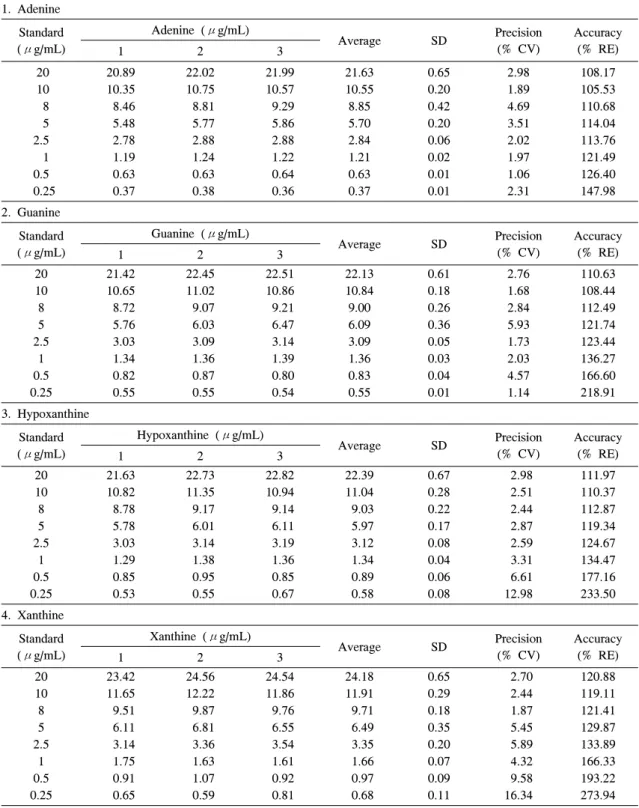
3), hypoxanthine (mean r2=0.9999, CV=2.25%, n=3), xan- thine (mean r2=0.9999, CV=2.44%, n=3)으로 양호한 직선형태를 보였다(그림 2). 정밀도(precision)와 정확도 (accuracy)는 0.25, 0.5, 1.0, 2.5, 5.0, 8.0, 10.0, 20.0 μg/mL의 알려진 양의 퓨린염을 투입하고 3차례 측정 하여 구하였다. 정밀도는 표준편차와 평균농도의 비 에서 백분율 변이계수(percentage coefficients of varia- tion, %CV)를 계산하여 결정하였고, 정확도는 측정된
Fig. 1. Chromatogram of standard purine bases and a sample.
Table 1. High performance liquid chromatography (HPLC) conditions 1. HPLC apparatus (PDA-HPLC)
Pump Binary Pump 126 (Beckman Coulter Co., Fullerton, USA) Sampler Autoinjector (Beckman Coulter Co., Fullerton, USA)
Column 5mm i.d.×300 mm length (Shodex Asahipak HQ-310, Shoko America, Inc. Japan) Column oven Photodiode Array detector 168 (Beckman Coulter Co., Fullerton, USA)
Detector Karat 32 (Beckman Coulter Co., Fullerton, USA) Software VS-6000CFI (Vision Scientific Co., Ltd., Korea) Centrifuge KMC-1300V (Vision Scientific Co., Ltd., Korea)
Vortex-mixer Sartorius AC2115 (Sartorious Mechatronics, Ltd., Germany) Balance Model 420 A+ (Thermo Scientific Inc. USA)
pH meter PC-420 (Corning Co., USA)
Stirrer & hot plate SH-3600 (Saehan Ultrasonic Co., Korea)
Sonicator Binary Pump 126 (Beckman Coulter Co., Fullerton, USA) 2. Mobile phase
Sodium phosphate Monobasic Anhydrous 98% (Yakuri Pure Chemicals Co., Ltd., Japan) Purelab Classic triple distilled water (ELGA, UK)
O-Phosphoric acid 85% (Sigma-Aldrich Co., Ltd., USA) Perchloric acid 70% (Junsei Chemical Co., Ltd., Japan)
Potassium Hydroxide 95% (Samchun Pure Chemical Co., Ltd., Korea) Standard Adenine 99% (Sigma-Aldrich Co., Ltd., USA)
Guanine hydrochloride (Sigma-Aldrich Co., Ltd., USA) hypoxanthine 99% (Sigma-Aldrich Co., Ltd., USA) Xanthine sodium salt 99% (Sigma-Aldrich Co., Ltd., USA) 3. Experimental conditions
Mobile phase 150 mM Sodium Phosphate buffer (pH : 2.5) Apparatus Flow Rate: 0.6 mL/min
UV Wavelength: 260 nm Column oven: 35.0oC
Column: Shodex Asahipak HQ-310
Table 2. Accuracy and precision of the purine base standards 1. Adenine
Standard (μg/mL)
Adenine (μg/mL)
Average SD Precision (% CV)
Accuracy (% RE)
1 2 3
20 20.89 22.02 21.99 21.63 0.65 2.98 108.17
10 10.35 10.75 10.57 10.55 0.20 1.89 105.53
8 8.46 8.81 9.29 8.85 0.42 4.69 110.68
5 5.48 5.77 5.86 5.70 0.20 3.51 114.04
2.5 2.78 2.88 2.88 2.84 0.06 2.02 113.76
1 1.19 1.24 1.22 1.21 0.02 1.97 121.49
0.5 0.63 0.63 0.64 0.63 0.01 1.06 126.40
0.25 0.37 0.38 0.36 0.37 0.01 2.31 147.98
2. Guanine Standard (μg/mL)
Guanine (μg/mL)
Average SD Precision (% CV)
Accuracy (% RE)
1 2 3
20 21.42 22.45 22.51 22.13 0.61 2.76 110.63
10 10.65 11.02 10.86 10.84 0.18 1.68 108.44
8 8.72 9.07 9.21 9.00 0.26 2.84 112.49
5 5.76 6.03 6.47 6.09 0.36 5.93 121.74
2.5 3.03 3.09 3.14 3.09 0.05 1.73 123.44
1 1.34 1.36 1.39 1.36 0.03 2.03 136.27
0.5 0.82 0.87 0.80 0.83 0.04 4.57 166.60
0.25 0.55 0.55 0.54 0.55 0.01 1.14 218.91
3. Hypoxanthine Standard (μg/mL)
Hypoxanthine (μg/mL)
Average SD Precision (% CV)
Accuracy (% RE)
1 2 3
20 21.63 22.73 22.82 22.39 0.67 2.98 111.97
10 10.82 11.35 10.94 11.04 0.28 2.51 110.37
8 8.78 9.17 9.14 9.03 0.22 2.44 112.87
5 5.78 6.01 6.11 5.97 0.17 2.87 119.34
2.5 3.03 3.14 3.19 3.12 0.08 2.59 124.67
1 1.29 1.38 1.36 1.34 0.04 3.31 134.47
0.5 0.85 0.95 0.85 0.89 0.06 6.61 177.16
0.25 0.53 0.55 0.67 0.58 0.08 12.98 233.50
4. Xanthine Standard (μg/mL)
Xanthine (μg/mL)
Average SD Precision (% CV)
Accuracy (% RE)
1 2 3
20 23.42 24.56 24.54 24.18 0.65 2.70 120.88
10 11.65 12.22 11.86 11.91 0.29 2.44 119.11
8 9.51 9.87 9.76 9.71 0.18 1.87 121.41
5 6.11 6.81 6.55 6.49 0.35 5.45 129.87
2.5 3.14 3.36 3.54 3.35 0.20 5.89 133.89
1 1.75 1.63 1.61 1.66 0.07 4.32 166.33
0.5 0.91 1.07 0.92 0.97 0.09 9.58 193.22
0.25 0.65 0.59 0.81 0.68 0.11 16.34 273.94
SD, standard deviation; CV, coefficients of variation; RE, relative error
Fig. 2. Standard curves for for purine bases. (A) Adenine, (B) Guanine, (C) Hypoxanthine, (D) Xanthine.
농도와 예측된 농도 사이의 차이에서 백분율 상대오 차(percentage relative error, %RE)를 계산하여 결정하 였다. 정밀도와 정확도의 결과는 표 2와 같았다.
2. 한국에서 흔히 유통되는 알코올 음료에서 퓨린 염의 측정
한국에서 흔히 유통되고 소비되는 알코올 음료에서 adenine, guanine, hypoxanthine, xanthine, 그리고 퓨린 의 총량은 표 3과 같다.
이미 알려진 바와 같이 맥주에서 전체적으로 다른 알코올음료와 비교하여 퓨린의 양이 높게 나타났다 (42.26∼146.39 μmol/L, n=12). 몇몇 외국브랜드의 전체 퓨린의 양이 높게 나타났지만 국내브랜드와 외 국브랜드 간의 퓨린의 총량에는 통계적 차이는 없었
다(평균±표준편자; 국내 77.6±22.1 μmol/L, 외국 78.3±
39.4 μmol/L, p=0.9748). 맥주 내에서 퓨린의 총량과 알코올 도수간에도 유의한 연관성은 보이지 않았다.
소주는 다양한 브랜드의 여러 알코올 도수의 것을 조사하였으나 증류주로써 브랜드에 따라 다양한 첨 가물이 있었음에도 불구하고 10종 모두에서 퓨린이 검출되지 않았다. 우리나라의 전통주인 약주에서는 차이는 있지만 소량의 퓨린만이 검출되었다(8.2 and 40.41 μmol/L, n=2). 최근 선풍적인 인기를 끌고 있는 막걸리에서도 소량의 퓨린이 검출되었다(11.71 and 24.72 μmol/L, n=2). 와인은 3종의 레드와인과 1종 의 와이트와인을 조사하였는데 2종의 레드와인에서 는 소량의 퓨린이 검출되었고(6.03 and 17.9 μmol/L) 나머지에서는 검출되지 않았다. 소위 양주로 불리는
Table 3. Purine contents (μmol/L) of common Korean alcoholic beverages
Cate-
gory No. AdenineGuanine Hypo- xanthine
Xan- thine Total Beer Local 1 11.25 26.44 3.09 31.99 72.77
Local 2 11.03 29.53 2.2 38.43 81.19 Local 3 13.32 31.24 6.39 45.09 96.04 Local 4 10.43 12.53 0 19.3 42.26 Local 5 15.84 48.94 3.01 28.03 95.82 Imported 6 19.76 85.67 13.96 27 146.39 Imported 7 10.51 20.74 2.35 10.05 43.65 Imported 8 16.87 30.6 2.28 12.12 61.87 Imported 9 10.29 16.1 2.64 20.28 49.31 Imported 10 29.16 58 4.11 28.32 119.59 Imported 11 16.87 26.33 4.56 25.85 73.61 Imported 12 9.77 10.71 3.09 29.75 53.32
Soju 1 0 0 0 0 0
2 0 0 0 0 0
3 0 0 0 0 0
4 0 0 0 0 0
5 0 0 0 0 0
6 0 0 0 0 0
7 0 0 0 0 0
8 0 0 0 0 0
9 0 0 0 0 0
10 0 0 0 0 0
Medicinal wine
1 0 2.03 6.17 0 8.2
2 3.4 12.9 7.57 16.54 40.41 Makgeolri 1 6.96 13.06 4.7 0 24.72 2 1.85 1.92 2.2 5.74 11.71
Fruit wine 1 0 0 0 0 0
2 0 0 0 0 0
Kaoliang 0 0 0 0 0
Whisky 0 0 0 0 0
Wine Red 1 0 0 0 6.03 6.03
Red 2 0 0 0 0 0
Red 3 2.29 4.58 0 11.03 17.9
White 4 0 0 0 0 0
Rice wine 2.07 2.67 8.45 0 13.19
위스키와 중국의 전통주인 고량주에서도 퓨린은 검 출되지 않았다. 제품별로 로트(lot)의 차이를 검사하 지는 않았다.
고 찰
알코올의 섭취는 고요산혈증이나 통풍과 밀접히 연
관되어 있다 (6-8). 알코올의 영향은 몇 가지로 구분 하여 생각해 볼 수 있다. 첫째로 알코올은 혈중 요 산을 증가시킨다. 알코올은 adenine nucleotide의 분해를 향상시켜서 요산의 생산을 증가시키고 (11-13), 젖산 (lactic acid)의 혈중농도를 증가시켜 요산의 신장배설 을 억제하게 된다 (7). 따라서 알코올의 과도한 섭취 는 혈중 요산의 증가를 가져오고 이로 인해 알코올의 섭취가 통풍 발생에 중요한 역할을 할 것이라는 것 은 오래 전부터 잘 알려져 왔다 (6,7). 둘째로 알코 올은 결정유발성 염증의 과정에도 관여한다. 통풍 환 자들은 급성 발작을 음주를 하는 동안보다는 대체로 음주 후 수면 중 이른 아침에 경험하게 된다. 이유 로는 음주로 인한 혈중 요산의 증가가 급성 관절염 을 일으키기에 충분하지 않거나 섭취한 알코올이 중 추신경계의 감각영역에 영향을 주어 통증감각을 저 하시켰거나 알코올이 시토카인의 조절을 통해 요산 결정에 의한 염증을 억제하였을 가능성이 있다 (14).
실제로 에탄올은 면역계를 저하시켜서 감염에 대한 소인을 증가시키며 (15), 여러 가지 면역세포의 면역 반응을 저하시키는 것이 알려져 있다 (16). 한편 Inokuchi 등에 의하면, 에탄올은 MAPK와 NF-κB를 포함한 과 정을 통해 monosodium urate 결정에 의한 염증성 시 토카인의 분비를 억제하는 것으로 밝혀졌다 (14). 마 지막으로 다양한 주류에 함유된 비알코올 성분(nonal- coholic component)에 의해 알코올은 통풍에 영향을 끼 칠 수 있다. 비알코올 성분에서 주요한 후보자는 퓨 린성분인데, 맥주에는 많은 양의 퓨린이 포함되어 있는 것으로 잘 알려져 왔다 (17). 맥주에 포함되어 있는 퓨린에 의한 혈중 요산의 증가는 알코올 자체 에 의한 요산 증가 효과를 증가시키기에 충분할 것이 다 (18). 따라서 2002년 발표된 일본의 “고요산혈증 과 통풍의 관리를 위한 지침준비위원회”와 2006년 유럽류마티스학회에서 발표된 통풍치료의 증거중심 권고안에도 알코올 음료, 특히 맥주를 제한할 것을 권 고하고 있다 (5,19). 알코올 중에서도 특히 맥주가 통 풍 발생에 크게 연관되어 있고 와인은 통계적 차이 를 보이지 않았다 (20). 이미 언급한 바와 같이 여기 에는 맥주에 포함된 퓨린이 큰 몫을 할 것으로 알려져 있다. 한편 와인에 포함되어 있는 비알코올 성분인 polyphenol은 항산화작용을 가지고 있으며 (21), 혈중 요산에 대한 알코올의 효과를 경감시키는 역할을 할
것으로 생각된다 (20).
본 연구에서는 우리나라에서 흔히 소비되고 있는 알코올성 음료에서 HPLC 방법을 이용하여 퓨린의 양 을 측정하였다. 그 동안 여러 가지 음식에 대한 퓨린의 양 측정은 생화학적으로 많이 시행되어 왔고 이 결 과가 통풍환자의 식생활 개선에 활용되어 왔다. 서 론에서 언급한 바와 같이 알코올의 섭취가 통풍 치 료에 중요한 부분이므로 최근 Kaneko 등에 의해 일 본에서 유통되고 있는 주류에 대한 퓨린의 양 측정 연구가 보고된 바 있어 (9) 본 연구에서는 한국에서 흔히 유통되고 있는 국, 내외 주류에 대해 HPLC법 을 이용하여 퓨린의 양을 측정하고 이 결과를 통풍 환자의 교육자료로 활용하고자 하였다.
본 연구의 결과를 보면, 전체적으로 맥주에서 퓨린 의 양이 많았고 증류주인 소주와 양주 등에서는 검 출되지 않았다. 와인과 기타 전통주인 약주나 막걸 리에서는 차이는 있으나 소량만이 검출되었다. 맥주 의 경우 Kaneko 등에 의한 결과와 비교해 볼 때 전 체적으로 본 연구에서의 결과가 낮게 나온 경향을 보이고 있다 (9). 그러나 대상이 달라서 차이가 있는 것인지 검사방법에 차이가 있어서 차이가 있는지는 알 수 없었다. 또한 본 연구에서 대상이 되었던 외 국브랜드의 맥주의 경우 실제 현지에서 수입된 것이 아니고 제조원이 국내로 표시된 것도 있으므로 결과 차이의 원인은 확인할 수 없었다.
Kaneko 등의 연구에서는 주류에 포함되어 있는 다 른 화합물에 의해 발생하는 영향을 평가하기 위해 새로운 최고점-이동(peak-shift)법을 적용하였으나 (9) 본 연구에서는 그 방법을 적용하지 않은 것이 결과 를 직접 비교하지 못하게 하는 하나의 제한점이 되 겠다. 시료의 전처리 후 크로마토그래피에서 최고점 (peak)들이 매우 복잡하여 찾고자 하는 최고점과 겹침 현상이 심할 때에는 용매와 조건(pH 등)을 변경하면 서 겹침현상을 제거하고자 하는 노력을 하여야 한 다. 그럼에도 불구하고 방해되는 최고점을 제거하기 곤란한 경우에는 효소처리를 통해 대사물질로 변경 하여 최고점을 이동(shift)함으로써 측정을 용이하게 하는 것이 최고점-이동법이다. Kaneco 등의 실험에서 도 guanine의 최고점이 다른 최고점과 겹침현상이 있어 guanase를 이용하여 guanine을 xanthine으로 대사 되게 하고 xanthine에서의 최고점 증가로 guanine의
함량을 산정하는 방법을 사용하였다 (9). 그러나 본 저자 등의 연구에서는 그림 1의 B에서와 같이 gua- nine의 최고점에 겹침현상이 없어 이 방법을 사용할 필요가 없었다.
결 론
한국에서 주로 유통되고 있는 주류에서 HPLC법을 이용하여 함유하고 있는 퓨린의 양을 측정하였다.
결과는 기존에 알고 있던 것과 같이 맥주에서 퓨린이 높게 측정되었고 증류주인 소주에서는 검출되지 않 았다. 전통주인 약주, 정종, 막걸리에서도 소량 검출 되었고 과실주, 양주, 고량주 등에서는 검출되지 않 았다. 본 연구의 결과는 통풍 환자의 교육자료로 활 용될 수 있을 것이다. 하지만 기존의 결과와 달리 국내에서 유통되는 맥주에서는 퓨린의 함량이 낮게 측정되었고, 국내에서 많이 유통되는 소주에서는 퓨 린이 전혀 측정되지 않아 오히려 통풍 환자들에게 퓨린의 함량이 낮으므로 이런 주류는 통풍에 나쁜 영향을 미치지 않을 것이라는 오해를 불러일으키지 않아야 할 것이다.
참고문헌
1) Richette P, Bardin T. Gout. Lancet 2010;375:318-28.
2) Saag KG, Choi H. Epidemiology, risk factors, and lifestyle modifications for gout. Arthritis Res Ther 2006;8(Suppl 1):S2.
3) Bieber JD, Terkeltaub RA. Gout: on the brink of novel therapeutic options for an ancient disease.
Arthritis Rheum 2004;50:2400-14.
4) Neogi T, Hunter DJ, Chaisson CE, Allensworth- Davies D, Zhang Y. Frequency and predictors of inappropriate management of recurrent gout attacks in a longitudinal study. J Rheumatol 2006;33:104-9.
5) Zhang W, Doherty M, Bardin T, Pascual E, Barskova V, Conaghan P, et al. EULAR evidence based reco- mmendations for gout. Part II: management. Report of a task force of the EULAR Standing Committee for International Clinical Studies Including Thera- peutics (ESCISIT). Ann Rheum Dis 2006;65:1312-24.
6) Lieber CS, Jones DP, Losowsky MS, Davidson CS.
Interrelation of uric acid and ethanol metabolism in man. J Clin Invest 1962;41:1863-70.
7) Lieber CS. Hyperuricemia induced by alcohol.
Arthritis Rheum 1965;8:786-98.
8) Choi HK, Atkinson K, Karlson EW, Willett W, Curhan G. Alcohol intake and risk of incident gout in men: a prospective study. Lancet 2004;363:
1277-81.
9) Kaneko K, Yamamobe T, Fujimori S. Determination of purine contents of alcoholic beverages using high performance liquid chromatography. Biomed Chro- matogr 2009;23:858-64.
10) Makkar HP, Becker K. Purine quantification in di- gesta from ruminants by spectrophotometric and HPLC methods. Br J Nutr 1999;81:107-12.
11) Puig JG, Fox IH. Ethanol-induced activation of ade- nine nucleotide turnover. Evidence for a role of ace- tate. J Clin Invest 1984;74:936-41.
12) Yamamoto T, Moriwaki Y, Takahashi S, Suda M, Hi- gashino K. Effect of ethanol ingestion on nucleotides and glycolytic intermediates in erythrocytes and pu- rine bases in plasma and urine: acetaldehydeinduced erythrocyte purine degradation. Metabolism 1993;42:
1212-6.
13) Yamamoto T, Moriwaki Y, Takahashi S. Effect of ethanol on metabolism of purine bases (hypoxanthine, xanthine, and uric acid). Clin Chim Acta 2005;356:
35-57.
14) Inokuchi T, Ka T, Yamamoto A, Moriwaki Y, Taka- hashi S, Tsutsumi Z, et al. Effect of ethanol on mono- sodium urate crystal-induced inflammation. Cytokine 2008;42:198-204.
15) Szabo G. Alcohol’s contribution to compromised immunity. Alcohol Health Res World 1997;21:30-41.
16) Arbabi S, Garcia I, Bauer GJ, Maier RV. Alcohol (ethanol) inhibits IL-8 and TNF: role of the p38 path- way. J Immunol 1999;162:7441-5.
17) Gibson T, Rodgers AV, Simmonds HA, Toseland P.
Beer drinking and its effect on uric acid. Br J Rheu- matol 1984;23:203-9.
18) Gibson T, Rodgers AV, Simmonds HA, Court-Brown F, Todd E, Meilton V. A controlled study of diet in patients with gout. Ann Rheum Dis 1983;42:123-7.
19) Committee for the Preparation of Guidelines for the Management of Hyperuricemia and Gout. Lifestyle Guidance. Guidelines for the Management of Hyperu- ricemia and Gout. Tokyo, Japanese Society of Gout and Nucleic Acid Metabolism, 2002.
20) Choi HK, Curhan G. Beer, liquor, and wine con- sumption and serum uric acid level: the Third Na- tional Health and Nutrition Examination Survey. Ar- thritis Rheum 2004;51:1023-9.
21) Maxwell S, Cruickshank A, Thorpe G. Red wine and antioxidant activity in serum. Lancet 1994;344:193-4.