Received:May 31, 2018, Revised:August 24, 2018, Accepted:September 18, 2018 Corresponding to:Hoon-Suk Cha http://orcid.org/0000-0001-5391-5376
Department of Medicine, Samsung Medical Center, Sungkyunkwan University School of Medicine, 81 Irwon-ro, Gangnam-gu, Seoul 06351, Korea. E-mail:hoonsuk.cha@samsung.com
Joong Kyong Ahn http://orcid.org/0000-0003-3246-4435
Department of Internal Medicine, Kangbuk Samsung Hospital, Sungkyunkwang University of School of Medicine, 29 Saemunan-ro, Jongno-gu, Seoul 03181, Korea. E-mail:mdahnjk@skku.edu
*These authors contributed equally to this work.
Copyright ⓒ 2019 by The Korean College of Rheumatology. All rights reserved.
This is a Open Access article, which permits unrestricted non-commerical use, distribution, and reproduction in any medium, provided the original work is properly cited.
Rheumatoid Factor Positivity is Associated with Lower Bone Mass in Korean Male Health Examinees without Clinically Apparent Arthritis
Jiwon Hwang1, Joong Kyong Ahn2,*, Jaejoon Lee3, Eun-Mi Koh3, Hoon-Suk Cha3,*
1Department of Internal Medicine, National Police Hospital, 2Department of Internal Medicine, Kangbuk Samsung Hospital, Sungkyunkwan University School of Medicine, 3Department of Medicine, Samsung Medical Center, Sungkyunkwan University School of Medicine, Seoul, Korea
Objective. This cross-sectional study aimed to investigate the association between rheumatoid factor (RF) positivity and bone mineral density (BMD) in male Korean subjects without any history of joint disease. Methods. Of 84,344 males who had under- gone a comprehensive health checkup program in 2012, 1,390 male health examinees were recruited, whose BMD and RF re- sults were available. A RF titer ≥20 IU/mL was considered positive. BMD was measured at lumbar spine (L1∼L4) or hip (femoral neck and total hip) by dual-energy X-ray absorptiometry. Results. The association between RF positivity and BMD was assessed by multiple linear regression analysis. The mean age was 52.7±10.9 years (range 19∼88 years), and RF was detected in 64 subjects (4.6%). Demographics and laboratory data were not different between RF-positive and -negative subjects except hepatitis B surface antigen (HBsAg), which was more frequently seen in RF-positive subjects (15.6% vs. 4.3%, p=0.001).
RF-positive subjects had significantly lower BMD compared to RF-negative subjects in lumbar spine but not in total hip regard- less of the existence of HBsAg (1.17±0.16 g/cm2 vs. 1.10±0.18 g/cm2, p=0.002 in total subjects; 1.17±0.16 g/cm2 vs.
1.10±0.18 g/cm2, p=0.004 in HBsAg-negative subjects). After adjusting for multiple confounders, RF positivity was negatively associated with lumbar spine BMD (B=−0.088 and standard error=0.035, p=0.011). Conclusion. Our results show that the presence of RF could have an unfavorable impact on bone density in apparently normal males. Additional studies to elucidate the osteoimmunological mechanism of rheumatoid factor are warranted. (J Rheum Dis 2019;26:31-40)
Key Words. Rheumatoid factor, Bone density, Male, Men’s health
INTRODUCTION
The close relationship between the immune and skeletal systems has been recognized, and is referred to as
‘osteoimmunology’ [1]. Its discovery was through ob- servation of bone loss in chronic inflammatory diseases such as rheumatoid arthritis (RA) and has led to major advances in showing the pathophysiological mechanisms of inflammation-driven bone loss [2]. At the same time, it was proposed that age-related osteoporosis is derived
from proinflammatory status of aging, which is called
“inflamm-aging” [3].
In RA, periarticular and systemic bone loss is observed very early in the disease course. Radiographic bone ero- sions were shown during the first two years of the dis- ease, and even as early as a few weeks into disease onset [4,5]. Cortical bone loss in the hand also developed very early in the disease process [6]. Osteoporosis and re- duced bone mineral density (BMD) were shown in about 25% of RA patients with symptom duration less than two
Figure 1. Selection of subjects.
BMD: bone mineral density, RF: rheumatoid factor.
years [7]. Positive autoimmunity, including rheumatoid factor (RF) and anti-cyclic citrullinated protein anti- bodies (ACPA), were known to be related to these lo- calized and systemic BMD changes [7,8], which would raise questions about the interplay between autoanti- bodies and bone cells. Several recent investigations have recently focused on potential mechanisms by which these autoantibodies trigger bone loss. Immune complexes, consisting of autoantibodies, can bind to Fc γ receptors (FcγR) on immune cells such as monocytes and macro- phages, and this induces the production of tumor ne- crosis factor-α, an osteoclastogenic cytokine that stim- ulate osteoclast development, which has been correlated with the amount of RF [9]. There are also emerging evi- dences that osteoclasts and their precursors can be di- rectly activated by autoantibodies [10,11]. Although these findings were driven from inflammatory diseases such as RA, we might infer a certain linkage between RF and bone from this perspective.
RF was the first autoantibody known to be associated with RA, and is present in approximately 70%∼80% of RA patients. It is directed against the Fc fragment of im- munoglobulin (Ig)G, with the main isotype being IgM class, but IgA and IgG classes are found as well. In spite of the low specificity, RF could help the diagnosis, and pre- dict the prognosis of RA, as RA-associated auto- antibodies. It is also found nonspecifically in other in- flammatory conditions such as sarcoidosis, hepatitis B and C infection, and tuberculosis. These false positive re- actions for RF are seen in the general population with a prevalence ranging from 1% to 5% [12,13]. Moreover,
levels of RF increase with age, even in healthy people [14].
With the advance of osteoimmunology, most pathophy- siologic concepts have been drawn from disease con- dition, even though bone remodeling is a dynamic proc- ess of any living bone. While higher-than-normal levels of RF are often seen in individuals without specific medical conditions, very few studies have investigated the influ- ence of RF on BMD. Therefore, we aimed to analyze the association between the presence of RF and reduced BMD in health examinees with no history of joint disease.
MATERIALS AND METHODS
Subjects
The study was undertaken as a cross-sectional design, and the population comprised males from a total of 148,417 subjects (age range 19∼88 years) who partici- pated in the health checkup program between January and December 2012 in one hospital in Seoul, South Korea. Over 80% of the participants and their spouses were employees of various companies and local gov- ernmental organizations, as the South Korean Industrial Safety and Health Law requires annual or biennial health screening of employees. The remaining participants vol- untarily purchased self-paid screening examinations at the health screening center. We excluded female subjects (n=64,073) in order to minimalize the estrogen effect on bone in females, including the accelerated bone loss with menopausal estrogen deficiency. Out of the male subjects (n=84,344), those who did not have BMD and RF test re- sults (n=52,158) were excluded. Subjects with diabetes
(n=3,764), kidney disease (n=3,028), thyroid disease (n=3,521), and malignancy (n=935), or who were taking medicine for these conditions (n=113) were excluded.
Subjects treated for osteoporosis (n=13), and those tak- ing calcium and vitamin supplementation (n=19,369) or steroid (n=53) were also excluded. No subjects were tak- ing disease-modifying antirheumatic drugs. This meant the analysis was performed on 1,390 male subjects with BMD and RF results available (Figure 1). Ethical approval was obtained from the Institutional Review Board of Kangbuk Samsung Hospital for patient recruitment and analysis of data (IRB no. KBSMC 2015-12-044). The Institutional Review Board exempted the requirement for informed consent for this study because a de-identified database was used to analyze data retrospectively. The study was conducted in accordance with the ethical prin- ciples of the Declaration of Helsinki.
Measurements
All subjects responded to a self-reported questionnaire from which the following information was obtained: age (years), smoking status (current smoker, ex-smoker, or never smoked) with the quantity (pack-years), alcohol consumption (grams per week), physical activity (time spent in vigorous exercise per week), medical history, and use of prescription drug and dietary supplements. Height (m) was measured to the nearest 0.1 m using a stadi- ometer with bare feet. Body weight (kg) was measured to the nearest 0.1 kg on a bioimpedance analyzer (InBody 3.0 and Inbody 720; Biospace Co., Seoul, Korea) with light clothing and without shoes. Body mass index (BMI) was calculated as weight divided by height squared (kg/m2) and categorized into four groups; low (≤18.49 kg/m2), optimal (18.5 to 24.99 kg/m2), overweight (25.0 to 29.99 kg/m2), and obese (≥30.0 kg/m2).
Blood samples were taken uniformly in the morning from the antecubital vein of participants with at least 12 hours of fasting. Serum levels of the following substances were measured as described elsewhere [15,16]: glucose, aspartate aminotransferase, alanine aminotransferase (ALT), triglyceride, total cholesterol, low-density lip- oprotein-cholesterol, high density lipoprotein (HDL) cholesterol, uric acid, total calcium, phosphorus, crea- tinine, C-reactive protein (CRP), homocysteine, hepatitis B surface antigen (HBsAg) and antibody to hepatitis C vi- rus (HCV Ab). For assessing serum vitamin D status, to- tal vitamin D (25-OH) was measured with a competitive immunoassay using the Elecsys vitamin D (25-OH) total
assay on a Modular E170 immunoanalyzer (Roche, Basel, Switzerland). RF was measured by an immunoturbidi- metric assay using a Modular P800 (Roche Diagnostics, Basel, Switzerland). RF concentration ≥20 IU/mL was considered as positive. Estimated glomerular filtration rate (eGFR) was calculated from age, sex, and serum crea- tinine using the Chronic Kidney Disease Epidemiology Collaboration (CKD-EPI) equation [17].
BMD was measured at lumbar spine (L1∼L4) or hip (femoral neck and total hip) by dual-energy X-ray absorp- tiometry (DXA) using a GE Lunar Prodigy (Madison, WI, USA). DXA Results were expressed as grams per square centimeter (g/cm2) and T-score. For the lumbar spine BMD, the mean BMD of four segments of the lumbar spine was used (from 1st to 4th) while for hip BMD, the total hip BMD used instead of femoral neck BMD.
Osteoporosis was defined as a BMD 2.5 or more standard deviations (SD) below the sex-specific average value for young healthy adult (a T-score of < −2.5 SD), according to the World Health Organization classification criteria [18]. A T-score between −1.0 SD and −2.5 SD below the young adult mean was deemed osteopenia, and a T-score >
−1.0 was regarded as normal. Subjects were categorized into three groups according to the T-score: normal (T-score >−1), osteopenia (T-score ≤−1 and >−2.5), and osteoporosis (T-score ≤−2.5).
Statistical analyses
Categorical variables were presented as numbers and percentages, and continuous variables as means±SD or medians and interquartile ranges. The normality of dis- tribution was assessed with the Kolmogorov-Smirnov test for all variables. Characteristics were compared be- tween RF-positive and RF-negative groups. Differences across groups were tested using Chi-square test, Student’s t-test or ANOVA tests. Correlation coefficient r was measured to assess the relationship between two variables. As the relationship between RF and HBsAg positivity was significant despite of a weak correlation (r=0.100, p=0.004: Supplementary Table 1), HBsAg- positive subjects were excluded in the regression analysis. To determine the independent associations of RF positivity with BMD, a multiple regression analysis was carried out, in which lumbar BMD (L1∼L4) (g/cm2) served as the dependent variable and the presence of RF served as the independent variable. In the analysis, the following variables were adjusted: model 1 included age and BMI (kg/m2), model 2 additionally included alcohol
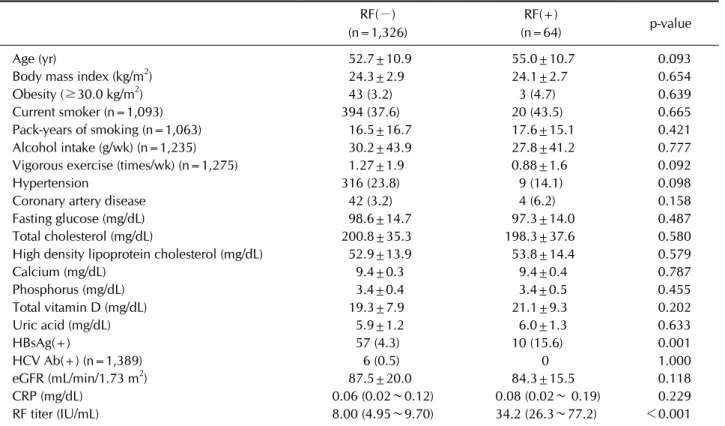
Table 1. General characteristics by RF positivity in men (n=1,390) RF(−) (n=1,326)
RF(+)
(n=64) p-value
Age (yr) 52.7±10.9 55.0±10.7 0.093
Body mass index (kg/m2) 24.3±2.9 24.1±2.7 0.654
Obesity (≥30.0 kg/m2) 43 (3.2) 3 (4.7) 0.639
Current smoker (n=1,093) 394 (37.6) 20 (43.5) 0.665
Pack-years of smoking (n=1,063) 16.5±16.7 17.6±15.1 0.421
Alcohol intake (g/wk) (n=1,235) 30.2±43.9 27.8±41.2 0.777
Vigorous exercise (times/wk) (n=1,275) 1.27±1.9 0.88±1.6 0.092
Hypertension 316 (23.8) 9 (14.1) 0.098
Coronary artery disease 42 (3.2) 4 (6.2) 0.158
Fasting glucose (mg/dL) 98.6±14.7 97.3±14.0 0.487
Total cholesterol (mg/dL) 200.8±35.3 198.3±37.6 0.580
High density lipoprotein cholesterol (mg/dL) 52.9±13.9 53.8±14.4 0.579
Calcium (mg/dL) 9.4±0.3 9.4±0.4 0.787
Phosphorus (mg/dL) 3.4±0.4 3.4±0.5 0.455
Total vitamin D (mg/dL) 19.3±7.9 21.1±9.3 0.202
Uric acid (mg/dL) 5.9±1.2 6.0±1.3 0.633
HBsAg(+) 57 (4.3) 10 (15.6) 0.001
HCV Ab(+) (n=1,389) 6 (0.5) 0 1.000
eGFR (mL/min/1.73 m2) 87.5±20.0 84.3±15.5 0.118
CRP (mg/dL) 0.06 (0.02∼0.12) 0.08 (0.02∼ 0.19) 0.229
RF titer (IU/mL) 8.00 (4.95∼9.70) 34.2 (26.3∼77.2) <0.001
Values are presented as mean±standard deviation, number of subjects with percentages or median (interquartile range). RF:
rheumatoid factor, HBsAg: hepatitis B virus surface antigen, HCV Ab: antibody against hepatitis C virus, eGFR: estimated glomerular filtration rate, CRP: C-reactive protein. p-values were determined by Chi-square test for categorical variables, and Student’s t-test or Mann-Whitney U-test which was for skewed continuous variables.
intake (g/week), history of hypertension, and history of coronary artery disease, and model 3 further included glu- cose, ALT, triglyceride, HDL cholesterol, serum concen- tration of calcium and phosphorus, uric acid, homo- cysteine, ferritin, total vitamin D, and eGFR. In the multi- ple regression, an enter method was used, meaning that all variables were entered simultaneous into the model.
For further analysis, subjects were divided into four groups by RF titer; <10.0 IU/mL, 10.0∼19.99 IU/mL, 20.0∼39.99 IU/mL, and ≥40 IU/mL and the mean of the lumbar spine BMD (L1∼L4) across four groups was com- pared using ANOVA test. All statistical analyses were performed using IBM SPSS Statistics 19.0 (IBM, Armonk, NY, USA), and a p-value less than 0.05 was considered statistically significant.
RESULTS
Characteristics of study subjects
The characteristics of the 1,390 male subject enrolled are shown in Table 1. Their mean age was 52.7±10.9
years (range 19∼88 years) and 64 were RF-positive (4.6%). Smoking history was available in 1,093 subjects (78.6%) and the proportion of current smoker was not different between the RF-negative and RF-positive groups. Drinking habits were documented in 1,235 sub- jects (88.8%), and the weekly alcohol intake did not differ between the two groups. Vigorous exercise (times/week) was more frequent in the RF-negative group, but the dif- ference was not statistical significant. Past medical his- tory and laboratory findings were comparable between the two groups. The positivity for HBsAg was sig- nificantly higher in the RF-positive group (15.6% vs.
4.3%, p=0.001) but not for HCV Ab. In this regard, fur- ther analyses were conducted in both ways, including and excluding HBsAg-positive subjects for the association of RF with BMD. The mean level of CRP was comparable (p=0.229). The presence of RF had no significant rela- tionship to aging (r=0.045, p=0.09).
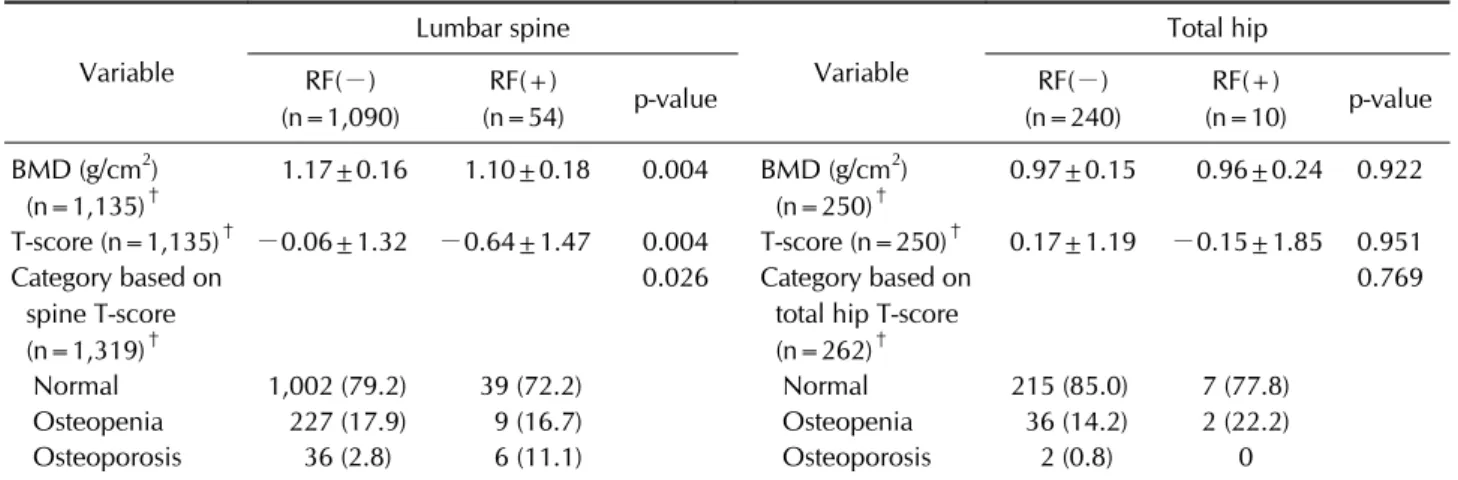
Table 3. Bone mineral density values in subjects without HBsAg*
Variable
Lumbar spine
Variable
Total hip RF(−)
(n=1,090)
RF(+)
(n=54) p-value RF(−)
(n=240)
RF(+)
(n=10) p-value BMD (g/cm2)
(n=1,135)†
1.17±0.16 1.10±0.18 0.004 BMD (g/cm2) (n=250)†
0.97±0.15 0.96±0.24 0.922
T-score (n=1,135)† −0.06±1.32 −0.64±1.47 0.004 T-score (n=250)† 0.17±1.19 −0.15±1.85 0.951 Category based on
spine T-score (n=1,319)†
0.026 Category based on total hip T-score (n=262)†
0.769
Normal 1,002 (79.2) 39 (72.2) Normal 215 (85.0) 7 (77.8)
Osteopenia 227 (17.9) 9 (16.7) Osteopenia 36 (14.2) 2 (22.2) Osteoporosis 36 (2.8) 6 (11.1) Osteoporosis 2 (0.8) 0
Values are presented asmean±standard deviation or number of subjects with percentages. RF: rheumatoid factor, HBsAg: hepatitis B surface antigen, BMD: bone mineral density. p-values were determined by Chi-square test for categorical variables, and Student’s t-test or Mann-Whitney U-test for skewed continuous variables. *This analysis was performed on HBsAg-negative subjects. †The discrepancy of the numbers was due to the missing values between the L1∼L4 BMD results and the category, and the category was determined by the lowest T-score.
Table 2. Bone mineral density values in total subjects Variable
Lumbar spine
Variable
Total hip RF(−)
(n=1,140)
RF(+)
(n=54) p-value RF(−)
(n=249)
RF(+)
(n=12) p-value BMD (g/cm2)
(n=1,194)*
1.17±0.16 1.10±0.18 0.002 BMD (g/cm2) (n=261)*
0.97±0.15 0.94±0.23 0.537
T-score (n=1,194)* −0.05±1.33 −0.64±1.52 0.009 T-score (n=261)* 0.17±1.19 −0.07±1.76 0.116 Category based on
spine T-score (n=1,386)*
<0.001 Category based on total hip T-score (n=307)*
0.683
Normal 1,043 (78.9) 47 (73.4) Normal 246 (83.4) 9 (75.0)
Osteopenia 241 (18.2) 9 (14.1) Osteopenia 47 (15.9) 3 (25.0) Osteoporosis 38 (2.9) 8 (12.5) Osteoporosis 2 (0.7) 0
Values are presented as mean±standard deviation or number of subjects with percentages. RF: rheumatoid factor, HBsAg: hepatitis B surface antigen, BMD: bone mineral density. *The discrepancy of the numbers was due to the missing values between the L1∼
L4 BMD results and the category, and the category was determined by the lowest T-score. p-values were determined by Chi-square test for categorical variables, and Student’s t-test or Mann-Whitney U-test for skewed continuous variables.
Distribution of BMD along the presence of RF and its levels
Tables 2 and 3 shows the mean BMD and the categories based on T-score according to RF positivity. In the lumbar spine, the mean BMD (L1∼L4) was significantly lower in the RF-positive group compared with RF-negative group (1.10±0.18 g/cm2 vs. 1.17±0.16 g/cm2, p=0.002), and the T-score based categories also differed between the RF-positive and RF-negative groups (p<0.001) includ- ing HBsAg-positive subjects (Table 2). However, in the total hip measurement, neither the mean BMD nor the
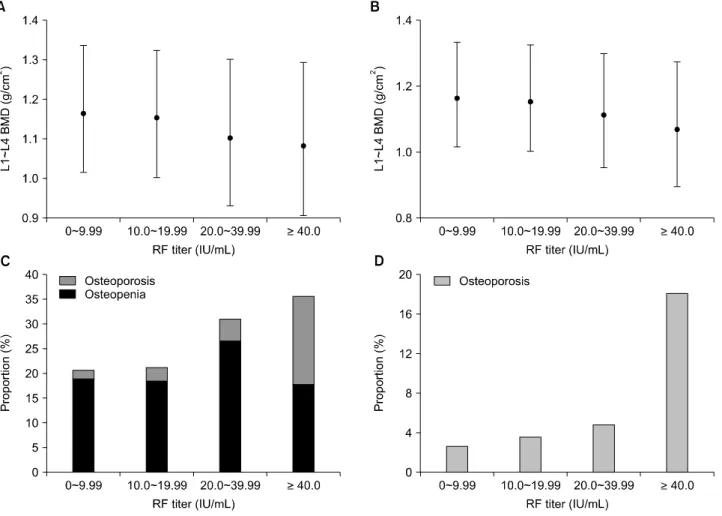
T-score based categories were different between the two groups. Excluding HBsAg-positive subjects, the similar trend of BMD values was shown that a significant differ- ence between the two groups existed only in the lumbar spine, not in the total hip (Table 3). In the lumbar spine, as the RF titer increased, which was grouped into four categories (<10 IU/mL, 10 to 19.99 IU/mL, 20 to 39.99 IU/mL, and ≥40 IU/mL), the mean BMD (L1∼L4) de- creased on one-way ANOVA testing (p=0.015 in total subjects and p=0.027 in HBsAg-negative subjects, re- spectively) (Figure 2A and 2C). Across the four groups,
Figure 2. Mean BMD and the proportion of low bone mass in lumbar spine along RF titers. (A) and (C) drawn for total subjects, and (B) and (D) for HBsAg-negative subjects. (A, B) RF titers were grouped into four categories, and each rhombus dot represents the mean estimated value (±95% CI) of lumbar BMD in the corresponding RF titer group. The imaginary connecting line between the dots demonstrates the decreasing tendency of BMD as the RF titers increase on one-way ANOVA testing (p=0.015 in A) and p=0.027 in B, respectively). (C, D) Each column represents the percentage of subjects with osteopenia (dark gray) and osteoporosis (light gray). Across the four groups, low bone mass frequency increases as RF titers increase (p for trend <0.001, both). BMD: bone mineral density, RF: rheumatoid factor, HBsAg: hepatitis B surface antigen, CI: confidence intervals.
the proportion of low bone mass of the lumbar spine in- creased as the RF titer increased (p for trend <0.001) (Figure 2B and 2D). On this account, further analysis for the association of RF positivity with BMD was performed only for the lumbar spine. Low bone mass (osteopenia and osteoporosis) of the lumbar spine was more preva- lent in subjects aged 50 or older, compared with those younger subjects (28.0% vs. 10.7%, p<0.001), while there were no differences in the femur neck and total hip measurements. Neither the lumbar spine BMD nor the RF titer showed significant correlation with age (r=−0.022, p=0.45 and r=0.033, p=0.22, respectively).
Association between BMD and RF positivity A sequential multiple regression analysis was employed
to investigate the association between RF positivity and BMD (Table 4). For the first step, age and BMI were en- tered into the model and the RF positivity showed a sig- nificant negative association with lumbar spine BMD (model 1). For the second step, alcohol intake (g/week), history of hypertension, and history of coronary artery disease, as lifestyle factors and comorbidities, were en- tered, and the regression equation was still significant (F(8, 814)=9.526, p<0.001), with R2 of 0.084 (model 2). Lastly, laboratory values were entered simultaneously, resulting in a significant increase in R2=0.147, F(18, 486)=4.662, p<0.001 (model 3), and the full model 3 demonstrated that the RF positivity could explain 14.7%
of the change of the lumbar spine BMD. The RF positivity was significantly negatively correlated with the lumbar
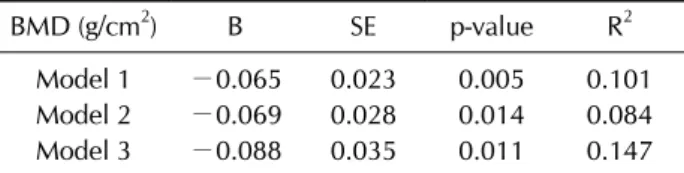
Table 4. Multiple linear regression analysis of the association between the RF positivity and lumbar spine BMD*
BMD (g/cm2) B SE p-value R2
Model 1 −0.065 0.023 0.005 0.101
Model 2 −0.069 0.028 0.014 0.084
Model 3 −0.088 0.035 0.011 0.147
Model 1: adjusted for age, body mass index. Model 2: as for Model 1 plus: alcohol intake (g/week), smoking (pack-years), history of hypertension, and history of coronary artery disease.
Model 3: as for Model 2 plus: fasting glucose, alanine aminotransferase, estimated glomerular filtration rate, uric acid, triglyceride, high density lipoprotein, homocysteine, ferritin, total vitamin D, and serum concentration of calcium and phosphorus. RF: rheumatoid factor, BMD: bone mineral density, B: unstandardized coefficient means the degree of change in lumbar spine BMD values (g/cm2) along the presence of RF, SE: standard error, R2: coefficient of multiple determination. *This analysis was performed on HBsAg-negative subjects.
spine BMD throughout the sequential models. Other than the RF positivity, BMI had a consistent positive asso- ciation with lumbar spine BMD (B=0.017, p<0.001 in model 1; B=0.015, p<0.001 in model 2; and B=0.015, p<
0.001 in model 3).
DISCUSSION
The significance of RF positivity with respect to bone health in subjects without arthritis has hardly been investigated. In this cross-sectional analysis of 1,390 male health examinees, RF-positive subjects had sig- nificantly lower BMD of the lumbar spine, and the pres- ence of RF was associated with lower BMD values in the lumbar spine after adjustment of potential confounding variables. This data provides epidemiological information that indicates RF positivity may have deleterious effects on bone metabolism in males, and might be clinically use- ful connotations in screening male osteoporosis in the general population.
RF is one type of RA-associated autoantibodies, which links to the Fc portion of IgG and forms immune com- plexes (ICs), contributing the autoimmune inflammatory response [19]. False positive reactions are found in 1% to 5% of the general population [20]. Some studies reported a higher incidence of RF seropositivity in elderly subjects [21]. Unlike these previous reports of a higher prevalence of RF with age, our results showed no difference in the mean age between RF-positive and RF-negative subjects.
The reason for this seems to be that only 4.4% of the study population was over age 70 years, and most were below age 60 years, whereas in the other studies the RF seropositivity was predominant in age 70 years or older [21]. Moreover, in our study, age had no significant corre- lation either with the BMD or the RF titer. Multiple re- gression analyses showed a significant negative associa- tion between the presence of RF and lumbar spine BMD.
Taken together, this study demonstrates that bone health in male subjects may be affected by the RF, rather than by age.
In subjects with HBsAg, the rate of RF positivity is esti- mated to be 12%∼20%, which is significantly higher than those without HBsAg [22-24]. A previous study sug- gested that HBV infection status should be considered when interpreting RF-positivity because of a strong asso- ciation with RF positivity [13]. The present study also demonstrated that the positivity for HBsAg was sig- nificantly higher in the RF-positive group, and a mean- ingful correlation was shown between RF and HBsAg positivity in correlation analysis. Furthermore, HBsAg se- ropositivity has been proposed to be a risk factor for lower BMD in male [25]. On that account, the present study conducted another set of analyses, excluding HBsAg-pos- itive subjects, which still indicated a significant associa- tion of RF positivity with BMD. This result could strengthen the genuine impact of RF on BMD, regardless of HBsAg seropositivity.
Direct evidence supporting RF as an independent risk factor for lower BMD in the general population is scarce.
Going back to the 1970s and 1980s, the effect on bone has been shown mainly in patients with RA, with bone ero- sions more common and extensive in RF-positive pa- tients [26,27]. After the discovery of ACPA, however, ACPA has been spotlighted rather than RF, because of the direct effect on bone by inducing osteoclast differ- entiation [11]. The RF ICs could also strongly enhance osteoclast differentiation via involving in their matura- tion process [10]. In autoimmune diseases, it is fre- quently observed that antibody production and IC for- mation are related to bone loss despite of insufficient un- derstanding how ICs directly regulate bone metabolism [28].
In osteoclastogenesis, the receptor activator of NF-kB li- gand (RANKL) is one of the key cytokines, along with macrophage colony-stimulating factor (M-CSF), and the activation of RANK also needs co-stimulatory signals in- cluding Fc receptor common γ subunit [29]. This γ sub-
unit is important for receptor signaling as it is the ac- cessory side chains of the FcγR, which recognizes IgG.
There are also activating and inhibitory FcγRs with dif- ferent affinities to the subclasses of IgG, and each subtype of IgGs binds the FcγRs with a certain activating-to-in- hibitory ratio [30]. Under pathologic condition such as autoimmune diseases related to hypergammaglo- bulinemia, IgG ICs induce osteoclastogenesis by re- sponding to the over-expressed activating FcγRs, with- out the counter effect by inhibitory receptors, while the activating FcγR signaling is counterbalanced by the in- hibitory receptors in physiologic conditions [28]. In this context, we suggest that the RF ICs could act via FcγRs along their affinities to IgG in those who do not have a condition related to RF, such as our study population. A recent investigation demonstrated that RFs derived from RA patients had similar properties as those derived from healthy donors in the structure and function, and there was no difference in mutation frequency [31]. This would strengthen the suggestion for the role for RF ICs in bone resorption not only in inflammatory diseases but in general.
The multiple regression analyses did not demonstrate a meaningful association between age and lumbar spine BMD. Even though the age at which bone loss starts in males is unknown, there is some evidence that the bone remodeling rate remains low in midlife, and the loss of trabecular continuity occurs later compared with females [32]. Current clinical practice guidelines recommend screening for osteoporosis in males over the age of 70 years [33]. As the study population was mostly under the age of 60 years (72.7%), the contribution of aging to low- ering of BMD may not be adequately reflected in the pres- ent study. However, the association of BMI with the lum- bar spine BMD was constant in a positive direction through models 1, 2, and 3. It is known that fat mass, and its regional distribution, can also affect BMD, although it is still controversial whether fat mass or lean mass has a greater influence on BMD. It has been observed in several studies that fat mass increased after age 74 years, and per- centage fat mass increased throughout the lifetime of males [34]. The BMIs of study subjects were mostly opti- mal (59.4%) or overweight (35.5%), and only 72 subjects (5.2%) were in the extreme ranges (low or obese BMI). In this respect, the result is consistent with previous stud- ies, that increased BMI was protective for BMD [35].
To our knowledge, this is the first study showing a neg- ative association between RF positivity and BMD in
healthy subjects. Nonetheless, potential limitations of the present study stem from its cross-sectional design and the questionnaire-based collection of medical history. The previous fracture history of the subjects, his- tory of osteoporosis in first-degree relatives, and the hor- monal status for assessing hypogonadism were all unavailable. The results only showed an association be- tween RF positivity and lumbar spine BMD, but as total hip BMD was assessed in just 261 subjects, this small number may restrict further analyses. In addition, the study was limited to Korean males, so caution is required in extrapolating our data to other ethnic groups and females. Further, larger longitudinal follow-up studies in- cluding measuring the BMD at other sites would provide more explicit information to verify the causal relationship between RF and BMD in the general population.
CONCLUSION
In conclusion, our study suggests that RF positivity in apparently healthy Korean male subjects was sig- nificantly associated with increased risk of lowered lum- bar spine BMD assessed by DXA. This data could have practical application in screening high risk males given the epidemiologic findings that men have higher mortal- ity and morbidity related to osteoporosis, despite a lower incidence of low bone mass compared to females. The os- teoimmunological mechanisms by which RF plays a role in bone remodeling of subjects without inflammation still warrants further study.
ACKNOWLEDGMENTS
We thank Mi-Yeon Lee for her excellent statistical assis- tance and Bryan Lee for his making and editing on scien- tific figures.
CONFLICT OF INTEREST
No potential conflict of interest relevant to this article was reported.
SUPPLEMENTARY DATA
Supplementary data can be found with this article online at https://doi.org/10.4078/jrd.2019.26.1.31.
REFERENCES
1. Pietschmann P, Mechtcheriakova D, Meshcheryakova A, Föger-Samwald U, Ellinger I. Immunology of osteoporosis:
a mini-review. Gerontology 2016;62:128-37.
2. Takayanagi H. Osteoimmunology: shared mechanisms and crosstalk between the immune and bone systems. Nat Rev Immunol 2007;7:292-304.
3. Franceschi C, Bonafè M, Valensin S, Olivieri F, De Luca M, Ottaviani E, et al. Inflamm-aging. An evolutionary per- spective on immunosenescence. Ann N Y Acad Sci 2000;908:244-54.
4. van der Heijde DM. Joint erosions and patients with early rheumatoid arthritis. Br J Rheumatol 1995;34 Suppl 2:74-8.
5. Machold KP, Stamm TA, Nell VP, Pflugbeil S, Aletaha D, Steiner G, et al. Very recent onset rheumatoid arthritis: clin- ical and serological patient characteristics associated with radiographic progression over the first years of disease.
Rheumatology (Oxford) 2007;46:342-9.
6. Pye SR, Adams JE, Ward KA, Bunn DK, Symmons DP, O'Neill TW. Disease activity and severity in early in- flammatory arthritis predict hand cortical bone loss.
Rheumatology (Oxford) 2010;49:1943-8.
7. Güler-Yüksel M, Bijsterbosch J, Goekoop-Ruiterman YP, de Vries-Bouwstra JK, Ronday HK, Peeters AJ, et al. Bone min- eral density in patients with recently diagnosed, active rheu- matoid arthritis. Ann Rheum Dis 2007;66:1508-12.
8. Bugatti S, Bogliolo L, Vitolo B, Manzo A, Montecucco C, Caporali R. Anti-citrullinated protein antibodies and high levels of rheumatoid factor are associated with systemic bone loss in patients with early untreated rheumatoid arthritis. Arthritis Res Ther 2016;18:226.
9. Mathsson L, Lampa J, Mullazehi M, Rönnelid J. Immune complexes from rheumatoid arthritis synovial fluid induce FcgammaRIIa dependent and rheumatoid factor correlated production of tumour necrosis factor-alpha by peripheral blood mononuclear cells. Arthritis Res Ther 2006;8:R64.
10. Seeling M, Hillenhoff U, David JP, Schett G, Tuckermann J, Lux A, et al. Inflammatory monocytes and Fcγ receptor IV on osteoclasts are critical for bone destruction during in- flammatory arthritis in mice. Proc Natl Acad Sci U S A 2013;110:10729-34.
11. Harre U, Georgess D, Bang H, Bozec A, Axmann R, Ossipova E, et al. Induction of osteoclastogenesis and bone loss by human autoantibodies against citrullinated vimentin.
J Clin Invest 2012;122:1791-802.
12. Johnson PM, Faulk WP. Rheumatoid factor: its nature, spe- cificity, and production in rheumatoid arthritis. Clin Immunol Immunopathol 1976;6:414-30.
13. Shim CN, Hwang JW, Lee J, Koh EM, Cha HS, Ahn JK.
Prevalence of rheumatoid factor and parameters associated with rheumatoid factor positivity in Korean health screen- ing subjects and subjects with hepatitis B surface antigen.
Mod Rheumatol 2012;22:885-91.
14. Shin YS, Choi JH, Nahm DH, Park HS, Cho JH, Suh CH.
Rheumatoid factor is a marker of disease severity in Korean rheumatoid arthritis. Yonsei Med J 2005;46:464-70.
15. Chang Y, Kim BK, Yun KE, Cho J, Zhang Y, Rampal S, et al.
Metabolically-healthy obesity and coronary artery calcification. J Am Coll Cardiol 2014;63:2679-86.
16. Zhang Y, Chang Y, Ryu S, Cho J, Lee WY, Rhee EJ, et al.
Thyroid hormones and mortality risk in euthyroid in- dividuals: the Kangbuk Samsung health study. J Clin Endocrinol Metab 2014;99:2467-76.
17. Levey AS, Stevens LA, Schmid CH, Zhang YL, Castro AF 3rd, Feldman HI, et al. A new equation to estimate glomer- ular filtration rate. Ann Intern Med 2009;150:604-12.
18. Kanis JA, Melton LJ 3rd, Christiansen C, Johnston CC, Khaltaev N. The diagnosis of osteoporosis. J Bone Miner Res 1994;9:1137-41.
19. Soltys AI, Axford JS, Sutton BJ. Rheumatoid factors: where are we now? Ann Rheum Dis 1997;56:285-6.
20. Hwang J, Song JU, Ahn JK. Decline of pulmonary function is associated with the presence of rheumatoid factor in Korean health screening subjects without clinically apparent lung disease: a cross-sectional study. Medicine (Baltimore) 2016;95:e3668.
21. Litwin SD, Singer JM. Studies of the incidence and sig- nificance of anti-gamma globulin factors in the aging.
Arthritis Rheum 1965;8:538-50.
22. Watanabe K, Ohkubo Y, Funahashi Y, Nishimaki T, Moritoh T, Kasukawa R, et al. An investigation on rheuma- toid factor of different immunoglobulin classes in hepatitis B virus carriers. Clin Rheumatol 1991;10:31-7.
23. Lee SI, Yoo WH, Yun HJ, Kim DS, Lee HS, Choi SI, et al.
Absence of antibody to cyclic citrullinated peptide in sera of non-arthritic patients with chronic hepatitis B virus infection. Clin Rheumatol 2007;26:1079-82.
24. Cacoub P, Saadoun D, Bourlière M, Khiri H, Martineau A, Benhamou Y, et al. Hepatitis B virus genotypes and extra- hepatic manifestations. J Hepatol 2005;43:764-70.
25. Baeg MK, Yoon SK, Ko SH, Han KD, Choi HJ, Bae SH, et al.
Males seropositive for hepatitis B surface antigen are at risk of lower bone mineral density: the 2008-2010 Korea National Health and Nutrition Examination Surveys.
Hepatol Int 2016;10:470-7.
26. el-Khoury GY, Larson RK, Kathol MH, Berbaum KS, Furst DE. Seronegative and seropositive rheumatoid arthritis: ra- diographic differences. Radiology 1988;168:517-20.
27. Masi AT, Maldonado-Cocco JA, Kaplan SB, Feigenbaum SL, Chandler RW. Prospective study of the early course of rheu- matoid arthritis in young adults: comparison of patients with and without rheumatoid factor positivity at entry and identification of variables correlating with outcome. Semin Arthritis Rheum 1976;4:299-326.
28. Negishi-Koga T, Gober HJ, Sumiya E, Komatsu N, Okamoto K, Sawa S, et al. Immune complexes regulate bone metabo- lism through FcRγ signalling. Nat Commun 2015;6:6637.
29. Mócsai A, Humphrey MB, Van Ziffle JA, Hu Y, Burghardt A, Spusta SC, et al. The immunomodulatory adapter proteins DAP12 and Fc receptor gamma-chain (FcRgamma) regulate development of functional osteoclasts through the Syk ty- rosine kinase. Proc Natl Acad Sci U S A 2004;101:6158-63.
30. Boruchov AM, Heller G, Veri MC, Bonvini E, Ravetch JV, Young JW. Activating and inhibitory IgG Fc receptors on hu- man DCs mediate opposing functions. J Clin Invest 2005;115:2914-23.
31. Falkenburg WJJ, von Richthofen HJ, Rispens T. On the ori- gin of rheumatoid factors: insights from analyses of variable region sequences. Semin Arthritis Rheum 2018 Jun 24 [Epub]. DOI: 10.1016/j.semarthrit.2018.06.006.
32. Seeman E, Bianchi G, Adami S, Kanis J, Khosla S, Orwoll E.
Osteoporosis in men--consensus is premature. Calcif Tissue Int 2004;75:120-2.
33. Qaseem A, Snow V, Shekelle P, Hopkins R Jr, Forciea MA, Owens DK. Screening for osteoporosis in men: a clinical practice guideline from the American College of Physicians.
Ann Intern Med 2008;148:680-4.
34. Rissanen A, Heliövaara M, Aromaa A. Overweight and an-
thropometric changes in adulthood: a prospective study of 17,000 Finns. Int J Obes 1988;12:391-401.
35. Jiang Y, Zhang Y, Jin M, Gu Z, Pei Y, Meng P. Aged-related changes in body composition and association between body composition with bone mass density by body mass index in Chinese Han men over 50-year-old. PLoS One 2015;10:
e0130400.
Supplementary Table 1. Correlation between variables of model 2 in multiple regression analysis for the association of RF positivity with the lumbar spine BMD VariableL1~L4 BMDAgeBMIAlcohol intake (g/wk)Smoking (pack-years)History of hypertension
History of coronary artery diseaseHBsAgRF L1~L4 BMD1.000 Age−0.023 (0.253)1.000 BMI 0.265 (<0.001)−0.058 (0.044)1.000 Alcohol intake (g/wk) 0.063 (0.031)−0.097 (0.002) 0.071 (0.019)1.000 Smoking (pack-years) 0.017 (0.313)0.279 (<0.001) 0.066 (0.027) 0.096 (0.002)1.000 History of hypertension 0.037 (0.142)0.319 (<0.001) 0.186 (<.001) 0.044 (0.100) 0.086 (0.006)1.000 History of coronary artery disease−0.002 (0.480)0.134 (<0.001) 0.011 (0.375) 0.009 (0.396) 0.065 (0.029) 0.131(<0.001)1.000 HBsAg 0.026 (0.223)−0.027 (0.212) 0.019 (0.293)−0.035 (0.152)−0.053 (0.061)−0.044 (0.099)0.034 (0.162)1.000 RF−0.078 (0.011) 0.037 (0.139)−0.033 (0.165)−0.001 (0.491) 0.020 (0.280)−0.025 (0.236)0.037 (0.142)0.101 (0.001)1.000 Values represent correlation coefficient (p-value). RF: rheumatoid factor, BMD: bone mineral density, BMI: body mass index, HBsAg: hepatitis B virus surface antigen.