Analysis of LIS Research in Korea
Kiduk Yang (양기덕)*
Jongwook Lee (이종욱)**
Wonchan Choi (최원찬)***
Contents 1. Introduction
2. Prior Research 3. Methodology
4. Findings
5. Discussions and Conclusions
ABSTRACT
Bibliometric analysis for research performance evaluation can generate erroneous assessments for various reasons. Application of the same evaluation metric to different domains, for instance, can produce unfair evaluation results, while analysis based on incomplete data can lead to incorrect conclusions.
This study examines bibliometric data of library and information science (LIS) research in Korea to investigate whether research performance should be evaluated in a uniform manner in multi-disciplinary fields such as LIS and how data incompleteness can affect the bibliometric assessment outcomes. The initial analysis of our study data, which consisted of 4,350 citations to 1,986 domestic papers published between 2001 and 2010 by 163 LIS faculty members in Korea, showed an anomalous citation pattern caused by data incompleteness, which was addressed via data projection based on past citation trends.
The subsequent analysis of augmented study data revealed ample evidence of bibliometric pattern differences across subject areas. In addition to highlighting the need for a subject-specific assessment of research performance, the study demonstrated the importance of rigorous analysis and careful interpretation of bibliometric data by identifying and compensating for deficiencies in the data source, examining per capita as well as overall statistics, and considering various facets of research in order to interpret what the numbers reflect rather than merely taking them at face value as quantitative measures of research performance.
Keywords: Bibliometrics, Subject-specific Analysis, Data Completeness, Publication Count, Citation Count, Library and Information Science
*
**
***
Professor, Department of Library and Information Science, Kyungpook National University, Daegu, Korea([email protected]) (First Author & Corresponding Author)
Doctoral Candidate, School of Information, Florida State University, Tallahassee, FL, USA ([email protected])
Postdoctoral Fellow, School of Business, Worcester Polytechnic Institute, Worcester, MA, USA ([email protected])
논문접수일자: 2015년 10월 22일 최초심사일자: 2015년 10월 22일 게재확정일자: 2015년 11월 3일 한국문헌정보학회지, 49(4): 241-264, 2015. [http://dx.doi.org/10.4275/KSLIS.2015.49.4.241]
1. Introduction
Bibliometric analysis for research performance evaluation can generate erroneous assessments for various reasons. As is true with any type of evaluation, the outcome of research evaluation can vary widely depending on the methods used (e.g., qualitative, quantitative), point of view (e.g., objective, subjective), evaluation criteria (e.g., productivity, impact), and sources of evidence (e.g., publication, citation). Consequently, the robust evaluation of research performance requires the proper inter- pretation of assessment outcomes as well as a rigorous examination of evaluation metrics. Evaluation errors can stem just as easily from misapplication of evaluation metrics as from faulty or incomplete evaluation data (Cronin 2005; Meho and Yang 2007; Yang and Lee 2012; 2013). One of the common yet obscure evaluation errors occurs when the same evaluation metric is applied to different domains. The problem becomes even more obscure when the research to evaluate falls in the domain that contains multiple subject areas with distinct characteristics.
Our study is motivated by the question of robustness, namely, whether research performance should be evaluated in a uniform manner across multi-disciplinary fields such as LIS (Saracevic 1999; Wu et al. 2012) and how data incompleteness can affect the bibliometric assessment outcomes.
Although prior studies have used citations to analyze the LIS research as a whole (Li et al.
2010; Norris and Oppenheim 2010), a multidisciplinary field such as LIS may possess enough differences in publication and citation patterns across subject areas, which warrants a subject-specific analysis. In such cases, application of the same evaluation metric across subject areas can produce unfair evaluation results. Furthermore, analysis based on incomplete data can produce invalid inferences leading to incorrect conclusions. Thus, the aim of the study is to highlight the importance of rigorous analysis and careful interpretation of bibliometric data by identifying and compensating for deficiencies in the data source, examining per capita as well as overall statistics, and considering various facets of research to interpret what the numbers reflect rather than merely taking them at face value as quantitative measures of research performance.
2. Prior Research
Bibliometrics has remained popular among researchers in evaluating scholarly work. For example, Adkins and Budd (2006) measured the research effectiveness of faculty by analyzing publication and citation data in Social Science Citation Index (SSCI) from 1999 to 2004. The authors ranked
the 20 most productive faculty members and programs by publication and citation counts, and provided a cumulative ranking for LIS programs based on publication and citation counts of programs, thus demonstrating the applicability of bibliometric indicators to the institution level as well as the researcher-level. Shaw and Vaughan (2008) analyzed the 2,086 publications of a randomly selected 90 LIS faculty members in order to characterize the academic life of typical LIS faculty. Specifically, the study examined the publications and citations of faculty members by faculty rank, types of publications, and types of schools. The key findings were: the publication counts correlated with faculty rank; the weight on conference papers decreased as faculty members were promoted; faculty members employed in institutions grating doctoral degrees were more productive than those in institutions offering a master’s degree or a joint doctoral degree; and full professors were cited more frequently than assistant or associate professors.
With respect to LIS research in South Korea, Yang and Lee (2012) analyzed 2,401 publications of Korean LIS faculty. In the study, the authors identified author characteristics, analyzed publication data by year, author, affiliation, and journal, and examined the research productivity based on various facets of publication data to highlight the increasing trend of collaboration, publications, and internationalization in the LIS field in Korea. In a follow-up study, Yang and Lee (2013) compared the LIS faculty rankings by publications, citations, and h- and g-index to show that while publication counts correlate with citation counts for productive authors, there is no correlation between publication and citation counts of authors with the small number of publications.
Some prior studies have pointed out different citation patterns across disciplines or sub-disciplines;
for example, Vieira and Gomes (2010) and Slyder et al. (2011) found different citation rates across disciplines. Specifically, Vieira and Gomes (2010) reported that while the discipline of Biology & Biochemistry was the most highly cited, Mathematics was the most poorly cited. Slyder et al. (2011) also showed different citation patterns between forestry and geography. In the LIS discipline, Meho and Yang (2007), who compared the coverage of WoS, Scopus and Google Scholar by analyzing citations to more than 1,400 works by 25 LIS faculty, found marked differences in citation counts across research areas. In addition, Blessinger and Hrycaj (2010) examined the subject areas of 32 highly cited LIS articles using five categories of Library Operations, Library/Information Science Profession, Publishing/Publishing Studies, Research in Librarianship/Users, and Technology, and they found that the most highly cited papers were related to the area of Research in Librarianship/
Users. Lee and Choi (2013) explored differences in publication and citation counts by subject areas even within LIS and found that the papers addressing bibliographic topics were less cited compared to the papers on foundations of LIS, management and administration, library and information
services, and information science.
3. Methodology
3.1 Study Data
The study data consisted of 4,350 citations to 1,986 domestic papers published by 165 tenure-track LIS faculty in Korea.1) International papers were excluded in order to filter out atypical citation patterns.2) The bibliographic data for new faculty members were gathered from the Korea Citation Index (KCI: http://www.kci.go.kr) managed by National Research Foundation (NRF) of Korea, and citation data for all faculty members were updated using KCI and NAVER.3)
3.2 Data Coding and Analysis
Two of the authors manually assigned a subject category to each of the publications under examination based on Park and Song’s (2013) classification scheme, which extended Oh’s (2005) scheme to synthesize both international and Korean subject classification schemes for categorizing Korean LIS research. Park and Song’s scheme enumerates 10 key subject areas of Foundations of LIS, Library Building & Facilities, Library Structure, Management and Administration, Library
& Information Services, Information Organization, Information Science, Bibliographic Studies, Publishing, and Record Management. The inter-coder reliability was Kappa=0.813 with p<.001, achieving the “almost perfectly agreed” reliability based on the rules of thumb by Landis and Koch (1977). Disagreements in the subject classification were resolved through discussions, and the reconciled result was used for the data analysis.
Before conducting trend and subject-specific analyses for the publication, citation, and author counts, we addressed the issue of data incompleteness via data projection based on past citation
1) In the study dataset, which updated Yang and Lee’s (2012) dataset with additional publication and citation data collected through May 2013, the number of faculty members increased from 159 to 165 due to 17 new faculty hires and 11 faculty retirements. Non-tenure track (e.g., lecturers) faculty members were excluded since they tend to publish sparsely and are likely to be data outliers.
2) A prior study by Lee and Yang (2011) found different citation patterns between domestic and international papers authored by Korean LIS faculty members.
3) KCI was searched initially to collect the publication data for each faculty member, after which Naver Scholar (http://academic.naver.com/) was queried for validation and identification of additional data.
trends. Then, we cross-tabulated the data by year and subject area to examine subject-specific trends. We also examined the data using two five-year time frames (i.e., 2001-2005 and 2006-2010) to better understand the changing patterns of research productivity (publication count), impact (citation count), and popularity (author count).
4. Findings
4.1 Temporal Trends in Publication, Citation, and Author Counts
We first examined the numbers of publications, citations, and authors to ascertain the overall pattern of Korean LIS research. The initial findings regarding this analysis have been reported in our prior studies (Lee and Choi 2013; Yang et al. submitted). The study data consisted of 4,350 citations to 1,986 domestic papers published by 163 authors.4) Figure 1, which plots the numbers of publications, citations, and authors (i.e., number of faculty members who had authored or co-authored at least one paper) by year, displays temporal changes in productivity and impact of domestic KLIS research. At first glance, the number of publications and the number of authors, each with a generally increasing pattern, suggest an increasing trend in research productivity, while the number of citations with a spike in the mid-period conveys a research impact pattern incongruent with productivity.
Decreasing citation counts in spite of increasing number of publications can reflect a decline in publication quality or change in citation patterns. Before jumping to conjectures about why such anomalies may occur, we thought it prudent to examine the data more carefully. When citation counts are broken down by the year in which they originate (Figure 2), two citation patterns emerge:
most citations (87%) occur after 2007,5) and most publications have the citation span of at least four years. However, Figure 2 shows publications in 2008 through 2010 to contain less than four years’ worth of citations, most likely due to the incomplete status of data source at the time of data collection. In fact, over 2.7 million references, most of which were in 2012, were added to
4) Before restricting the study data to domestic papers published by active tenure-track faculty, the overall data consisted of 5,709 citations to 2,232 unique papers published from 2001 to 2010 by 176 LIS faculty members. Two of 165 active faculty members did not publish any articles in domestic journals at the time of data collection.
5) Since citing papers published in later years will have more papers to cite, annual citation counts of later citing years will tend to be higher than earlier citing years. However, the drastic increase in citations starting in citing year 2008 (from 144 in 2007 to 648 in 2008, 962 in 2009, 999 in 2010, and 1168 in 2011) in the study data appears to be a change in citation pattern rather than the artifact of the timeframe.
the KCI database since the harvest of study data (Table 1). The dotted line in Figure 1 shows a projected citation counts based on the citation distribution of prior year data, which consist of about even numbers of citations over the four-year citation span. To be on the conservative side, we projected the missing years’ worth of citations by using the citation count of the prior year. The projected citation count of 722 for year 2008 is arrived at by adding 162 citations (2011 count) for 2012, the projected count of 821 for year 2009 is computed by adding 187 citations (2011 count) for each of 2012 and 2013, and 872 for 2010 by adding 205 citations three times to estimate the missing citation counts for the citing years 2012, 2013, and 2014. We counted the number of 2012 papers that cite 2008 articles in the 2014 KCI database to test the validity of the projected citation counts, and found it to be very close to the projected number (163 actual vs. 162 projected).
<Figure 1> Publication, citation & author counts by year
Careful examination of data as well as rigorous approach to analysis is vital to avoiding the common pitfall of quantitative analysis, which is arriving at erroneous conclusions from incomplete data or invalid interpretation of data. The general decrease in citation count after 2007 without the consideration of citation latency effect, for instance, may be mistakenly interpreted as a reflection of diminishing research impact, when the real culprits are the 4-year citation span revealed in citing year breakdown (Figure 2) and the 2-year lag in reference data inclusion by KCI (Table 1). The comparison of KCI data status between 2013 and 2014 in Table 1 exposes further weaknesses of KCI as a data source. Reduction of 4,786 authors for the pre-2009 period in 2014 KCI database implies duplicate counting or authority control problems in previous years, and
addition of 2,734,101 references between 2007 and 2012 in contrast to only 180 new papers for the same period suggests an incomplete data parsing practice that results in a de-facto reference data inclusion lag of several years.
<Figure 2> Annual citations by citing year
Papers Authors References
2013 2014 Δ 2013 2014 Δ 2013 2014 Δ
~2003 114,841 114,831 -10 306,324 305,661 -663 2,124 2,123 -1
2004 62,086 62,118 32 167,681 167,005 -676 1,003,426 1,003,425 -1 2005 66,488 66,505 17 179,743 178,899 -844 1,168,747 1,168,724 -23 2006 71,657 71,656 -1 195,836 194,783 -1,053 1,177,498 1,177,440 -58 2007 78,268 78,271 3 210,285 208,911 -1,374 1,446,758 1,456,233 9,475 2008 84,825 84,831 6 227,513 227,337 -176 1,862,179 1,864,266 2,087 2009 92,096 92,118 22 246,798 246,896 98 2,237,162 2,251,096 13,934 2010 96,514 96,544 30 257,650 257,750 100 2,392,245 2,402,207 9,962 2011 99,938 99,955 17 269,366 269,356 -10 2,578,584 2,582,602 4,018 2012 101,208 101,310 102 238,491 266,992 28,501 6,535 2,701,160 2,694,625 2013 33,992 100,874 67,822 74,547 232,302 157,755 1,368 4,224 2,856
2014 - 20,108 20,108 - 49,044 49,044 - 135 135
Total 900,913 989,121 88,208 2,374,234 2,604,936 230,272 13,876,626 16,613,635 2,737,009
* As posted in KCI website (https://www.kci.go.kr) on 2013/05/30 (data collection date) and 2014/04/06.
<Table 1> KCI data status: 2013 vs. 2014*
There are three dipping points in Figure 1 that data latency cannot adequately explain: citation count drop from 552 in 2005 to 524 in 2006, publication count drop from 269 in 2009 to 245 in 2010, and decrease in the number of authors from 104 in 2005 to 99 in 2006. The dip in author count in 2006 coincides with the new faculty hire counts, which decreased from 8 in 2005 to 1 in 2006. Table 2 shows new faculty hire count by year, which closely follows the changes in author count until 2009. The similarity in author and new faculty count patterns is not surprising since new faculty members increase the size of the author pool. It is not clear, however, why the author count decreased instead of staying more or less the same in 2006. One possible explanation is that the tendency of faculty members nearing retirement to publish less becomes more evident when not offset by the introduction of “new” authors. The tapering off of author count in 2009 may also be affected by the same tendency that gets exacerbated as the retirement year draws near. The publication count drop in 2010 is considered in a similar vein. We hypothesize that the sharp increase of publication count in 2009 (35 papers), followed by a large increase of tenured faculty count (15 professors) and a publication count drop (24 papers) in 2010, may reflect the
“finish line burst” of junior faculty members to publish more for tenure evaluation and the “post-finish pace” of newly tenured faculty to wind down the publication activities to a more leisurely pace.
2001 2002 2003 2004 2005 2006 2007 2008 2009 2010
aucnt1 79 88 90 98 104 99 102 115 114 111
newf2 2 4 7 9 8 1 4 7 9 9
oldf3 29 32 35 35 38 41 44 50 55 70
1 aucnt = number of unique authors (i.e., faculty who published)
2 newf = number of new faculty hires
3 oldf = estimated number of tenured faculty (regardless of publication)
<Table 2> Faculty counts by year
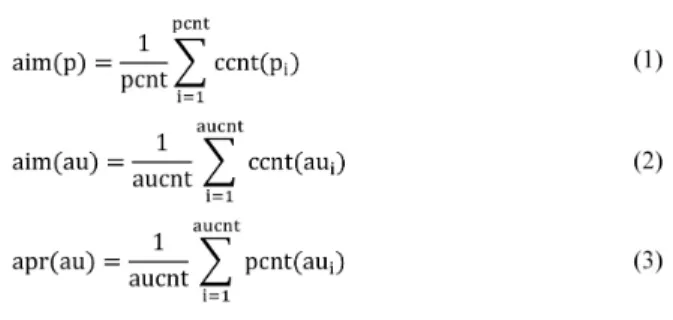
Examination of bibliometric counts by year revealed generally increasing trends in productivity and impact of KLIS research as a whole. To assess the productivity of an individual KLIS researcher or the average impact of a KLIS paper, we need to look at per capita statistics. When computing per capita statistics in bibliometrics, one must be careful in dealing with co-authorships. Specifically, the average impact of a paper should be computed using unique counts (i.e., number of unique citations), while the productivity and impact of an author must be estimated with duplicate counts (i.e., number of duplicate publications and citations) as formalized in the equations below. Equation 1 estimates the average impact of a paper, aim(p), by dividing the sum of the citations each paper receives, ccnt(pi), by the number of papers (pcnt). Equation 2, which averages the sum
of the citations each author receives to compute the average impact of an author, aim(au), counts the citations a paper receives as many times as the number of authors for that paper. Equation 3 computes the average productivity of an author, apr(au), in a similar manner by averaging the sum of the papers each author publishes, thus counting co-authored papers multiple times to arrive at the numerator.
Table 3 displays above three measures along with actual and projected counts. Author productivity, apr(au), shows an increase from 2.07 in 2005 to 2.34 in 2006 in contrast to the author count decrease in 2006, which is likely an effect of the single new faculty not diluting the average publication count rather than a reflection of the increased level of research productivity. The spike of apr(au) in 2009 and tapering off in 2010 correspond to the “finish-line burst” and “post-finish pace” pattern observed earlier. We should note that apr(au) represents the average productivity of authors who published, which, in conjunction with author count, is a much more informative measure than apr(au’) computed for all potential authors, which is simply a fractional publication count. Author impact, aim(au), computed as the mean citation count of authors who published, mimics the temporal pattern of publication impact, aim(p), albeit with a steeper slope (Figure 3). Since aim(au) approximates apr(au) times aim(p),6) it would be better to examine aim(p) than to wade through the compound effect in aim(au). The fact that aim(p) plot is almost a mirror image of apr(au) implies an inverse relationship between author productivity and publication quality, where the push to publish can adversely affect the quality of publication. For instance, the decrease of aim(p) from 3.09 in 2008 to 3.05 in 2009, along with the apr(au) increase from 2.37 to 2.73 in the same period, suggest that the “finish-line burst” effort was more about the quantity of publication than the quality. The aim(p) drop in 2006 may be attributed the fewer new faculty hires, whose first papers in their job are cited more than existing faculty publications (aim(pnewfac) of 3.74 vs. aim(p) of 2.19).
6) aim(au)=ccnt2/aucnt=(ccnt+ccntdup)/aucnt
aim(p)*apr(au)=(ccnt/pcnt)*(pcnt2/aucnt)=(ccnt/pcnt)*(pcnt+pcntdup)/aucnt=(ccnt+ pcntdup)/aucnt
<Figure 3> Per capita statistics by year
2001 2002 2003 2004 2005 2006 2007 2008 2009 2010 Total
pcnt1 127 149 158 193 196 199 216 234 269 245 1986
pcnt22 134 158 170 207 215 232 233 273 311 269 2202
ccnt3 310 302 323 414 552 524 661 560 447 257 4350
ccnt24 346 314 344 451 608 593 706 658 521 294 4835
aucnt5 79 88 90 98 104 99 102 115 114 111 163
ccntprj6
722 821 872 5501
ccnt2prj7
848 957 998 6165
apr(au)8 1.70 1.80 1.89 2.11 2.07 2.34 2.28 2.37 2.73 2.42 13.51
apr(au’)9 0.81 0.96 1.03 1.25 1.30 1.41 1.41 1.65 1.88 1.63 13.35
aim(au)10 4.38 3.57 3.82 4.60 5.85 5.99 6.92 5.72 4.57 2.65 29.66
aimprj(au)11 7.38 8.39 8.99 37.82
aim(p)12 2.44 2.03 2.04 2.15 2.82 2.63 3.06 2.39 1.66 1.05 2.19
aimprj(p)13 3.09 3.05 3.56 2.77
aim(pnewfac)14 2.00 6.00 3.50 3.44 6.00 4.00 5.33 4.17 1.20 1.80 3.74
1 pcnt = number of unique publications
2 pcnt2 = number of publications (1 count for each co-author)
3 ccnt = number of unique citations
4 ccnt2 = number of citations (duplicate counts for co-authors)
5 aucnt = number of unique authors (i.e., faculty who published)
6 ccntprj = projected number of unique citations
7 ccnt2prj = projected number of citations (duplicate counts for co-authors)
8 apr(au) = average productivity of an author (pcnt2/aucnt) for published authors
9 apr(au’) = average productivity of an author (pcnt2/aucnt’) for all authors (aucnt’=165)
10 aim(au) = average impact of an author (ccnt2/aucnt)
11 aimprj(au) = projected average impact of an author (ccnt2prj/aucnt)
12 aim(p) = average impact of a paper (ccnt/pcnt)
13 aimprj(p) = projected average impact of a paper (ccntprj/pcnt)
14 aim(pnewfac) = average impact of a paper published by new faculty hires
<Table 3> Publication, citation, author counts (total & per capita) by year
4.2 Popularity, Productivity, and Impact by Subject Areas 4.2.1 Popularity
As we reported in Yang et al. (submitted), Information Science was the most popular, as 74.2%
(121 out of 163) of faculty authors have published at least one paper (Figure 4). We also compared the unique number of authors (i.e., aucnt) and the average number of aucnt per year (i.e., avg_aucnt) between 2001-2005 and 2006-2010 (Table 4) along with the aucnt plotted by year (Figure 5).
In comparison with the first five-year periods, Library Structure had the largest increase (89%, 17 authors) in the number of authors (aucnt), followed by Record Management (85%, 11 authors), Library & Information Services (58%, 30 authors), and Foundations of LIS (47%, 22 authors).
Record Management and Foundations of LIS, however, show many fluctuations with rather flat slopes in the aucnt by year graph (Figure 5). In regards to the avg_aucnt, Library & Information Services and Library Structure doubled their author counts in the second five years, and Management and Administration had a 50% increase. The increases of avg_aucnt in Publishing and Library Building & Facilities were not meaningful due to their small sample sizes.
Subject aucnt1 avg_aucnt2
Areas ’01-’05 ’06-’10 Δ(%) ⌒ (%)3 All years ’01-’05 ’06-’10 Δ (%) All years
BIB 24 24 0 (0%) 21(78%) 27 15.2 15.6 0.4 (3%) 15.4
FND 47 69 22 (47%) 29(33%) 87 16.2 21.0 4.8 (30%) 18.6
INS 88 90 2(2%) 57(47%) 121 40.2 41.6 1.4(3%) 40.9
IOR 46 56 10(22%) 26(34%) 76 19.2 22.4 3.2(17%) 20.8
LBD 9 13 4(44%) 4(22%) 18 1.8 3.0 1.2(67%) 2.4
LST 19 36 17(89%) 5(10%) 50 5.0 10.8 5.8(116%) 7.9
LSV 52 82 30(58%) 34(34%) 100 16.4 34.4 18.0(110%) 25.4
MNG 47 64 17(36%) 28(34%) 83 16.0 24.0 8.0(50%) 20.0
PUB 1 1 0(0%) 0(0%) 2 0.2 0.4 0.2(100%) 0.3
RCM 13 24 11(85%) 6(19%) 31 6.2 8.2 2.0(32%) 7.2
Total 141 150 9(6%) 128(79%) 163 136.4 181.4 45.0(33%) 158.9
1 aucnt = number of unique authors (i.e., faculty who published)
2 avg_aucnt = average aucnt per year
3 ⌒ = number of unique authors who published in 2001-2005 and 2006-2010 (i.e., overlap)
<Table 4> Author statistics by subject areas
<Figure 4> Number of authors in subject areas
<Figure 5> Number of authors in subject areas by year
Unique and average author counts in five-year periods and author count by year plots, when viewed in tandem, point to the rising popularities of Management and Administration, Library
& Information Services, and Library Structure that are distinct from mostly stable popularity patterns of the other subject areas. Such trends reflect the growing interests in the research areas that cover the service and organizational aspects of LIS in Korea. The spikes in author count, Information Science and Information Organization in 2005 and Library & Information Services and Information Organization in 2009, coincide with increases in non-tenured faculty authors for those years (Table 5). As speculated in the prior section, the “finish line burst” of Library &
Information Services in 2009 might be followed by a large increase (from 29 to 39) in the number of tenured faculty in 2010.
The overlap column (∩ (%)) in Table 4 shows overlaps between the number unique authors who published in 2001-2005 and 2006-2010. Bibliographic Studies had 78% overlap between two time frames, reflecting that it may be a well-established research area with a core set of authoritative authors. Bibliographic Studies having the highest average author productivity of all
subject areas (Table 6) bespeaks for the former. In fact, subject areas with high author overlap tend to have high author productivity as evidenced by Information Science (47% overlap and apr(au) of 5.07), Information Organization (34% and 3.78), Management and Administration (34%
and 3.14), and Foundations in LIS (33% and 2.63). Library & Information Services (34% and 1.52) is an exception, whose author productivity may have been unduly influenced by the “finish line burst” and “post-finish pacing” phenomena observed in 2009 and 2010.
2001 2002 2003 2004 2005 2006 2007 2008 2009 2010
aucnt1 79 88 90 98 104 99 102 115 114 111
newf2 2 4 7 9 8 1 4 7 9 9
aucnt(midf)3
Information Science 30 30 31 37 45 40 36 36 38 35
Information Organization 13 14 18 18 21 16 16 17 25 18
Library & Information Services 10 10 10 13 16 27 27 26 37 29 oldf4
Information Science 14 16 17 17 19 20 23 28 31 42
Information Organization 9 10 11 11 12 12 14 18 21 24
Library & Information Services 13 14 16 16 18 19 22 26 29 39
1 aucnt = number of unique authors (i.e., faculty who published)
2 newf = number of new faculty hires
3 aucnt(midf) = estimated number of non-tenured faculty authors who published
4 oldf = estimated number of tenured faculty (regardless of publication)
<Table 5> Author counts by year and faculty group
4.2.2 Productivity
Of the 1,986 LIS papers published between 2001 and 2010, over a quarter of the papers (27.6%) were published in the subject area of Information Science, followed by a little over one eighth of the papers in the areas of Bibliographic Studies (14.3%), Library & Information Services (13.8%), and Information Organization (13.0%) (Table 6). Based on the publication counts in the five-year time periods, Information Science was the most productive area with 251 papers in the first five-year period, followed by Bibliographic Studies (127). In the second five-year period, the most notable change in productivity by publication count occurred in Library & Information Services (190), which jumped from the 6th place to the 2nd place. Other minor ranking shifts of note were caused by Management and Administration (145) rising above Information Organization (140) and Foundations of LIS (119), and Record Management (47) falling below Library Structure (49).
We further measured the average productivity of an author (apr(au)) by subject areas, considering
the number of faculty authors and the number of publications. Bibliographic Studies was the most productive area (10.67 papers), followed by Information Science (5.07 papers). Changes in subject area rankings by apr(au) over the two five-year time periods were minor. Record Management and Foundations of LIS falling from 3rd and 5th to 6th and 8th rank, which affected most of the ranking changes, were caused by small differences in apr(au) (3 to 2.25 and 1.98 to 1.97).
pcnt1 aucnt2 apr(au)3
Subject ’01-’05 ’06-’10 Δ (%) All years All years ’01-’05 ’06-’10 Δ(%) All years (SD)
BIB 127 157 30 (24%) 284 27 5.29 6.71 1.42 (27%) 10.67 (9.50)
FND 89 119 30(34%) 208 87 1.98 1.97 -0.01(0%) 2.63 (2.25)
INS 251 297 46(18%) 548 121 3.19 3.70 0.51(16%) 5.07 (5.20)
IOR 118 140 22(19%) 258 76 2.78 2.84 0.06(2%) 3.78 (4.51)
LBD 10 17 7(70%) 27 18 1.33 1.54 0.21(15%) 1.78 (1.20)
LST 23 49 26(113%) 72 50 1.37 1.83 0.46(34%) 1.84 (1.60)
LSV 83 190 107(129%) 273 100 1.67 2.63 0.96(57%) 3.03 (2.52)
MNG 87 145 58(67%) 232 83 1.91 2.67 0.76(40%) 3.14 (3.34)
PUB 1 2 1(100%) 3 2 1.00 2.00 1.00(100%) 1.50 (0.71)
RCM 34 47 13(38%) 81 31 3.00 2.25 -0.75(-25%) 3.00 (3.04)
Total 823 1163 340(41%) 1986 163 6.27 8.79 2.52(40%) 13.51 (10.58) BIB: Bibliographic Studies FND: Foundations of LIS INS: Information Science IOR: Information Organization LBD: Library Building & Facilities LST: Library Structure LSV: Library & Information Services MNG: Management and Administration PUB: Publishing RCM: Record Management
1 pcnt = number of unique publications
2 aucnt = number of unique authors (i.e., faculty who published)
3 apr(au) = average productivity of an author (pcnt2/aucnt)
<Table 6> Publication and author counts by subject areas
Table 7 shows rankings of subject areas. Information Science and Bibliographic Studies were the most productive subject areas, and given that high author overlap (⌒%) and small productivity changes over time (Δ%), such areas appear to be the most stable/established subject areas. Information Science and Bibliographic Studies differed in popularity, that is, Bibliographic Studies had a smaller number of authors, showing the high productivity of authors in the Bibliographic Studies.
The difference between overall productivity, as measured by pcnt, and per capita productivity, as measured by apr(au), was relatively minor in terms of ranking. Information Science and Bibliographic Studies swapping ranks at top two positions, Foundations of LIS and Record Management swapping ranks at 6th and 7th positions, and Library & Information Services going from 3rd to 5th position account for all the differences between rankings by pcnt and apr(au).
The similarity between pcnt and apr(au) rankings implies that subject areas with higher author productivity (i.e., apr(au)) tend to be more popular (and vice versa) when the magnitude of apr(au) differences are small since pcnt approximates apr(au) times aucnt (i.e., popularity). Another note- worthy pattern in Table 8 is the similarity between rankings by author overlap (⌒%) and apr(au), which differ only by pairwise rank swaps in 4th and 5th, 6th and 7th, and 8th and 9th positions.
Author overlap, in addition to gauging the maturity of the subject area, may then be related to author productivity.
<Table 7> Subject area rankings by author and publication counts7)
By aucnt1 pcnt2 apr(au)3
Rank All years ⌒%4 ’01-’05 ’06-’10 Δ% All years ’01-’05 ’06-’10 Δ% All years
1 INS BIB INS INS LSV INS BIB BIB PUB BIB
2 LSV INS BIB LSV PUB BIB INS INS LSV INS
3 FND IOR IOR BIB LST LSV RCM IOR MNG IOR
4 MNG LSV FND MNG LBD IOR IOR MNG LST MNG
5 IOR MNG MNG IOR MNG MNG FND LSV BIB LSV
6 LST FND LSV FND RCM FND MNG RCM INS RCM
7 RCM RCM RCM LST FND RCM LSV PUB LBD FND
8 BIB LBD LST RCM BIB LST LST FND IOR LST
9 LBD LST LBD LBD IOR LBD LBD LST FND LBD
10 PUB PUB PUB PUB INS PUB PUB LBD RCM PUB
BIB: Bibliographic Studies FND: Foundations of LIS INS: Information Science IOR: Information Organization LBD: Library Building & Facilities LST: Library Structure LSV: Library & Information Services MNG: Management and Administration PUB: Publishing RCM: Record Management
1 aucnt = number of unique authors (i.e., faculty who published)
2 pcnt = number of unique publications
3 apr(au) = average productivity of an author (pcnt2/aucnt)
4 ⌒% = percent of unique authors who published in 2001-2005 and 2006-2010 (i.e., overlap)
Based on the analysis presented in this section, we infer that popularity and productivity of research area are weakly related in general, while maturity and productivity are strongly related facets of research. In other words, popular research areas that attract more authors tend to become productive over time, but a mature (i.e., established) research area, which is typically populated with a stable set of productive authors, will be productive regardless of its popularity. Bibliographic Studies exemplifies a mature subject area with a small but highly productive author pool.
7) Kendall’s tau correlation coefficients were 0.55 for aucnt and pcnt, 0.38 for aucnt and apr(au), 0.82 for ⌒% and pcnt, 0.82 for ⌒% and apr(au) and 0.82 for pcnt and apr(au).
4.2.3 Impact
Information Science was the most frequently cited area (1,306 times), followed by Library
& Information Services (673). When ranked by projected citation counts, however, Foundations of LIS with 740 projected citations (562 in KCI + 178 projected) rises above Management and Administration with 705 (566 in KCI + 139 projected). The 178 projected count of Foundations of LIS is based on the number of 2011 articles citing papers in that area (19 articles citing papers published in 2008, 33 citing 2009 papers, 31 citing 2010 papers). The 139 projected count of Management and Administration is the result of fewer 2011 articles citing papers in that area (22 citing 2008 papers, 21 citing 2009 papers, 25 citing 2010 papers), especially those published in 2009 and 2010.
pcnt1 ccntprj2
aimprj(p)3
Subject All years ’01-’05 ’06-’10 Δ(%) All years ’01-’05 ’06-’10 Δ(%) All years (SD)
BIB 284 171 324 153(89%) 495 1.35 2.06 0.72(53%) 1.74 (2.53)
FND 208 244 496 252(103%) 740 2.74 4.17 1.43(52%) 3.56 (4.36)
INS 548 629 962 333(53%) 1591 2.51 3.24 0.73(29%) 2.90 (3.24)
IOR 258 202 449 247(122%) 651 1.71 3.21 1.50(87%) 2.52 (3.28)
LBD 27 28 54 26(93%) 82 2.80 3.18 0.38(13%) 3.04 (2.59)
LST 72 62 135 73(118%) 197 2.70 2.76 0.06(2%) 2.74 (2.76)
LSV 273 262 533 271(103%) 795 3.16 2.81 -0.35(-11%) 2.91 (2.96)
MNG 232 250 455 205(82%) 705 2.87 3.14 0.26(9%) 3.04 (3.58)
PUB 3 3 6 3(100%) 9 3.00 3.00 0.00(0%) 3.00 (2.00)
RCM 81 50 186 136(272%) 236 1.47 3.96 2.49(169%) 2.91 (3.60)
Total 1986 1901 3600 1699(89%) 5501 2.31 3.10 0.79(34%) 2.77 (2.53) BIB: Bibliographic Studies FND: Foundations of LIS INS: Information Science IOR: Information Organization LBD: Library Building & Facilities LST: Library Structure LSV: Library & Information Services MNG: Management and Administration PUB: Publishing RCM: Record Management
1 pcnt = number of unique publications
2 ccntprj = projected number of unique citations
3 aimprj(p) = projected average impact of a paper (ccntprj/pcnt)
<Table 8> Citation counts by subject areas and 5-year periods
Citation counts collected from KCI suffer from the reference data inclusion lag as well as citation latency effect (Table 1, section 4.1), which can not only misrepresent the overall citation trend but also induce erroneous subject-specific analysis. For instance, recent Foundations of LIS papers, which are cited many more times by papers published in 2011 than Management and Administration papers and thus likely to have more actual citations, show less citations in the
study data due to the data inclusion lag inherent in KCI.
aim(p)1 aimprj(p)2
Subject ’01-’05 ’06-’10 Δ (%) All years ’01-’05 ’06-’10 Δ (%) All years
BIB 1.35 1.35 0.00(0%) 1.35 1.35 2.06 0.72(53%) 1.74
FND 2.74 2.67 -0.07(-3%) 2.70 2.74 4.17 1.43(52%) 3.56
INS 2.51 2.28 -0.23(-9%) 2.38 2.51 3.24 0.73(29%) 2.90
IOR 1.71 1.93 0.22(13%) 1.83 1.71 3.21 1.50(87%) 2.52
LBD 2.80 1.94 -0.86(-31%) 2.26 2.80 3.18 0.38(13%) 3.04
LST 2.70 1.98 -0.72(-27%) 2.21 2.70 2.76 0.06(2%) 2.74
LSV 3.16 2.16 -0.99(-31%) 2.47 3.16 2.81 -0.35(-11%) 2.91
MNG 2.87 2.18 -0.69(-24%) 2.44 2.87 3.14 0.26(9%) 3.04
PUB 3.00 3.00 0.00(0%) 3.00 3.00 3.00 0.00(0%) 3.00
RCM 1.47 2.32 0.85(58%) 1.96 1.47 3.96 2.49(169%) 2.91
Total 2.31 2.11 -0.20(89%) 2.19 2.31 3.10 0.79(34%) 2.77
1 aim(p) = average impact of a paper (ccntprj/pcnt)
2 aimprj(p) = projected average impact of a paper (ccntprj/pcnt)
<Table 9> Comparison of non-projected and projected citation counts
<Table 10> Subject area rankings by publication and citation counts8)
By pcnt1 ccntprj2
aimprj(p)3 aim(p)4 Rank All years ’01-’05 ’06-’10 Δ% All years ’01-’05 ’06-’10 Δ% All years All years
1 INS INS INS RCM INS LSV FND RCM FND PUB
2 BIB LSV LSV IOR LSV PUB RCM IOR MNG FND
3 LSV MNG FND LST FND MNG INS BIB LBD LSV
4 IOR FND MNG LSV MNG LBD IOR FND PUB MNG
5 MNG IOR IOR FND IOR FND LBD INS LSV INS
6 FND BIB BIB PUB BIB LST MNG LBD RCM LBD
7 RCM LST RCM LBD RCM INS PUB MNG INS LST
8 LST RCM LST BIB LST IOR LSV LST LST RCM
9 LBD LBD LBD MNG LBD RCM LST PUB IOR IOR
10 PUB PUB PUB INS PUB BIB BIB LSV BIB BIB
BIB: Bibliographic Studies FND: Foundations of LIS INS: Information Science IOR: Information Organization LBD: Library Building & Facilities LST: Library Structure LSV: Library & Information Services MNG: Management and Administration PUB: Publishing RCM: Record Management
1 pcnt = number of unique publications
2 ccntprj = projected number of unique citations
3 aimprj(p) = projected average impact of a paper (ccntprj/pcnt)
4 aim(p) = average impact of a paper (ccnt/pcnt)
8) Kendall’s tau correlation coefficients were 0.73 for pcnt and ccntprj, -0.24 for pcnt and aimprj(p), and 0.02 for ccntprj and aimprj(p).
In terms of the average impact of a paper, subject area ranking by non-projected impact, aim(p), and by projected impact, aimprj(p), differs considerably (Table 10). According to aim(p), papers in Publishing were the most frequently cited with 3 citations per paper, whereas Foundations of LIS papers were the most highly cited (3.56 citations per paper) by aimprj(p). The difference between the non-projected citation count based on incomplete data and projected citation count that estimates the complete data is accentuated when research impact changes over time is considered.
Without the projected impact showing increases in the second five year period for all subject areas except Library & Information Services, one may erroneously conclude that impact of research in most subject areas to be declining (Table 9).
The 11% decrease of aimprj(p) in 2006-2010 for Library & Information Services is the result of 129% (107 papers) increase in publications outpacing the rate of citation increase (103%, 271 citations). Consequently, Library & Information Services ranked only 5th by overall average impact (aimprj(p)) despite having the second highest citation count (ccntprj) and the top 2001-2005 average impact of all subject areas (Table 10). In contrast, Foundations of LIS, ranked 3rd by citation count, took the top spot by overall average impact due to the infusion of high impact papers in the second five-year period, which consisted of 119 papers cited 496 times with 34%
increase in publications (30 more papers) and 103% increase in citations (252 more citations) over the first five years.
Interestingly, two most productive subject areas of Information Science and Bibliographic Studies were ranked low in terms of average impact (Table 10). Information Science was ranked 5th in average impact per paper despite receiving the highest total citations for the past ten years, which might be caused by the large pcnt of 548. Bibliographic Studies had the smallest average impact of all subject areas even though it had high productivity, describing the subject area with prolific authorship but “narrow” impact patterns. Bibliographic Studies research in Korea, which involves enumeration and description of old texts, is a type of field that calls for solitary investigations that are artifact-driven. The field is dominated by a few prominent scholars with largely distinct areas of expertise, whose works are based on diverse sets of artifacts. Consequently, researchers in Bibliographic Studies, with a “narrow” pool of prior research to cite from and the penchant for engaging in investigation of new artifacts rather than extending existing work, tend to cite less frequently than authors in other subject areas.
In general, subject area rankings by pcnt and ccntprj appear similar, while the rankings by pcnt and aimprj(p), and by ccntprj and aimprj(p) show little similarity (Table 10). Kendall’s tau coefficient of -0.24 for pcnt and aimprj(p) rankings may reflect the general tendency of citation
to fall below the publication rate9) as well as the atypical citation behavior of Bibliographic Studies researchers. In other words, productivity influences the overall impact (i.e., the more published, the more cited) to a degree but could have an adverse effect on the average impact of a publication, with a caveat that subject-specific patterns may deviate from the general.
4.3 Differences in Bibliometric Patterns across Subject Areas
In preceding sections, we observed repeated evidences of subject-specific patterns reflected in biblometric indicators. Figure 6, which display the bibliometric indicators of research popularity, productivity, and impact by year and subject areas, illustrate the subject-specific differences discussed above.
Analysis of author-based measures revealed that rising popularities of Management and Administration, Library & Information Services, and Library Structure were distinct from mostly stable popularity patterns of the other subject areas and that there were also subject-specific fluctua- tions in research popularity likely related to the maturation of faculty pool in respective subject areas.
Analysis of publication-based measures in conjunction with author-based measures showed that the maturity of research, which differs across subject areas, was related to the average author productivity, as evidenced by the bibliometric patterns exhibited in two most established subject areas of Bibliographic Studies and Information Science.
Research impact, measured by citation-based measures, also was seen to differ across subject areas, especially for Bibliographic Studies and Information Science, whose average impact of a publication differed significantly from other subject areas. Furthermore, subject-specific patterns, such as those in Bibliographic Studies, were shown to deviate greatly from the general pattern of publication and citation.
9) If aimprj(p) were smaller for Y than X, then ccnt(Y)/ccnt(X) < pcnt(Y)/pcnt(X).
<Figure 6> Overview of bibliometric patterns by subject area
5. Discussions and Conclusions
Evaluation of research performance is a task riddled with challenges. Quantitative methods, while avoiding the pitfalls of non-standard criteria and inconsistent assessments, can lead to erroneous conclusions from faulty or incomplete data, misapplication of evaluation metrics, and misinter- pretation of results. In our study, we projected citation counts to compensate for incomplete data and engaged in multi-faceted analysis of results while employing various measures for estimating research impact and productivity to arrive at a holistic view of research performance.
Careful examination of data revealed the pattern of citation latency and practice of data indexing lag that make citation-based bibliometric estimates suspect for recent years. Although the data indexing lag may be specific to KCI and citation latency may vary across disciplines and regions, it would be prudent to consider the state of any study data before committing to analysis and taking the numbers at face value. One should keep in mind, for example, that impact factors published by KCI may not be very robust since they rely heavily on recent citations, bulk of which KCI seems to lack.
Examination of per capita statistics reveals fluctuations in the average publication impact that were not apparent in the overall statistics. Such examinations highlight the importance of rigorous analysis and careful interpretation of bibliometric data. For instance, one should keep in mind the possibility that the low citation counts in later years as shown in Figure 1 reflects the latency effect of citations rather than the impact of publications. Since the study data includes citing articles only up to 2011, the appearance of decline in publication impact may be misleading.
In our investigation of whether multi-disciplinary fields such as library and information science warrant subject-specific assessments of research performance, we observed differences in biblio- metric patterns across subject areas that argue against a uniform approach to research evaluation.
Examination of author counts in subject areas by year revealed a growing popularity in research areas that cover the service and organizational aspects of Library and Information Science (LIS) in Korea, which is distinct from the mostly stable popularity patterns of other LIS subject areas.
In contrast, well-established research areas such as Bibliographic Studies and Information Science were characterized by high levels of productivity by core sets of authors that remained stable over time. High productivity, however, was not necessarily associated with high impact, especially in some subject areas such as Bibliographic Studies where the citation rate was atypically low.
Furthermore, the study showed that there were statistically significant differences in publication