TCP
Transl Clin PharmacolCopyright © 2019 Translational and Clinical Pharmacology
It is identical to the Creative Commons Attribution Non-Commercial License (http://creativecommons.org/licenses/by-nc/3.0/).
This paper meets the requirement of KS X ISO 9706, ISO 9706-1994 and ANSI/NISO Z.39.48-1992 (Permanence of Paper).
Introduction
Ticagrelor (Fig. 1) is a reversible oral P2Y12 receptor antago- nist that exhibits antiplatelet effects by blocking ADP.[1,2] It is widely used in combination with low-dose aspirin to decrease the risk of myocardial infarction and stroke in patients with acute coronary syndromes at a loading dose of 180 mg, followed by a maintenance dose of 90 mg twice daily.[3-5]
Reviewer
This article was reviewed by peer experts who are not TCP editors.
Simultaneous quantification of ticagrelor and its active metabolite, AR-C124910XX, in
human plasma by liquid chromatography- tandem mass spectrometry: Applications in steady-state pharmacokinetics in patients
Soon Uk Chae
1iD, Kyoung Lok Min
2iD, Chae Bin Lee
1iD, Zhouchi Huang
1iD, Min Jung Chang
2iDand Soo Kyung Bae
1,*
iD1College of Pharmacy and Integrated Research Institute of Pharmaceutical Sciences, The Catholic University of Korea, Bucheon 14662, Republic of Korea
2Department of Pharmacy and Yonsei Institute of Pharmaceutical Sciences, College of Pharmacy, Yonsei University, Incheon 21983, Republic of Korea
*Correspondence: S. K. Bae; Tel: +82-2-2164-4054, Fax: +82-2-2164-4096, E-mail: [email protected]
A sensitive and simple liquid chromatography-tandem mass spectrometry method was devel- oped and validated for the simultaneous quantification of ticagrelor and its active metabolite, AR- C124910XX from 50 μL human plasma using tolbutamide as an internal standard as per regulatory guidelines. Analytes in plasma were extracted by simple protein precipitation using acetonitrile, followed by chromatographic separation with an AcclaimTM RSLC 120 C18 column (2.2 μm, 2.1 × 100 mm) and a gradient acetonitrile-water mobile phase containing 0.1% formic acid within 8 min.
Mass spectrometric detection and quantitation were conducted by selected reaction-monitoring on a negative electrospray ionization mode with the following transitions: m/z 521.11 → 361.10, 477.03 → 361.10, and 269.00 → 169.60 for ticagrelor, AR-C124910XX, and tolbutamide, respectively.
The lower limit of quantifications was 0.2 ng/mL with linear ranges of 0.2−2,500 ng/mL (r2 ≥ 0.9949) for both analytes. All validation data, including selectivity, cross-talk, precision, accuracy, matrix effect, recovery, dilution integrity, stability, and incurred sample reanalysis, were well within ac- ceptable limits. This assay method was validated using K2-EDTA as the specific anticoagulant. Also, the anticoagulant effect was tested by lithium heparin, sodium heparin, and K3-EDTA. No relevant anticoagulant effect was observed. This validated method was effectively used in the determination of ticagrelor and its active metabolite, AR-C124910XX, in plasma samples from patients with myo- cardial infarction.
Received 18 Jul 2019 Revised 8 Sep 2019 Accepted 16 Sep 2019
Keywords
AR-C124910XX, Human plasma, LC-MS/MS, Ticagrelor, Validation pISSN: 2289-0882 eISSN: 2383-5427
TCP
Transl Clin Pharmacol2019;27(3):98-106 https://doi.org/10.12793/tcp.2019.27.3.98
ORIGINAL ARTICLE
TCP
Transl Clin Pharmacol
Soon Uk Chae, et al.
In humans, ticagrelor is rapidly absorbed in the intestine and undergoes extensive metabolism to generate approximately ten different metabolites.[6] Of these, the major active metabolite, AR-C124910XX (Fig. 1) is formed via hepatic CYP3A4/5 en- zymes.[7] It is present in the blood at about 30–40% of the con- centration of ticagrelor, exhibiting similar antiplatelet activity.
[8,9] Therefore, the pharmacodynamic response is dependent on combined exposure to ticagrelor and AR-C124910XX.[10]
To date, several LC-MS/MS methods have been reported for simultaneous determination of ticagrelor and its active metabo- lite, AR-C124910XX, in human plasma.[11-15] Most protocols included a liquid-liquid extraction[12,15] or protein precipita- tion with evaporation step[11,13] for plasma preparation, to in- crease assay sensitivity. The lower limits of quantitation (LLOQ) achieved with these methods ranged from 0.5 to 5 ng/mL using
≥100 μL plasma samples. However, these methods have certain limitations such as time-consuming sample preparation and requirement for large plasma volume, which are undesirable for
the high-throughput bioanalysis. Furthermore, many clinical trials have been conducted to confirm the effects of half-dose ticagrelor (loading dose of 90 mg, followed by a maintenance dose of 45 mg twice daily) compared with the standard-dose (loading dose of 180 mg, maintenance dose of 90 mg twice daily) in East Asian patients.[16-18] Therefore, to be able to measure lower concentrations of ticagrelor following half-dose, estimation methods with increased sensitivity are desirable.
More recently, Xu et al. (2019)[14] reported an LC-MS/MS as- say utilizing a simple protein precipitation without a concentra- tion process and achieved better sensitivity (LLOQ of 0.781 ng/
mL) with less plasma volume (20 μL), however, had a narrow calibration curve range (0.781–800 ng/mL).
In this study, a simple and sensitive LC-MS/MS method for the simultaneous determination of ticagrelor and its active metabolite, AR-C124910XX, in human plasma was developed and fully validated. Compared to the previously published LC-MS/MS methods, the present method showed excellent performance, offering several advantages such as requirement of small volume of plasma (50 μL), highly sensitive LLOQ (0.2 ng/mL) with wide calibration ranges (0.2–2,500 ng/mL), and simple protein precipitation protocol. Additionally, anticoagu- lant effects (K2-EDTA, K3-EDTA, lithium heparin, or sodium heparin) were assessed to evaluate the feasibility of adapting this technique for routine analysis of patient samples.
Methods
Chemicals and reagents
Ticagrelor and AR-C124910XX were purchased from Toronto Research Chemicals. Tolbutamide (internal standard, IS) and formic acid were procured from Sigma-Aldrich. Acetonitrile and methanol (HPLC grade) were obtained from Burdick &
Jackson Company. All chemicals were of the highest quality available. Water used for the LC-MS/MS analysis was prepared using a Milli-Q purification system. K2-EDTA, Li-heparin, and Na-heparin human plasma (blank plasma) were obtained from donors at the Severance Hospital of Yonsei University Health System and stored at –80°C prior to using.
Calibration standards and quality controls
Stock solutions of ticagrelor and AR-C124910XX were pre- pared by dissolving each compound in methanol at a concen- tration of 2 mg/mL. Thereafter, stock solutions of both analytes were mixed in a volume ratio of 1:1 and diluted with methanol to get the mixed working solutions with the concentration rang- es of 0.01–125 μg/mL for both ticagrelor and AR-C124910XX.
Calibration standards were prepared by spiking 1 μL of an ap- propriately mixed working solution with 49 μL drug-free hu- man plasma to yield a series of calibration standards at 0.2, 1, 2.5, 10, 100, 500, and 2500 ng/mL for both ticagrelor and AR- C124910XX.
The QC samples were prepared independently from separated
Figure 1. Product ion mass spectra of [M – H]– ions of ticagrelor (A), AR-C124910XX (B), and tolbutamide, IS, (C).
TCP
Transl Clin PharmacolLC-MS/MS bioanalytical method for ticagrelor and AR-C124910XX
stock solutions following the same procedure as above, at 0.2 ng/mL (lower limit of quantification; LLOQ), 0.5 ng/mL (low QC), 200 ng/mL (medium QC), and 2,000 ng/mL (high QC) for both ticagrelor and AR-C124910X. Tolbutamide (internal standard, IS) was dissolved in acetonitrile at 1 mg/mL and further diluted to 5 ng/mL in acetonitrile for routine use as an IS. All stock and mixed working solutions of ticagrelor, AR- C124910XX, and tolbutamide were stored at –80°C before use.
Sample preparation
A 150 µL aliquot of acetonitrile, containing 5 ng/mL tolbuta- mide, was added to a 50 µL aliquot of human plasma sample and mixed by vortexing for 10 min. After the mixture was cen- trifuged at 13,000 × g for 15 min at 4°C, the supernatant was filtered through 13 mm × 0.2 μm PTFE syringe filter directly into an amber autosampler vial for LC-MS/MS analysis. A 5 µL aliquot was injected into the LC-MS/MS system. All prepared samples were kept in an autosampler at 4°C until injection.
LC-MS/MS conditions
Samples were analyzed using an Agilent 1260 HPLC system (Agilent Technologies, Wilmington, DE, USA) equipped with a QTRAPTM 5500 mass spectrometer (AB SCIEX, Foster City, CA, USA) in electrospray ionization mode. The separation was performed on an AcclaimTM RSLC 120 C18 column (2.2 μm, 2.1 × 100 mm, Thermo Scientific, Sunnyvale, CA, USA). The mobile phase consisted of acetonitrile (A) and distilled water containing 0.1% formic acid (B), and the flow rate was set to 0.3 mL/min. Run time was set at 8 min with gradient elution: 0.0–0.1 min (30% A), 0.1–0.6 min (30%–70% A), 0.6–6.0 min (70% A), 6.0–6.1 min (70%–30% A), 6.1–8.0 min (30% A). The column and auto-sampler temperatures were maintained at 40°C and 4°C, respectively.
The mass settings were analyte-specific and were auto-opti- mized by flow injection of 0.2 μg/mL solution in methanol con- taining each analyte. The mass spectral data were acquired with the following electrospray ionization under negative mode: the ion spray voltage was set at –4,500 eV; source temperature was 650°C; nitrogen gas was used as the nebulizer gas; collision gas was set to medium; curtain gas, ion source gases, 1 and 2 were 20, 60, and 60 psi, respectively. The optimized declustering po- tentials, collision energies, entrance potentials, and collision exit potentials were ‒30 eV, ‒30 eV, ‒10 eV, and ‒9 eV for ticagrelor;
‒40 eV, ‒30 eV, ‒10 eV, and ‒10 eV for AR-C124910XX; and
‒55 eV, ‒26 eV, ‒10 eV, and ‒15 eV for IS. For each analyte, two selected reaction-monitoring transitions were monitored, one used for quantification and the other for confirmation as fol- lows: ticagrelor, m/z 521.11 to 361.10 (quantitation) and 168.16 (confirmation); AR-C124910XX, m/z 477.03 to 361.10 (quanti- tation) and 153.14 (confirmation); and IS m/z 269.00 to 169.60 (quantitation) and 91.13 (confirmation). Data acquisition was performed with dwell times of 150 ms, and quadrupoles Q1 and Q3 were set on a unit resolution. The analytical data were pro-
cessed using the Analyst software (version 1.5.2; AB SCIEX).
LC-MS/MS method validation
The validation parameters were selectivity, linearity, preci- sion, accuracy, dilution integrity, recovery, matrix effects, stability, and incurred sample reanalysis of ticagrelor and AR- C124910XX in human plasma containing K2-EDTA as an anticoagulant in accordance with the United States Food and Drug Administration (US FDA) guidance for the validation of bioanalytical methods.[19]
Selectivity
Selectivity towards endogenous plasma matrix components was assessed by comparing the chromatograms of 15 differ- ent batches of plasma which consisted of 13 healthy control plasma, one each of lipemic and hemolytic human plasma to ensure that no interfering peaks were present at the retention times of ticagrelor (0.2 ng/mL) and AR-C124910XX (0.2 ng/
mL) at the LLOQ levels. Crosstalk among MS/MS channels was assessed by directly injecting each compound (ticagrelor, AR- C124910XX, and IS) separately at the highest concentration for the calibration curve (ULOQ; 2,500 ng/mL, each) and monitor- ing the response in the other MS/MS channels.
Carryover
Carryover was investigated by injecting two double blank plasma samples directly after the injection of a high concentra- tion sample from the calibration curves in an analytical run.
The acceptance criteria were that the carryover in the blank sample should not be greater than 20% of LLOQ and 5% for the IS peak area.
Linearity and sensitivity
Calibration curves were prepared by assaying standard hu- man plasma samples of ticagrelor and AR-C124910XX at the concentration ranges of 0.2–2,500 ng/mL. The linearity of each calibration curve was determined by plotting the peak area ratio (y) of ticagrelor and AR-C124910XX to the IS versus the corre- sponding nominal concentration (x). The calibration model was selected based on the analysis of data by linear regression with weighting factors (1/x, 1/x2, and none). The LLOQ of the assay was defined as the lowest concentration on the calibration curve at which a signal-to-noise ratio was > 10, with accuracy within
± 20% and a precision ≤ 20%.
Accuracy and precision
The intra-day accuracy and precision were determined by ana- lyzing 6 replicates of the LLOQ sample and 3 different QC sam- ples (low QC, medium QC, and high QC) on the same day. The inter-day accuracy and precision were evaluated by analyzing 10 replicates of the LLOQ sample and 3 different QC samples on 5 different days (2 replicates per day). The concentrations of QC samples, including LLOQ samples, were determined from the
TCP
Transl Clin Pharmacol
Soon Uk Chae, et al.
standard calibration curve and were analyzed on the same day.
The accuracy was calculated in terms of relative error (RE): RE (%) = (detected concentration − theoretical concentration)/the- oretical concentration × 100%, and the precision was expressed as relative standard deviation (RSD, %) at each level. The ac- ceptance criterion was that the measured values must be within
± 15% deviation from the normal value except at the LLOQ, for which it was considered to be within ± 20%.
Extraction recovery and matrix effect
Extraction recovery and matrix effect for ticagrelor and AR- C124910XX were investigated using 8 individual blank human plasma, including hyperlipemia and hemolytic plasma, at three QC levels (3 replicates of each QC). Extraction recovery of ticagrelor and AR-C124910XX was determined by comparing the peak area of the extracted sample with the peak area of the post‐extracted-spiked plasma. In addition, the same evaluation was performed for the IS. Matrix effect was calculated by the ratio of the peak area in the presence of matrix (post‐extracted- spiked plasma) to the peak area in the absence of matrix (non- extracted neat solution).
Dilution integrity
Dilution integrity test was performed to ensure that plasma samples could be diluted with blank plasma without affecting the final concentration. Ticagrelor and AR-C124910XX spiked human plasma samples were prepared at 20,000 ng/mL (8-fold of ULOQ) and diluted with pooled human blank plasma at dilution factors of 10 and 20 in six replicates and analyzed. As part of the validation, the replicates had to comply with both ac- curacy and precision within ± 15%.
Stability
The stability of ticagrelor and AR-C124910XX in human plasma was assessed at 3 QC levels using 6 replicates under the following conditions: (1) short-term (8 h at room temperature) and long-term (120 days at –80°C) storage, three freeze-thaw cycles, and post-treatment storage (36 h at 4°C). The QC sam- ples for stability testing were processed and quantified against freshly prepared calibration standards along with fresh QC samples. Deviation within ± 15.0% was considered acceptable.
Anticoagulant effect
The anticoagulant effect was tested by analyzing 6 replicates of 3 QC levels spiked in plasma, each containing lithium hepa- rin, sodium heparin, or K3-EDTA as anticoagulants along with processed calibration curve standards, freshly spiked in plasma containing K2-EDTA as an anticoagulant. As part of the valida- tion, the replicates had to comply with both accuracy and preci- sion within ± 15%.
Clinical application and incurred sample reanalysis The validated method was applied to pharmacokinetic sam-
ples from 4 patients with myocardial infarction who received ti- cagrelor 180 mg loading dose (Day 1) followed by 90 mg twice/
day maintenance dose, starting 12 h post-loading dose (Clini- calTrials.gov Identifier: NCT02581280). The Institutional Re- view Board approved this trial at Severance Hospital (IRB No.
4-2014-0919), Yonsei University Health System (Seoul, South Korea), and all patients gave informed written consent before inclusion in the study.
Blood samples (~2 mL) were collected into K2-EDTA tubes just before the 12th maintenance dose dosing (0 h) and 1, 2, 3, 6, 8, and 12 h after 180 mg loading dose (Day 1) and 12 maintenance doses of ticagrelor on Day 7. Samples were centrifuged (3,200 × g, 4°C, 10 min) to obtain plasma, which was stored at −80°C until LC-MS/MS analysis.
Incurred sample reanalysis (ISR) was also performed 3 months after the initial analysis to ensure that the assay method was reproducible. In this study, two samples from each patient, one near Cmax and the other at the elimination phase of ticagre- lor, were reanalyzed. The percentage difference between concen- trations obtained on the initial analysis and the concentrations observed on reanalysis were calculated, and differences within ± 20% of the mean for at least 67% of the repeats were considered acceptable.[19]
Results and Discussion
LC-MS/MS optimization
In order to optimize electrospray ionization for ticagrelor, AR-C124910XX, and the IS, MS full scans were carried out in both positive and negative ion detection modes. Although all the analytes could be ionized in both positive and nega- tive electrospray modes, the higher response was achieved in the negative mode. Therefore, [M – H]‒ ions at m/z 521.11 for ticagrelor, 477.03 for AR-C124910XX, and 269.00 for the IS were employed in MS/MS mode to obtain the fragmentation pattern. Detection of ions was performed in selected reaction- monitoring transition mode by monitoring the transition pairs as described in the methods section. The mass parameters were optimized based on the maximal response of the product ions.
Figure 1 displays the product ion mass spectra of ticagrelor, AR- C124910XX, and the IS.
Chromatography conditions, including mobile phase composi- tions and various reverse-phase analytical columns, were evaluat- ed in order to achieve the best separation, peak shape, sensitivity, and retention for ticagrelor and AR-C124910XX while minimiz- ing the total sample running time. Ultimately, AcclaimTM RSLC 120 C18 column (2.1 × 100 mm, 2.2 μm, Thermo Scientific) and a gradient mobile phase containing acetonitrile and distilled wa- ter containing 0.1% formic acid were selected as high-intensity signals; symmetric peak shapes, and suitable retention times were observed for ticagrelor, AR-C124910XX, and the IS.
Protein precipitation can simplify the sample preparation pro- cedure and provide excellent reproducibility. In this study, ace-
TCP
Transl Clin PharmacolLC-MS/MS bioanalytical method for ticagrelor and AR-C124910XX
tonitrile and methanol were tested as precipitants. In addition, the volume ratio of precipitant to plasma (4:1, 3:1, and 2:1) was optimized by varying the proportion of precipitant added. An acetonitrile-plasma volume ratio of 3:1 was found to yield more consistent and higher recoveries and symmetric peak shapes of ticagrelor and AR-C124910XX than methanol without matrix interference. Therefore, acetonitrile was finally chosen as the precipitant for these experiments.
Selection of a suitable IS with appropriate retention time, ex- traction recovery, and degree of matrix effect as the analyte is an essential factor in the LC-MS/MS analysis. Although a stable isotopically labeled IS is the first choice in the bioanalysis using LC-MS/MS, deuterium-labeled compounds sometimes behave unexpectedly, having variable retention times, different recov- eries, or matrix effects as compared with the analytes.[20-22]
In addition, for new assays intended to be applied for clinical samples or therapeutic drug monitoring, commonly prescribed drugs or self-medication drugs are avoided in the IS selection
process.[23] Several compounds were investigated for the selec- tion of a suitable IS, and finally, tolbutamide was found to be most appropriate for the present purpose.
LC-MS/MS method validation Selectivity
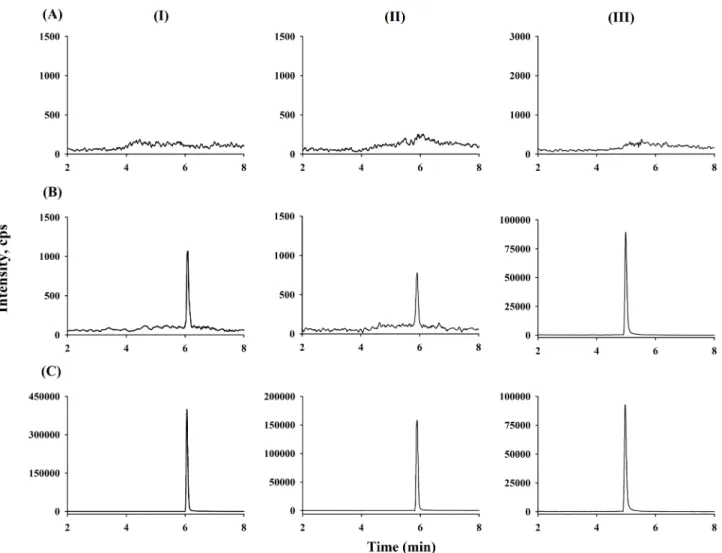
There were no interfering peaks from endogenous substances in the 15 different blank human plasma samples at retention times of ticagrelor (6.1 min), AR-C124910XX (5.7 min), and the IS (5.2 min). Moreover, no cross-talk phenomena were observed among the MS/MS channels. Representative chromatograms of double blank plasma, drug-free plasma spiked with the IS, plasma sample at LLOQ (0.2 ng/mL for both ticagrelor and AR- C124910XX), and human plasma collected at 12 h after 180 mg loading dose (Day 1) and 12 maintenance doses of ticagrelor on Day 7 are shown in Figure 2.
Figure 2. Representative chromatograms of ticagrelor (I), AR-C124910XX (II), and tolbutamide (III): (A) double blank plasma, (B) blank plasma spiked with LLOQ of ticagrelor and AR-C124910XX (0.2 ng/mL, both), (C) a plasma sample collected at 12 h after administration of 12 maintenance doses of ticagrelor on Day 7.
TCP
Transl Clin Pharmacol
Soon Uk Chae, et al.
Carryover
Following the injection of a ULOQ sample, peaks of the 2 analytes and the IS from the blank samples were not observed, indicating that carry-over was avoidable in our assay.
Linearity and sensitivity
The concentration-response relationship was fitted with 1/x2 weighted regression model to evaluate the linearity of calibra- tion curves for ticagrelor and AR-C124910XX. All 6 calibration curves generated during the validation were linear over the con- centration range of 0.2–2,500 ng/mL for both compounds with correlation coefficient (r2) ≥ 0.9956. The typical equations were y = (0.02983 ± 0.001970) x + (0.000171 ± 0.000121) for ticagre- lor and y = (0.03655 ± 0.001787) x + (0.00413 ± 0.0005534) for AR-C124910XX. The back-calculated results for all ticagrelor and AR-C124910XX calibration standards were ≤ 8.00% RSD and –7.60 to 7.97% RE, and ≤ 7.23% RSD and –0.783 to 6.10%
RE, respectively.
The LLOQ (0.2 ng/mL) of both analytes were sufficient to al- low pharmacokinetic studies of ticagrelor and AR-C124910XX at steady-state in humans with signal-to-noise (S/N) ratio ≥ 10.
Accuracy and precision
Accuracy and precision of the analysis of QC samples at 4 con-
centration levels for each analyte are presented in Table 1. The intra-day accuracy (RE, %) and precision (RDS, %) were –4.87 to 1.75% and ≤ 7.75% respectively for ticagrelor, and –3.22 to 4.67% and ≤ 9.86% respectively for AR-C124910XX. The inter- day accuracy and precision were –2.18 to 7.68% and ≤ 5.67%
respectively for ticagrelor, and –4.43 to 0.0700% and ≤ 5.76% re- spectively for AR-C124910XX. All accuracy results were within
± 15% of the nominal value, all precision results were ≤ 15%, and therefore, this developed method is accurate and precise.
Extraction recovery and matrix effect
The detailed results of extraction recoveries and matrix effects are shown in Table 2. The mean extraction recovery of ticagre- lor was within the range of 99.2%–105%, whereas the extraction recovery of AR-C124910XX was within 102%–105%. The ex- traction recovery of IS was 106 ± 2.34%. No significant matrix effect was observed in all the eight batches of human plasma, including hyperlipidemic and hemolyzed plasma. The matrix effects ranged from 102 to 110% for both analytes. Similarly, the corresponding value of the IS was 103 ± 1.88%. This result sug- gested that ion suppression or enhancement from the plasma matrix was negligible under the current conditions. With a low matrix effect and consistent and efficient recovery, this assay has proved to be reliable for bioanalysis.
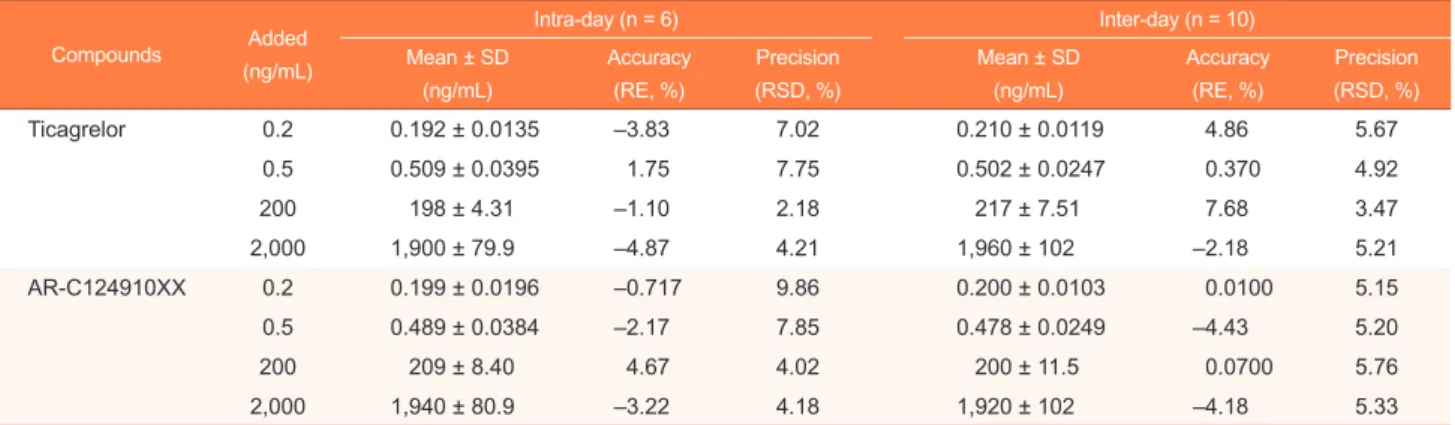
Table 1. Intra- and inter-day accuracy and precision of QC samples for ticagrelor and AR-C124910XX in human plasma
Compounds Added
(ng/mL)
Intra-day (n = 6) Inter-day (n = 10)
Mean ± SD (ng/mL)
Accuracy (RE, %)
Precision (RSD, %)
Mean ± SD (ng/mL)
Accuracy (RE, %)
Precision (RSD, %)
Ticagrelor 0.2 0.192 ± 0.0135 –3.83 7.02 0.210 ± 0.0119 4.86 5.67
0.5 0.509 ± 0.0395 1.75 7.75 0.502 ± 0.0247 0.370 4.92
200 198 ± 4.31 –1.10 2.18 217 ± 7.51 7.68 3.47
2,000 1,900 ± 79.9 –4.87 4.21 1,960 ± 102 –2.18 5.21
AR-C124910XX 0.2 0.199 ± 0.0196 –0.717 9.86 0.200 ± 0.0103 0.0100 5.15
0.5 0.489 ± 0.0384 –2.17 7.85 0.478 ± 0.0249 –4.43 5.20
200 209 ± 8.40 4.67 4.02 200 ± 11.5 0.0700 5.76
2,000 1,940 ± 80.9 –3.22 4.18 1,920 ± 102 –4.18 5.33
Table 2. Extraction recoveries and matrix effects for ticagrelor, AR-C124910XX, and tolbutamide in human plasma
Compounds Added
(ng/mL)
Extraction recovery Matrix effect
Mean ± SD (%) RSD (%) Mean ± SD (%) RSD (%)
Ticagrelor 0.5 99.2 ± 4.43 4.47 110 ± 3.12 2.84
200 105 ± 6.36 6.04 109 ± 2.88 2.64
2,000 105 ± 2.35 2.24 104 ± 3.98 3.84
AR-C124910XX 0.5 102 ± 5.71 5.60 102 ± 7.03 6.80
200 105 ± 4.19 4.01 105 ± 4.83 4.61
2,000 105 ± 3.34 3.18 103 ± 2.80 2.72
Tolbutamide 5 106 ± 2.34 2.20 103 ± 1.88 1.83
TCP
Transl Clin PharmacolLC-MS/MS bioanalytical method for ticagrelor and AR-C124910XX
Dilution integrity
The dilution integrity was confirmed for QC samples of ti- cagrelor and AR-C124910XX that exceeded the ULOQ (up to 20,000 ng/mL). The results revealed that the precision and accuracy for 1:10 and 1:20 diluted test samples were within the acceptable limits of ± 15% for precision and 85.0–115.0% for accuracy (data not shown). These results suggest that plasma samples with concentrations above ULOQ can be determined by appropriate dilution.
Stability
The stability tests were designed to simulate the anticipated conditions of handling real samples. Both ticagrelor and AR- C124910XX were found to be stable in human plasma as well as in the processed samples, under the tested storage conditions (Table 3). All results were within 15% of the initial values, show- ing sufficient stability for sample analysis and storage.
The stock solutions for ticagrelor and AR-C124910XX stored at room temperature for 8 h and at −80°C for 120 days, were ob- served to remain stable.
Anticoagulant effect
This method was validated using K2-EDTA as the specific anticoagulant, and also, the anticoagulant effect was tested with lithium heparin, sodium heparin, or K3-EDTA. The intra- batch accuracy (RE, %) and precision (RDS, %) in plasma with lithium heparin were 2.02 to 7.56% and ≤ 7.32% respectively for ticagrelor, and –3.87 to 8.80% and ≤ 7.72% respectively for AR-C124910XX. In plasma with sodium heparin, the intra- batch accuracy and precision were –3.67 to 6.17% and ≤ 7.78%
respectively for ticagrelor, and –6.25 to 5.01% and ≤ 9.83%
respectively for AR-C124910XX. Similarly, in human plasma with K3-EDTA, the accuracy and precision were –8.27 to 7.17%
and ≤ 10.6% respectively for ticagrelor, and –4.97 to 8.33% and
≤ 5.52% respectively for AR-C124910XX. These results demon- strated the absence of an anticoagulant effect. Therefore, it was concluded that any of the four anticoagulants (K2-EDTA, K3- EDTA, lithium heparin, or sodium heparin) could be used dur- ing pharmacokinetic sample collection.
Clinical application and incurred sample reanalysis
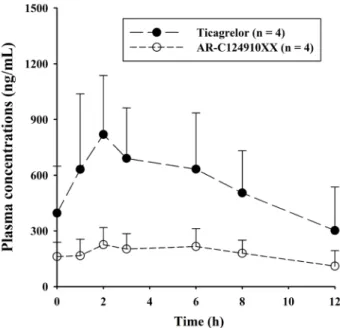
This validated method was effectively used in the determina- tion of ticagrelor and its active metabolite, AR-C124910XX in plasma samples from 4 patients with myocardial infarction, at steady-state of ticagrelor. The mean plasma concentration-time profiles for ticagrelor and AR-C124910XX in 4 patients after 180 mg ticagrelor loading dose (Day 1) followed by 90 mg ticagrelor twice daily maintenance dose (Day 7), are shown in Figure 3.
The sensitivity and specificity of the method using only 50 μL of plasma were sufficient for characterizing the pharmacoki- netics of ticagrelor and AR-C124910XX. During maintenance therapy of ticagrelor in patients with myocardial infarction, the mean Cmax values of ticagrelor and AR-C124910XX were 823 ± 315 ng/mL and 228 ± 92.2 ng/mL respectively, occurring at Tmax (both, 2 h). The plasma profiles of ticagrelor and AR-
Table 3. Stability of ticagrelor and AR-C124910XX in human plasma under various conditions (n = 6)
Compound Added
(ng/mL)
Short-term (8 h at room temperature)
Post-treatment (36 h at 4°C)
Freeze-thaw (Three cycles)
Long-term (120 days at –80°C)
RSD (%) RE (%) RSD (%) RE (%) RSD (%) RE (%) RSD (%) RE (%)
Ticagrelor 0.5 4.41 –5.85 5.61 –5.15 2.31 4.67 3.17 6.83
200 7.10 –1.68 3.71 –5.78 3.55 4.77 2.34 7.39
2,000 6.77 –0.200 5.39 –1.09 7.25 3.13 1.30 4.78
AR-C124910XX 0.5 1.86 6.67 5.38 –1.27 3.12 7.11 2.53 5.83
200 1.24 8.00 6.23 –2.57 1.50 7.61 3.88 3.76
2,000 2.90 7.67 4.67 –1.73 1.78 2.17 3.21 5.78
Figure 3. Mean plasma concentration-time profiles for ticagrelor (●) and AR-C124910XX (○) of four patients with myocardial infarction after oral administration of ticagrelor 180 mg loading dose (Day 1) followed by 90 mg twice/day maintenance dose on Day 7. Vertical bars represent standard deviation.
TCP
Transl Clin Pharmacol
Soon Uk Chae, et al.
C124910XX were similar to those reported in the literature.
[3,17]
Two plasma samples (one at Cmax, and the other at elimination phase, 12 h) from each subject were reanalyzed and the differ- ence in concentration between ISR and initial values of the same subject samples were all within the acceptance criteria of ISR (±
20% deviation) (Table 4), authenticating the good reproducibil- ity and ruggedness of the present method.
Conclusion
A simple and sensitive LC-MS/MS method for the simultane- ous determination of ticagrelor and its active metabolite, AR- C124910XX, in human plasma was developed and validated.
Compared to the previously published LC-MS/MS methods, the present method showed excellent performance, offering several advantages, as follows: requirement of small volume of plasma for analysis (50 μL), highly sensitive LLOQ (0.2 ng/mL), wide calibration range (0.2–2500 ng/mL), and simple protein precipitation protocol. Additionally, the absence of anticoagu- lant effect of commonly employed anticoagulants (K2-EDTA, K3-EDTA, lithium heparin, or sodium heparin) further sup- ports the feasibility of adapting this method for routine analysis of patient samples.
Acknowledgments
This research was supported by the Basic Research Laboratory (BRL) Program (2015R1A4A1042350) and the Basic Science Research Program (2017R1A2B4008761) through the National Research Foundation of Korea funded by the Korean govern- ment.
Conflict of interest
- Authors: Nothing to declare - Reviewers: Nothing to declare - Editors: Nothing to declare
References
1. Husted S, van Giezen JJ. Ticagrelor: the first reversibly binding oral P2Y12 receptor antagonist. Cardiovasc Ther 2009;27:259-274. doi:
10.1111/j.1755-5922.2009.00096.x.
2. Springthorpe B, Bailey A, Barton P, Birkinshaw TN, Bonnert RV, Brown RC, et al. From ATP to AZD6140: the discovery of an orally active revers- ible P2Y12 receptor antagonist for the prevention of thrombosis. Bioorg Med Chem Lett 2007;17:6013-6018. doi: 10.1016/j.bmcl.2007.07.057.
3. Li P, Gu Y, Yang Y, Chen L, Liu J, Gao L, et al. Low-dose ticagrelor yields an antiplatelet efficacy similar to that of standard-dose ticagrelor in healthy subjects: an open-label randomized controlled trial. Sci Rep 2016;6:31838.
doi: 10.1038/srep31838.
4. Orme RC, Parker WAE, Thomas MR, Judge HM, Baster K, Sumaya W, et al. Study of two dose regimens of ticagrelor compared with clopidogrel in patients undergoing percutaneous coronary intervention for stable coro- nary artery disease (STEEL-PCI). Circulation 2018 [In Press] doi: 10.1161/
CIRCULATIONAHA.118.034790.
5. Xu Q, Sun Y, Zhang Y, Liu B, Fang L, Shen C, et al. Effect of a 180 mg ti- cagrelor loading dose on myocardial necrosis in patients undergoing elec- tive percutaneous coronary intervention: A preliminary study. Cardiol J 2017;24:15-24. doi: 10.5603/CJ.a2017.0002.
6. Teng R, Oliver S, Hayes MA, Butler K. Absorption, distribution, metabo- lism, and excretion of ticagrelor in healthy subjects. Drug Metab Dispos 2010;38:1514-1521. doi: 10.1124/dmd.110.032250.
7. Zhou D, Andersson TB, Grimm SW. In vitro evaluation of potential drug- drug interactions with ticagrelor: cytochrome P450 reaction phenotyping, inhibition, induction, and differential kinetics. Drug Metab Dispos 2011;39:703-710. doi: 10.1124/dmd.110.037143.
8. Husted S, Emanuelsson H, Heptinstall S, Sandset PM, Wickens M, Peters G. Pharmacodynamics, pharmacokinetics, and safety of the oral revers- ible P2Y12 antagonist AZD6140 with aspirin in patients with atherosclero- sis: A double-blind comparison to clopidogrel with aspirin. Eur Heart J 2006;27:1038-1047. doi: 10.1093/eurheartj/ehi754.
9. Teng R, Butler K. Pharmacokinetics, pharmacodynamics, tolerability and safety of single ascending doses of ticagrelor, a reversibly binding oral P2Y(12) receptor antagonist, in healthy subjects. Eur J Clin Pharmacol 2010;66:487-496. doi: 10.1007/s00228-009-0778-5..
10. Sillén H, Cook M, Davis P. Determination of unbound ticagrelor and its active metabolite (AR-C124910XX) in human plasma by equilibrium dialy- sis and LC-MS/MS. J Chromatogr B Analyt Technol Biomed Life Sci 2011;879:2315-2322. doi: 10.1016/j.jchromb.2011.06.023.
11. Danielak D, Gorzycka P, Kruszyna Ł, Karaźniewicz-Łada M, Główka F.
Development of an LC-MS/MS method for simultaneous determination of ticagrelor and its active metabolite during concomitant treatment with ator- vastatin. J Chromatogr B Analyt Technol Biomed Life Sci 2019;1105:113- 119. doi: 10.1016/j.jchromb.2018.12.018.
12. Peng J, Wang Y, Li M, He C, Chen Y, Chen X, et al. An HPLC-MS/MS method for the quantitative determination of ticagrelor and its active me- Table 4. Incurred sample reanalysis data of ticagrelor and AR-C124910XX from 4 patients
Patient No. Time (h)
Ticagrelor AR-C124910XX
Initial conc.
(ng/mL)
Re-assay conc.
(ng/mL)
Differencea (%)
Initial conc.
(ng/mL)
Re-assay conc.
(ng/mL)
Difference (%)
1 2 1,290 1,190 8.06 330 309 6.57
1 12 634 608 4.19 229 239 –4.27
2 2 613 648 –5.55 206 221 –7.03
2 12 260 262 –0.766 160 155 3.17
3 2 730 753 –3.10 111 104 6.51
3 12 234 242 –3.36 82.9 88.7 –6.76
4 2 645 626 2.99 256 247 3.58
4 12 80.5 82.9 –2.94 34.3 31.9 7.25
aDifference is expressed as [(initial conc. – re-assay conc.)/mean] × 100.
TCP
Transl Clin PharmacolLC-MS/MS bioanalytical method for ticagrelor and AR-C124910XX
tabolite AR-C124910XX in human plasma and its application to a clinical study. Curr Pharma Anal 2017;13:296-303. DOI : 10.2174/157341291266 6160518151458
13. Sillén H, Cook M, Davis P. Determination of ticagrelor and two metabolites in plasma samples by liquid chromatography and mass spectrometry. J Chromatogr B Analyt Technol Biomed Life Sci 2010;878:2299-2306. doi:
10.1016/j.jchromb.2010.06.018.
14. Xu X, Ding X, Yuan B, Li W, Wang Y, Jin Y, et al. Validated liquid chroma- tography-tandem mass spectrometry method for quantification of ticagre- lor and its active metabolite in human plasma. Biomed Chromatogr 2019;33:e4498. doi: 10.1002/bmc.4498.
15. Zhong W, Wang X, Tang L, Mai L, Chen XP, He G, et al. Simultaneous determination of ticagrelor and its metabolites in human plasma and urine using liquid chromatography–tandem mass spectrometry. J Anal Toxicol 2016;40:445-453. doi: 10.1093/jat/bkw039.
16. Lee YJ, Kim H, Choi J, Lee BH, Lee SY. Evaluation of pharmacokinetic, pharmacodynamic, efficacy, and safety data of low-dose ticagrelor versus standard dose in East Asians: A systematic review. Ther Clin Risk Manag 2018;14:83-93. doi: 10.2147/TCRM.S152276.
17. Li H, Guo J, Carlson GF, Teng R. Pharmacodynamics, pharmacokinetics, and safety of ticagrelor in Chinese patients with stable coronary artery disease. Br J Clin Pharmacol 2016;82:352-361. doi: 10.1111/bcp.12950.
18. Park DW, Lee PH, Jang S, Lim HS, Kang DY, Lee CH, et al. Effect of low- dose versus standard-dose ticagrelor and clopidogrel on platelet Inhibition
in acute coronary syndromes. J Am Coll Cardiol 2018;71:1594-1595. doi:
10.1016/j.jacc.
19. Guidance for Industry-Bioanalytical method validation (2013) US Food and Drug Administration. Rockville, MD, USA. https://www.fda.gov/files/
drugs/published/Bioanalytical-Method-Validation-Guidance-for-Industry.
pdf. Accessed 8 May 2019
20. Liang HR, Foltz RL, Meng M, Bennett P. Ionization enhancement in atmo- spheric pressure chemical ionization and suppression in electrospray ioniza- tion between target drugs and stable-isotope-labeled internal standards in quantitative liquid chromatography/tandem mass spectrometry. Rapid Com- mun Mass Spectrom 2003;17:2815-2821. doi: 10.1002/rcm.1268.
21. Remane D, Wissenbach DK, Meyer MR, Maurer HH. Systematic investigation of ion suppression and enhancement effects of fourteen stable-isotope-la- beled internal standards by their native analogues using atmospheric-pressure chemical ionization and electrospray ionization and the relevance for multi- analyte liquid chromatographic/mass spectrometric procedures. Rapid Com- mun Mass Spectrom 2010;24:859-867. doi: 10.1002/rcm.4459.
22. Wang S, Cyronak M, Yang E. Does a stable isotopically labeled internal stan- dard always correct analyte response? A matrix effect study on a LC/MS/MS method for the determination of carvedilol enantiomers in human plasma. J Pharm Biomed Anal 2007;43:701-707. doi: 10.1016/j.jpba.2006.08.010.
23. Srinivas NR. Should commonly prescribed drugs be avoided as internal standard choices in new assays for clinical samples?. Bioanalysis 2016;8:
607-610. doi: 10.4155/bio.16.21.
![Figure 1. Product ion mass spectra of [M – H] – ions of ticagrelor (A), AR-C124910XX (B), and tolbutamide, IS, (C).](https://thumb-ap.123doks.com/thumbv2/123dokinfo/5301978.156092/2.892.90.434.499.1045/figure-product-ion-mass-spectra-ions-ticagrelor-tolbutamide.webp)