INTRODUCTION
Recently, the use of Ni-Cr base metal alloys in fixed pros- thesis tends to increase because of the continued inflation of gold price. Base metal alloy has various advantages such as high- er yield and tensile strength and better resistance to creep, com- pared with noble alloys.1-3However, base metal alloys also have several crucial disadvantages to be used. One of the critical dis- advantages is the technique sensitivity in laboratory procedures, especially during casting and soldering. To assure the fit of met- al frameworks on abutments, a trial insertion is generally performed in a clinic. If any inadequacy was detected, sectioning and soldering of metal frameworks are required.4
Soldering is a traditional method for joining components of fixed partial dentures using an intermediate metal.5 The longevity of a soldered prosthesis depends on the mechanical properties of its solder joints.6-9El-Ebrashi et al.10reported that the stress was concentrated at the solder joint area and found to be tensile in nature. Therefore, the solder joint should have sufficient strength to endure the functional forces direct-
ed on it.6,9Some previous studies suggested that the strength of base metal alloy in the solder joints is less predictable than that of gold alloy.11-13
Other studies have investigated the factors affecting the strength of the solder joint. Gap distance is one of the impor- tant factors affecting the strength of soldered joints.6,8,14,15It has been reported that the optimal gap distance ranges from 0.15 mm16to 0.76 mm.15One study found that increasing the gap dis- tance would increase the strength of the soldered connectors.15 However, according to Stade et al.,15the method of soldering was more important in connector strength than gap width. Various heat sources for soldering were introduced to improve the qual- ity of the joints. Gas-oxygen torch is a traditional heat source, but there are some problems such as gas inclusions, voids and excessive oxide layer formation.1,11,16,17As an alternative approach, infrared soldering is introduced. Although several studies investigated the strength and quality of solder joints, the effectiveness of infrared soldering has not been widely inves- tigated.6 Several advantages of the infrared ray technique are reported such as lack of gas inclusions and limitation of heat-
DOI:10.4047/jap.2010.2.4.117
Effect of soldering techniques and gap distance on tensile strength of soldered Ni-Cr alloy joint
Sang-Yeob Lee, DDS, Jong-Hyuk Lee*, DDS, MSD, PhD
Department of Prosthodontics, College of Dentistry, Dankook University, Cheonan, Korea
PURPOSE. The present study was intended to evaluate the effect of soldering techniques with infrared ray and gas torch under different gap distances (0.3 mm and 0.5 mm) on the tensile strength and surface porosity formation in Ni-Cr base metal alloy. MATERIALS AND METHODS. Thirty five dumbbell shaped Ni-Cr alloy specimens were prepared and assigned to 5 groups according to the soldering method and the gap distance. For the soldering methods, gas torch (G group) and infrared ray (IR group) were compared and each group was sub- divided by corresponding gap distance (0.3 mm: G3 and IR3, 0.5 mm: G5, IR5). Specimens of the experimental groups were sectioned in the middle with a diamond disk and embedded in solder blocks according to the predetermined distance. As a control group, 7 specimens were prepared without sectioning or soldering. After the soldering procedure, a tensile strength test was performed using universal testing machine at a crosshead speed 1 mm/min. The proportions of porosity on the fractured surface were calculated on the images acquired through the scanning electronic microscope. RESULTS. Every specimen of G3, G5, IR3 and IR5 was fractured on the solder joint area. However, there was no significant difference between the test groups (P > .05). There was a negative correlation between porosity formation and tensile strength in all the specimens in the test groups (P < .05). CONCLUSION. There was no significant difference in ultimate tensile strength of joints and porosity formations between the gas-oxygen torch soldering and infrared ray soldering technique or between the gap distance of 0.3 mm and 0.5 mm. [J Adv Prosthodont 2010;2:117-21]
ORIGINAL ARTICLE J Adv Prosthodont 2010;2:117-21
KEY WORDS. Ni-Cr alloy, Infrared ray soldering, Gas-oxygen torch soldering, Tensile strength, Joint porosity
Corresponding author: Jong-Hyuk Lee
Department of Prosthodontics, College of Dentistry, Dankook University, San 7-1, Shinboo-dong, Cheonan, 330-716, Korea
Tel. 82 41 550 1971: e-mail, [email protected]
Received September 7, 2010 / Last Revison September 15, 2010 / Accepted December 1, 2010
ⓒ 2010 The Korean Academy of Prosthodontics
This is an Open Access article distributed under the terms of the Creative Commons Attribution Non-Commercial License (http://creativecommons.org/licenses/by- nc/3.0) which permits unrestricted non-commercial use, distribution, and reproduction in any medium, provided the original work is properly cited.
ing area.6,17-19In other studies, there were disagreements about its predictability compared with other techniques.18-21
The purpose of this study was to evaluate and compare the effects of different soldering techniques including infrared ray and gas torch under different gap distance conditions (0.3 mm and 0.5 mm) on the tensile strength and the surface porosity in Ni-Cr base metal alloy.
MATERIALS AND METHODS
Thirty five wax patterns 18 mm in length, 3 mm in diame- ter and two 6 mm spheres on both ends were prepared for ten- sile testing (Fig. 1). The wax patterns were invested in a phosphate bonded investment and casting was performed with Ni-Cr based dental alloy (Rexillium�V, Jeneric/Pentron, San diego, USA) using a centrifugal casting machine and a propane gas-oxygen torch according to the manufacturer’s instructions. The composition, product name, manufacturer of the casting alloy and solder material used for this study are list- ed in Table 1.
After casting, the rings were bench cooled and then divest- ed. The specimens were blasted with 50 μm aluminous oxide particle. Some nodules were carefully removed from the specimen surfaces using low speed rotary instruments.
Additional polishing procedures were not performed. The specimens were randomly assigned to five groups by solder- ing methods and gap distance (Table 2). Control group was test- ed for tensile strength without prior sectioning and soldering procedure. The specimens of the other groups were sec- tioned at the center, perpendicular to their long-axis, using a separating disk. Cutting jigs were prepared to ensure accurate and perpendicular cut of the specimens. Both ends of specimens were invested with plaster in rectangular shape (1.5 × 1.5 × 1.5 cm) and the midpoint of the specimens was sectioned by the disk. Then spacers were placed between two halves to allow precise gap distance (0.3 mm, 0.5 mm) and the sectioned spec- imens were united with pattern resin for stabilization during the investing procedure (Fig. 2). After the resin polymer- ization, plaster was carefully removed. The assembled spec- imens were invested with soldering investment (Deguvest�L, Degudent GmbH, Rodenbacher, Germany).
For the gas-oxygen torch soldering, the investment blocks were preheated to 600℃ in a furnace and a flux (UnitekTM, 3M, Monrovia, USA) was applied, then solder alloy (Vera SolderTM, Aalbadent Inc., Cordelia, USA) was placed over the joint area.
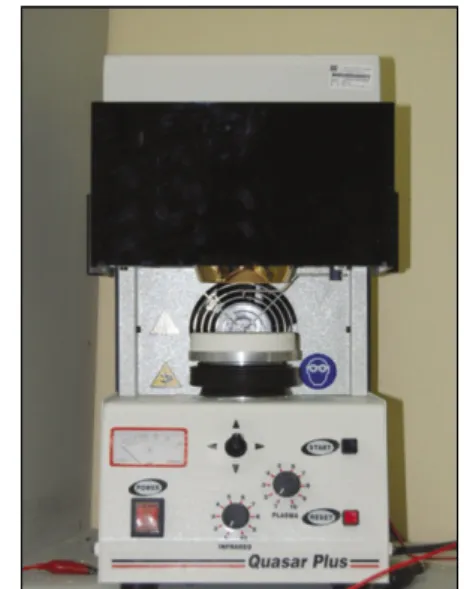
The propane-oxygen gas torch was used and kept moving to prevent excessive oxide formation until the solder material flowed into the gap. For the infrared ray soldering, the invested specimens were placed on the refractory platform of the infrared soldering machine (Quasar Plus, Zhermack S.p.A., Badia Polesine, Italy) (Fig. 3). Flux was applied and a piece of solder was placed to the joint area. Then the specimen was sol- dered according to the manufacturer’s instructions.
Before testing, the solder joint area of each specimen was trimmed with carborundum stone rotary instrument to remove excess solder material. The diameter of each soldered joint was measured with a caliper. Tensile testing was performed using
Effect of soldering techniques and gap distance on tensile strength of soldered Ni-Cr alloy joint Lee SY et al.
Fig. 1. The specimen made with Ni-Cr alloy.
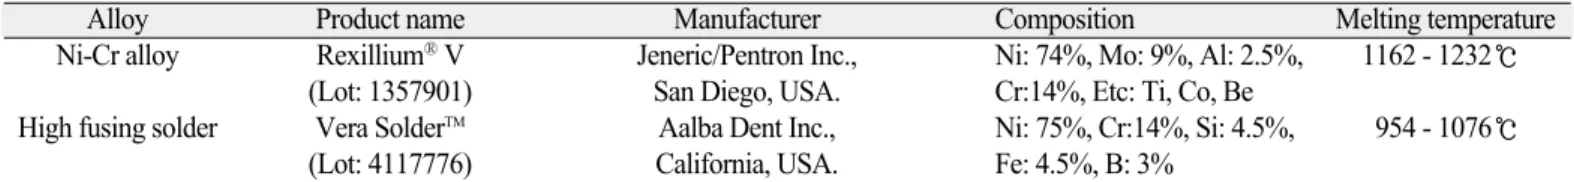
Table 1. The alloy and flux used in this study
Alloy Product name Manufacturer Composition Melting temperature
Ni-Cr alloy Rexillium�V Jeneric/Pentron Inc., Ni: 74%, Mo: 9%, Al: 2.5%, 1162 - 1232℃
(Lot: 1357901) San Diego, USA. Cr:14%, Etc: Ti, Co, Be
High fusing solder Vera SolderTM Aalba Dent Inc., Ni: 75%, Cr:14%, Si: 4.5%, 954 - 1076℃
(Lot: 4117776) California, USA. Fe: 4.5%, B: 3%
Fig. 2. A Soldering block and embedded specimen.
Table 2. Soldering methods and gap condition of groups
Group Gap distance Soldering methods n
Control X X 7
G3 0.3 mm Gas torch soldering 7
G5 0.5 mm Gas torch soldering 7
IR3 0.3 mm Infrared ray soldering 7
IR5 0.5 mm Infrared ray soldering 7
a universal testing machine (Instron�5582, Instron Co., Ltd., Canton, USA). Each specimen was pulled until fracture occurred at a constant crosshead speed of 1.0 mm/min. The data for each sample was automatically calculated and recorded by the analyzing program (Bluehill�software, Instron Co., Ltd., Canton, USA).
After tensile testing, the fractured surface of the specimens were analyzed with SEM (Hitachi S-3000H Scanning electron microscope, Hitachi Inc., Tokyo, Japan) and evaluated for the presence of porosity or voids. The percentage of the porous area to entire joint surface was measured with the image soft- ware (Adobe Acrobat 8 Professional, Adobe Systems, San Jose, USA) (Fig. 4).
The statistical analysis was carried out to find whether any significant difference of tensile strength or porosity among the groups. The data were analyzed at a confidence level of 95%
with Kruskal-Wallis test using the statistical analysis software (SPSS version 12.0, SPSS Inc., Chicago, USA). Pearson’s cor- relation test was used to evaluate whether the presence of poros- ity may have influenced the tensile strength.
RESULTS
The mean and the standard deviation of tensile strength are presented in Table 3. The control group showed apparently higher tensile strength than test groups. In gas torch sol- dered groups, the specimens with 5.0 mm gap shows higher mean tensile strength. In contrast, infra red groups showed high- er tensile strength in smaller gap distance group. However, there were no significant differences among the test groups which were designed under different conditions (P = 0.174). The mean and the standard deviation of joint porosity are presented in Table 4. G3 group shows the highest porosity presence on sol-
dered joint and G5 group showed the smallest number of the percent. The value of the infrared soldering showed rela- tively smaller standard deviation than those of the gas torch sol- dering groups. However, comparing the joint porosity, there Fig. 3. Infrared ray soldering machine. Fig. 4. SEM image of fracture surface of specimen (×30).
Table 4. The proportion of joint porosity area (Unit: %)
Group G3 G5 IR3 IR5
1 22.7 21.6 20.5 16.84
2 44.7 36.4 23.8 15.71
3 14.3 32.1 15.7 16.83
4 74.9 4.3 20.8 29.43
5 22 14.7 15.2 15.96
6 26.3 32.6 25.2 19.09
7 35.6 3.8 22.1 14.65
Mean 34.36 23.62 20.5 18.36
SD 20.45 12.43 3.81 5.07
Table 3. The tensile strength at failure (Unit: MPa)
Group Control G3 G5 IR3 IR5
1 960 425 458 462 379
2 758 238 303 316 457
3 1010 533 376 466 452
4 875 103 581 382 216
5 757 346 436 550 418
6 807 372 263 391 549
7 1039 166 629 414 282
Mean 886.5 311.9 402.8 425.9 393.3
SD 118.0 151.0 115.0 74.9 112.8
Control: No soldering procedure, G3: 0.3 mm gap distance + gas torch soldering, G5: 0.5 mm gap distance + gas torch soldering, IR3:
0.3 mm gap distance + infrared soldering, IR5: 0.5 mm gap distance + infrared soldering
was also no significant difference among the groups (P = .230).
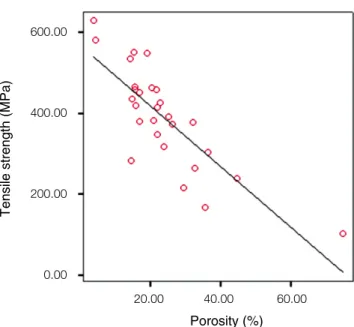
According to Pearson’s correlation test, correlation coefficient of tensile strength and porosity was -0.813 (P = 0.00) and showed negative correlation (Fig. 5).
DISCUSSION
In this study, tensile strength and porosity formation were mea- sured and compared when the two different soldering techniques, which were gas torch soldering and infrared ray soldering, were applied. The influence of the gap distance on the results was also evaluated.
The results of present study revealed that there was no sig- nificant difference in ultimate tensile strength between the two soldering techniques. This result coincides with the report of Tehini et al.19One investigation with noble alloy material showed no significant difference between the conventional torch and infrared heating techniques.20However, Cheng et al.22suggested that the ultimate tensile strength of Chromium-Cobalt alloy con- nectors with the infrared soldering was significantly higher than those with a gas-oxygen technique.
The correlation between gap distance and joint strength has been investigated in many studies. Significant effect of gap distance on the joint’s strength was presented.6,8,15,23Also, it has been shown that increase of gap distance did not compromise the strength and the most unsatisfactory results occurred when there was an insufficient gap distance.8,15,23Ryge23report- ed that a gap distance of less than 0.005 inch (0.123 mm) would cause greater porosity and the decreased strength of the sol- dered joints. In one similar study concerning infrared soldering, it has been observed that the 0.5 mm gap distance resulted in higher tensile strength than the 0.3 mm.6The compromised flow
of the solder and the adverse effect of the thermal expansion of the parent alloy in the narrow gaps was explained as the cause.
Nevertheless, no significant difference was found in present study between two gap distances.
Porosities are caused by the flux, gas, foreign body inclusions or insufficient wetting of the parent metal by solder alloy. This is supported by the finding of other studies.12,17,24The correlation between the porosity and the strength have been widely accepted.12,24-26It is also clearly proved that there is a negative effect of porosity to the soldering material in the present study. Some investigators suggested that soldering method27 and gap distance15,23could be attributing factors to the poros- ity. Another studies17represented that infrared method was more advantageous than gas torch in porosity formation since less gas inclusions were found. Ryge23 reported gap distance influenced the proportions of the porosity. However, in the cur- rent study, there were no significant differences between sol- dering methods and gap distance on the porosity.
As fixed partial dentures are exposed to repetitive mechan- ical stresses during mastication, further studies should evaluate the long-term effectiveness of the soldering methods simulated under intraoral conditions. In addition, the effect of the gap should be closely examined to improve the quality of the prosthesis with joints to be soldered.
CONCLUSION
This comparative study investigated the tensile strength and porosity formation of the joint by two soldering techniques (gas-torch soldering, infrared ray soldering) and evaluated the effect of the gap distance on the results.
Within the limitations of this study, infrared ray soldering may be an alternative method for the conventional gas-oxygen torch soldering. The gap distance between the soldered parts may give no effect to the tensile strength and porosity of the soldered joint within the range of 0.3 mm to 0.5 mm.
REFERENCES
1. Blustein R, DePaul BM, Barnhart RC Jr, Green KA. A reliable technique of post soldering of nonprecious ceramic units. J Prosthet Dent 1976;36:112-4.
2. Huget EF, Vlica JM, Wall RM. Characterization of two ceramic- base-metal alloys. J Prosthet Dent 1978;40:637-41.
3. Moffa JP, Lugassy AA, Guckes AD, Gettleman L. An evalua- tion of nonprecious alloys for use with porcelain veneers. Part I. Physical properties. J Prosthet Dent 1973;30:424-31.
4. Nikellis I, Levi A, Zinelis S. Effect of soldering on the metal- ceramic bond strength of an Ni-Cr base alloy. J Prosthet Dent 2005;94:435-9.
5. Shillingburg HT, Hobo S, Whitsett LD, Jacobi R, Brackett SE. Fundamentals of Fixed Prosthodontics. 3rded. Chicago;
Quintessence Publishing; 1997. p. 509.
6. Anwar EM, Naggar GA. Effect of different gap distances on the tensile strength and microstructure of infra-red soldered joints.
Cairo Dent J 2004;20:149-55.
Effect of soldering techniques and gap distance on tensile strength of soldered Ni-Cr alloy joint Lee SY et al.
Fig. 5. Correlation between tensile strength and porosity.
600.00
400.00
200.00
0.00
Tensile strength (MPa)
20.00 40.00 60.00 Porosity (%)
7. Marshall AG, Goodkind RJ. An investigation of the tensile strength of nickel-chromium alloy dental solder joints. J Prosthet Dent 1984;52:666-72.
8. Rasmussen EJ, Goodkind RJ, Gerberich WW. An investigation of tensile strength of dental solder joints. J Prosthet Dent 1979;
41:418-23.
9. Watanabe I, Watanabe E, Atsuta M, Okabe T. Tensile strength of soldered gold alloy joints. J Prosthet Dent 1997;78:260-6.
10. el-Ebrashi MK, Craig RG, Peyton FA. Experimental stress analysis of dental restorations. VII. Structural design and stress analysis of fixed partial dentures. J Prosthet Dent 1970;23:177- 86.
11. Kaylakie WG, Brukl CE. Comparative tensile strengths of nonnoble dental alloy solders. J Prosthet Dent 1985;53:455-62.
12. Anusavice KJ, Okabe T, Galloway SE, Hoyt DJ, Morse PK.
Flexure test evaluation of presoldered base metal alloys. J Prosthet Dent 1985;54:507-17.
13. Townsend LW, Vermilyea SG, Griswold WH. Soldering non- noble alloys. J Prosthet Dent 1983;50:51-3.
14. Stackhouse JA Jr. Assembly of dental units by soldering. J Prosthet Dent 1967;18:131-9.
15. Stade EH, Reisbick MH, Preston JD. Preceramic and postceramic solder joints. J Prosthet Dent 1975;34:527-32.
16. Willis LM, Nicholls JI. Distortion in dental soldering as affected by gap distance. J Prosthet Dent 1980;43:272-8.
17. Ryge G, Kozak SF, Fairhurst CW. Porosities in dental gold cast-
ings. J Am Dent Assoc 1957;54:746-54.
18. Carlberg T, Wictorin L. Soldering of dental alloys under vacuum by IR-heating. Dent Mater 1986;2:279-83.
19. Tehini GE, Stein RS. Comparative analysis of two techniques for soldered connectors. J Prosthet Dent 1993;69:16-9.
20. Cattaneo G, Wagnild G, Marshall G, Watanabe L. Comparison of tensile strength of solder joints by infrared and convention- al torch technique. J Prosthet Dent 1992;68:33-7.
21. Chaves M, Vermilyea SG, Papazoglou E, Brantley WA. Effects of three soldering techniques on the strength of high-palladium alloy solder joints. J Prosthet Dent 1998;79:677-84.
22. Cheng AC, Chai JY, Gilbert J, Jameson LM. Mechanical prop- erties of metal connectors soldered by gas torch versus an infrared technique. J Prosthodont 1993;2:103-9.
23. Ryge G. Dental soldering procedures. Dent Clin North Am 1958;2:747-57.
24. Anusavice KJ, Shafagh I. Inert gas presoldering of nickel- chromium alloys. J Prosthet Dent 1986;55:317-23.
25. Nicholls JI, Lemm RW. Tensile strength of presoldered and post- soldered joints. J Prosthet Dent 1985;53:476-82.
26. Sobieralski JA, Brukl CE, Smith NK. Tensile strengths and mi- croscopic analysis of nickel-chromium base metal postceram- ic solder joints. J Prosthet Dent 1987;58:35-42.
27. Cheng AC, Chai JY, Gilbert J, Jameson LM. Investigation of stiff- ness and microstructure of joints soldered with gas-oxygen torch and infrared methods. J Prosthet Dent 1994;72:8-15.