DOI : 10.3341/jkos.2008.49.1.119
녹내장 진단을 위해 이용되는 기존의 자동시야검사 계의 경우 상당량의 망막신경절세포 소실이 발생한 후 에야 녹내장성 변화를 감지할 수 있는 것으로 알려져 있어,1,2 초기 녹내장의 진단이 어렵다는 단점이 있다.
따라서 녹내장의 효과적인 조기 발견을 위한 새로운 시 야검사법에 대한 연구가 이루어져 왔는데,3-13 이들 중 하나가 frequency doubling technology (FDT)를 이용한 시야검사이다.
초기 녹내장 안에서는 직경이 큰 시신경섬유 축삭의 손상이 먼저 발생하는데,7,8 FDT 시야검사는 frequency doubling 현상을 이용하여 이러한 magnocellular pathway의 녹내장성 손상을 선택적으로 포착할 수 있
는 것으로 알려져 있다.9,10 녹내장의 조기 발견에 있어 서 FDT 시야검사의 유용성은 최근 수년 간의 연구를 통해 어느 정도 입증되어 있음은 물론10-13 검사 시간이 짧고, 사용이 간편하다는 장점이 있어 현재 녹내장의 조기 진단을 위해 이용되는 대표적인 방법 중 하나로 자리잡고 있다.
지난 수년 동안 FDT 시야검사의 결과에 영향을 미 칠 수 있는 인자들에 대한 연구가 이루어져 왔으며,14-22 굴절이상은 이러한 인자들 중 하나로 알려져 있다.
FDT 시야검사의 경우 굴절 이상에 비교적 적은 영향 을 받기 때문에 ±7 diopter (D) 이내의 굴절이상의 경우 교정하지 않고 검사를 시행하더라도 문제가 없 을 것으로 생각되었으며(A primer for frequency doubling technology. Dublin, CA: Humphery Systems /Welch-Allyn, Inc.; 1998.), 이후 시행 된 대부분의 연구에서 역시 굴절이상이 검사 결과에 영 향을 미치지 못하는 것으로 나타났다.10,14,23 그러나 녹 내장 안을 대상으로 검사를 시행하였을 때, 비록 ±7D 이내의 굴절 이상이라 하더라도 검사 결과에 유의한 영 향을 미칠 수 있다는 연구 결과도 보고되어 있다.15
비교적 최근 개발된 FDT 시야검사인 Humphrey Matrix (Humphrey Systems, Inc., USA)는 기
근시가 험프리 매트릭스 30-2 검사에 미치는 영향
김재휘․기창원
성균관대학교 의과대학 삼성서울병원 안과학교실
목적 : 근시의 정도가 Humphrey Matrix 30-2 test에 미치는 영향에 대하여 알아보고자 한다.
대상과 방법 : 정상 및 녹내장으로 진단된 29안(29명)의 근시안을 대상으로 2회의 Humphrey Matrix 30-2 test 를 시행하였다. 첫번째 검사는 환자의 안경을 착용한 상태로 시행하였으며, 두번째 검사는 안경을 착용하지 않고 시행 하였다. 두 번의 검사에서 얻어진 mean deviation (MD) 값의 차이(∆MD)와 pattern standard deviation (PSD) 값의 차이(∆PSD)를 계산하였으며, 구면렌즈대응치의 변화에 따른 ∆MD와 ∆PSD 값의 변화를 분석하였다.
또한 total deviation printout value를 시야의 위치 및 녹내장성 시야 손상의 정도에 따라 각각 두 군으로 나눈 후 안경 착용 전후의 평균값을 비교하여 이들 분류에 따른 근시의 영향을 알아보았다.
결과 : 구면렌즈대응치와 ∆MD 값은 유의한 상관관계가 있었으나(p=0.02, r=0.62) ∆PSD 값과는 상관관계가 없
었다(p=0.81, r=0.15). 중심 시야와 주변 시야에서 측정한 평균 total deviation printout value의 차이는 유의 하지 않았으며(p=0.86), 녹내장성 시야 손상이 심하지 않은 부위에서 측정한 평균 total deviation printout value의 차이는 유의하게 높은 값을 보였다(P<0.01).
결론 : 근시안을 대상으로 Humphrey Matrix 30-2 test를 시행한 결과 근시의 정도는 시야 검사의 MD값의 변화 에 영향을 주었다.
<한안지 49(1):119-124, 2008>
<접수일 : 2007년 2월 13일, 심사통과일 : 2007년 8월 14일>
통신저자 : 기 창 원
서울시 강남구 일원동 50 성균관대학교 삼성서울병원 안과 Tel: 02-3410-3564, Fax: 02-3410-0074 E-mail: [email protected]
* 본 논문의 요지는 2006년 제22회 한국 녹내장 심포지움에서 구연으로 발표되었음.
존의 FDT 시야검사에 비해 많은 장점을 가지고 있는 것으로 알려져 있으나24 검사점의 크기가 작은 만큼 기 존의 FDT 시야검사에 비해 굴절이상의 영향이 크게 나타날 것으로 생각된다. 본 연구를 통해 근시가 Humphrey Matrix 30-2 test에 미치는 효과를 알 아보고자 하며, 세부적으로 중심과 말초부위로 나눈 시 야의 위치와 녹내장성 시야 손상의 정도에 따른 근시의 영향을 분석하고자 한다.
대상과 방법
2005년 8월부터 2006년 10월까지 본원을 방문한 환자들 중 녹내장이 의심되거나 이미 녹내장으로 진단 된 환자를 대상으로 현성굴절검사를 시행하였다. 근시 로 판명된 안 중 환자가 착용한 안경과 현성굴절검사 값이 구면렌즈대응치 ±1.0D 이내이며, 안경 착용 후 교정시력 0.8 이상으로 측정된 안을 대상으로 연구를 계획하였다. 이전 안내 수술의 병력, 중등도 이상의 백 내장, 심한 당뇨망막병증이나 고혈압망막병증, 망막 변 성이나 출혈, 황반부의 이상, 시신경병증, 포도막염 등 시야검사 결과에 영향을 미칠 수 있는 안내 병변이나 병력을 가진 환자는 연구에서 제외되었다.
연구군으로 선택된 안을 대상으로 2번의 Humphrey Matrix 30-2 test를 연속적으로 시행하였는데, 첫번 째 검사는 환자의 안경을 착용한 상태로 시행하였으며, 두 번째 검사는 안경을 착용하지 않고 시행하였다. 검 사와 검사 사이에는 15분간의 휴식 시간을 배정하였다.
근시가 검사 결과에 미치는 영향을 알아보기 위해 두 번의 검사에서 얻어진 mean deviation (MD) 값의 차이(∆MD)와 pattern standard deviation (PSD) 값의 차이(∆PSD)를 계산하였으며, 구면렌즈 대응치의 변화에 따른 ∆MD와 ∆PSD 값의 변화를 분석하였다. 또한 두 번의 검사에서 glaucoma hemifield test (GHT)가 서로 다르게 나타난 경우 를 알아보았다.
시야의 위치에 따른 근시의 영향을 알아보기 위해 total deviation printout의 값들을 주시점에서 15
도 이내의 중심시야와 15도~30도 사이의 주변시야로 나누어 두 번의 검사에서 측정된 평균 total deviation printout value의 차이를 서로 비교하였다. 또한 녹 내장성 시야 손상의 정도에 따른 근시의 영향을 알아보 기 위해 total deviation plot에서 ‘P<1%’ 및
‘P<0.5%’ 의 값을 나타내는 시야를 심한 녹내장성 시야 손상을 나타낸 부위로 정의하였고, 나머지 시야를 시야 손상이 심하지 않은 부위로 정의하여 두 번의 검사에서 측정된 평균 total deviation printout value의 차 이를 서로 비교하였다.
통계 방법으로는 안경 착용 전후의 검사에서 나타난 값의 차이를 비교하는 경우 paired t-test를 이용하였 으며, 구면렌즈대응치의 변화에 따른 ∆MD와 ∆PSD 값의 변화를 분석하는 경우 simple linear regression 을 이용하였다.
결 과
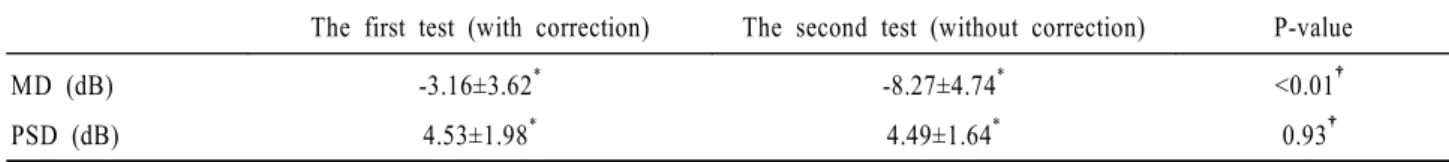
전체 29안(29명)을 대상으로 연구를 시행하였으며 29안 중 23안은 녹내장으로 진단된 안이었다. 대상 환 자의 평균 연령은 40.42±13.91세(23~61세), 대상 안의 평균 SE 값은 -4.71±1.90D (-1.13~-8.00D) 이었다. MD, PSD 값은 안경을 착용하지 않고 측정 한 경우 각각 -8.27±4.74dB, 4.49±1.64dB 이었 으며, 안경을 착용하고 측정한 경우 각각 -3.16±
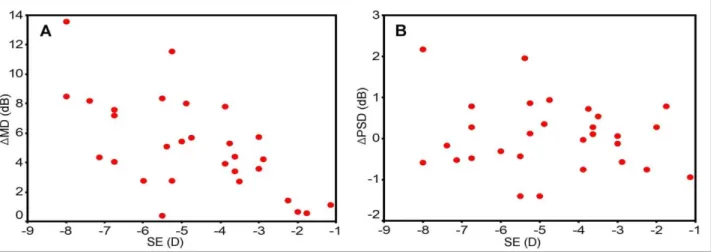
3.62dB (paired t-test, p<0.01), 4.53±1.98dB (paired t-test, p=0.93) 이었다(Table 1). 구면렌 즈대응치와 ∆MD 값의 변화 사이에는 유의한 상관관 계가 나타났으나(Fig. 1A, simple linear regression, p=0.02, r=0.62) 구면렌즈대응치와 ∆PSD 값의 변 화 사이의 연관성은 유의하지 않았다(Fig. 1B, simple linear regression, p=0.81, r=0.15). 안경착용 전후로 시행한 GHT의 결과가 서로 바뀐 경우는 7안 (24.1%) 이었는데, 이들 안에서 안경착용 전 3안에서
‘outside normal limit’, 4안에서 ‘borderline’이었던 GHT 결과는 안경착용 후 6안에서 ‘within normal limit’, 1안에서 ‘borderline’으로 바뀌었다(Table 2).
Table 1. Difference of MD and PSD between the first (with correction) and the second (without correction) tests (MD=mean deviation; PSD=pattern standard deviation)
The first test (with correction) The second test (without correction) P-value MD (dB)
PSD (dB)
-3.16±3.62* 4.53±1.98*
-8.27±4.74* 4.49±1.64*
<0.01† 0.93†
*Mean±standard deviation.
†Paired T-test.
중심시야에서 측정한 안경 착용 전후 평균 total deviation printout value의 차이는 5.85±
4.26dB 이었으며, 주변시야에서 측정한 경우는 5.66
±3.56dB 이었다(Table 3, paired t-test, p=0.86).
29안 중 정상으로 판명된 6안을 제외한 23안을 대상 으로 녹내장의 정도에 따른 근시의 영향을 평가하였다.
심한 녹내장성 시야 손상을 나타낸 부위에서 측정한 안경 착용 전후 평균 total deviation printout
value의 차이는 3.16±3.39dB 이었으며, 시야 손상 이 심하지 않은 부위에서 측정한 경우는 6.62±
4.52dB 이었다(Table 3, paired t-test, p<0.01).
고 찰
FDT 시야검사에서는 비교적 크고 적은 수의 검사점 을 이용하여 검사를 시행하게 된다. 따라서 비록 녹내 Table 2. Changes of glaucoma hemifield test results between the first (with correction) and the second (without correction) tests
Case SE (D) The first test (with correction) The second test (without correction) 1
2 3 4 5 6 7
-8.00 -5.50 -4.25 -3.88 -3.50 -3.00 -2.88
WNL WNL WNL Borderline
WNL WNL WNL
ONL Borderline Borderline
ONL Borderline
ONL Borderline D=diopter; WNL=within normal limit; ONL=outside normal limit; SE=spherical equivalent.
Table 3. Differences of mean pattern standard printout values between central (within 15 degree from the fixation point) and peripheral visual field (A) and between severely damaged and less damaged visual field (B)
Visual field (VF) Value of total deviation printout (dB, Mean±SD) P-value A
B
Central VF Peripheral VF Severely damaged VF
Less damaged VF
5.85±4.26 5.66±3.56 3.16±3.39 6.62±4.52
0.86*
<0.01*
*Paired T-test.
Figure 1. Correlations between SE and ∆MD (A: simple linear regression, p=0.02, r=0.62), SE and ∆PSD (B: simple linear regression, p=0.93, r=0.15) (SE: spherical equivalent, ∆MD: differences of mean deviation between the first and the second tests;
∆PSD: differences of pattern standard deviation between the first and the second tests.).
장의 조기 발견에 효과가 있는 검사법으로 알려져 있음 에도 불구하고 작고 국소적인 시야 손상을 정확히 평가 하기 어렵다는 단점이 지적되어 왔다.25 Humphrey Matrix는 최근 개발된 새로운 형식의 FDT 시야검사 계로서 기존의 검사에 비해 많은 수의 검사점을 이용하 여 검사를 시행하게 되며, 최적화된 algorithm으로 검사 시간을 단축시켰고, 개체내(intra-individual) 및 개체간(inter-individual) 검사 결과의 변이 (variability)를 줄였으며, video eye monitoring system과 GHT 결과를 제공한다. 이와 같이 Humphrey Matrix는 좀 더 발전된 형식의 검사를 통해 기존의 검사법에 비해 더 정확하고 정밀한 시야검 사 결과를 얻을 수 있다. Humphrey matrix 30-2 test의 경우 주시점에서부터 30도 이내의 시야를 검사 하는 데에 69개라는 많은 수의 검사점을 이용하여 가장 정밀한 검사 결과를 얻을 수 있다. 이전의 FDT 시야검 사의 경우 적은 수의 검사점으로부터 얻을 수 있는 정 보가 제한되어 있었기에 주로 초기 녹내장의 진단에만 이용되었으나 Humphrey Matrix의 경우 녹내장의 조기 진단 뿐 아니라 진행 정도를 추적관찰 하는 데에 도 유용한 것으로 알려져 있다.26,27 제작사의 지침에 따 르면 30-2 test를 시행하는 경우 ±3D 이상의 굴절 이상은 교정하는 것을 추천하고 있으나 Humphrey 기계에 별도의 trial frame이 없어 환자가 본인의 안경을 착용하지 않는 경우 정확한 교정이 어려운 실 정이다.
본 연구에서는 굴절이상의 효과를 과대평가하는 오 류를 방지하기 위해 학습 효과와 피로에 의한 검사 결 과의 오류를 최소화하고자 하였다. 학습 효과는 검사 결과에 유의한 영향을 미치는 인자로 알려져 있다. 이 러한 학습 효과는 특히 처음 검사를 시행 받는 환자에 서 더 큰 영향을 나타내게 되는데,18,19 본 연구에서 6명 (6안)의 경우 이전에 전산화시야검사를 시행 받은 경험 이 없는 환자들이었으며, 18명(18안)의 경우 이전에 FDT 시야 검사를 시행한 경험이 없는 환자들이었다.
이들을 대상으로 연속적인 검사를 시행할 경우 학습 효 과에 의해 두 번째 검사에서 좀 더 높은 MD 값이 나타 날 가능성이 있을 것으로 생각되었다. 따라서 안경을 착용하고 첫번째 검사를 시행하였으며, 안경을 착용하 지 않고 두 번째 검사를 시행하여 학습 효과에 의한 안 경 착용 시 측정한 MD 값의 상승을 방지하고자 하였 다. 하지만 이와 같은 연구 설계에서는 오히려 근시의 효과가 실제보다 적은 것으로 나타날 가능성을 배제할 수 없다. 따라서 이와 같은 가능성을 고려하였을 때, 근 시의 효과가 검사 결과에 유의한 영향을 미쳤다는 본 연구의 결과는 근시의 영향이 크다는 점을 좀 더 강하
게 시사한다고 할 수 있을 것이다.
Humphery Matrix 30-2 test의 검사 시간은 FDT 시야검사계에 비해 조금 더 단축되었으나 검사점 의 수가 증가하고 크기가 작아져, 피로가 검사 결과에 영향을 미칠 가능성을 배제할 수 없을 것으로 생각된 다. 기존의 연구에 따르면 FDT 시야검사를 시행할 때 피로에 의한 오류를 방지하기 위한 휴식 시간은 2~8분 정도로 충분할 것이라는 가정도 있었으나15,21 저자에 따라 서로 다른 날에 검사를 시행하는 것을 권장하는 경우도 있어16 검사 후 피로 회복 기간에 대한 정확한 기준은 아직 마련되지 않은 상태이다. 본 연구에서는 15분 간의 휴식이 피로 회복에 충분한 시간이라 생각하 고 검사를 시행하였다.
본 연구에서는 근시를 교정하지 않은 경우 MD 값의 증가가 나타났으며, 이는 근시의 정도(구면렌즈대응치) 에 비례하였다. 안경교정 전후의 GHT 결과가 서로 다 르게 나타난 경우는 7안(24.1%) 이었는데, 비교적 경 도의 근시(-3D 이하)로 측정된 2안에서 굴절이상 교정 후 ‘within normal limit’이었던 검사 결과가 굴절 이상 교정 없이 검사한 경우 각각 ‘borderline’,
‘outside normal limit’으로 바뀌어 비록 근시의 정 도가 작다고 하더라도 검사 결과에 유의한 변화가 나타 날 수 있음을 보여주었다. 위와 같은 결과는 근시를 교 정하지 않고 검사를 시행하였을 때 녹내장이 발생한 것 으로 오진하거나 녹내장의 정도를 과대평가하는 오류가 발생할 수 있음을 시사한다고 할 수 있을 것이다.
Artes et al15의 연구에 따르면 굴절 이상의 영향은 정상 안에 비해 녹내장 안에서 더 큰 것으로 나타났는 데, 이와 같은 결과를 바탕으로 Artes et al은 이미 손 상된 시신경 섬유의 경우 약간의 굴절 이상에도 큰 영 향을 받을 것으로 추측하였다. 하지만 본 연구의 경우 녹내장성 손상이 심하지 않은 시야는 심하게 손상된 시 야에 비해 근시에 상대적으로 더 큰 영향을 받는 것으 로 나타나 Artes et al의 연구와는 다른 결과를 보였 다. 시신경 섬유의 손상 정도에 따라 굴절 이상의 영향 또한 다르게 나타날 가능성이 있을 것으로 추측되며, 이러한 효과에 의해 위와 같은 결과가 나타났을 것으로 생각된다. 경도 혹은 중등도의 손상을 받은 시야의 경 우 정상 시야에 비해 굴절 이상에 더 큰 영향을 받을 수 있으나 total deviation printout symbol에서
‘P<1.0%’ 혹은 ‘P<0.5%’의 이상을 보일 정도로 심하게 손상된 시야의 경우 이미 대부분의 신경섬유가 손상되 어 있기 때문에 비록 굴절 이상에 의해 초점이 흐려진 다고 해도 더 이상의 total deviation printout 값 저하가 발생할 여지가 적을 것으로 생각된다. 신경섬유 손상의 정도에 따른 굴절 이상의 효과를 정확히 밝혀내
기 위해서는 차후 연구가 필요할 것이다.
본 연구에서는 중심과 말초로 구분한 시야의 위치에 따른 근시의 영향은 유의한 차이가 나타나지 않았으며, 이는 기존의 FDT 시야검사를 대상으로 시행한 연구15 에서와 비슷한 결과였다.
근시안을 대상으로 Humphrey Matrix 30-2 test 를 시행한 결과 근시의 정도는 시야 검사의 MD 값의 변화에 영향을 주었다. 심한 녹내장성 시야 결손을 나 타낸 부위에는 근시의 영향이 상대적으로 적었으며, 중심시야와 주변시야는 근시에 의해 비슷한 영향을 받았다. 시야검사 결과를 해석할 때, 안경을 착용하 지 않는 경우 근시의 정도에 따라 MD 값이 영향을 받을 수 있음을 유의해야 할 것이며, 정확한 검사 결 과를 얻기 위해서는 근시를 교정한 후 검사를 시행해야 할 것이다.
참고문헌
1) Quigley HA, Dunkelberger GR, Green WR. Retinal ganglion cell atrophy correlated with automated perimetry in human eyes with glaucoma. Am J Ophthalmol 1989;107:453-64.
2) Kerrigan-Baumrind LA, Quigley HA, Pease ME, et al. Number of ganglion cells in glaucoma eyes compared with threshold visual field tests in the same persons. Invest Ophthalmol Vis Sci 2000;41:741-8.
3) Johnson CA, Adams AJ, Casson EJ, et al. Blue-on-yellow perimetry can predict the development of glaucomatous visual field loss. Arch Ophthalmol 1993;111:645-50.
4) Johnson ca, Adams AJ, Casson EJ, Brandt JD. Progression of early glaucomatous visual field loss as detected by blue-on-yellow and standard white-on-white automated perimetry. Arch Ophthalmol 1993;111:651-6.
5) Wall M, Ketoff KM, Random dot motion perimetry in patients with glaucoma and in normal subjects. Am J Ophthalmol 1995;120:587-96.
6) Bosworth CF, Sample SA, Gupta N, et al. Motion automated perimetry identifies early glaucomatous field defects. Arch Ophthalmol 1998;116:1153-8.
7) Glovinsky Y, Quigley HA, Pease ME. Foveal ganglion cell loss in size dependent on experimental glaucoma. Invest Ophthalmol Vis Sci 1991;32:484-91.
8) Quigley HA, Dunkelberger GR, Green WR. Chronic human glaucoma causing selectively greater loss of large optic nerve fibers. Ophthalmology 1988;95:357-63.
9) Kelly DH. Frequency doubling in visual responses. J Opt Soc Am 1966;56:1628-33.
10) Johnson CA, Samuels SJ. Screening for glaucomatous visual field loss with frequency-doubling perimetry. Invest Ophthalmol Vis Sci 1997;38:413-25.
11) Quigley HA. Identification of glaucoma-related visual field abnormality with the screening protocol of frequency doubling
technology. Am J Ophthalmol 1998;125:819-29.
12) Brusini P, Salvetat ML, Zeppieri M, Parisi L. Frequency doubling technology perimetry with the Humphrey Matrix 30-2 test. J Glaucoma 2006;15:77-83.
13) Ko BS, Kim CY, Hong YJ. Correlation between optic disc tomography and frequency doubling technology in glaucoma suspect. J Korean Ophthalmol Soc 2003;44:2040-6.
14) Anderson AJ, Johnson CA. Frequency-doubling technology perimetry and optical defocus. Invest Ophthalmol Vis Sci 2003;44:4147-52.
15) Artes PH, Nicolela MT, McCormick TA, et al. Effects of blur and repeated testing on sensitivity estimates with frequency doubling perimetry. Invest Ophthalmol Vis Sci 2003;44:646-52.
16) Ito A, Kawabata H, Fujimoto N, Adachi-Usami E. Effect of myopia on frequency-doubling perimetry. Invest Ophthalmol Vis Sci 2001;42:1107-10.
17) Heeg GP, Stoutenbeek R, Jansonius NM. Strategies for improving the diagnostic specificity of the frequency doubling perimeter. Acta Ophthalmol Scand 2005;83:53-6.
18) Heeg GP, Ponsioen TL, Jansonius NM. Learning effect, normal range, and test-retest variability of Frequency Doubling Perimetry as a function of age, perimetric experience, and the presence or absence of glaucoma. Ophthalmic Physiol Opt 2003;23:535-40.
19) Joson PJ, Kamantigue ME, Chen PP. Learning effects among perimetric novices in frequency doubling technology perimetry.
Ophthalmology 2002;109:757-60.
20) Iester M, Capris P, Pandolfo A, et al. Learning effect, short-term fluctuation, and long-term fluctuation in frequency doubling technique. Am J Ophthalmol 2000;130:160-4.
21) Brush MB, Chen PP. Test-retest variability in glaucoma patients tested with C-20-1 screening-mode frequency doubling technology perimetry. J Glaucoma 2004;13:273-7.
22) Adams CW, Bullimore MA, Wall M, et al. Normal aging effects for frequency doubling technology perimetry. Optom Vis Sci 1999;76:582-7.
23) Legge GE, Mullen KT, Woo GC, Campbell FW. Tolerance to visual defocus. J Opt Soc Am A 1987;4:851-63.
24) Brusini P, Salvetat ML, Zeppieri M, Parisi L. Frequency doubling technology perimetry with the Humphrey Matrix 30-2 test. J Glaucoma 2006;15:77-83.
25) Kogure S, Toda Y, Crabb D, et al. Agreement between frequency doubling perimetry and static perimetry in eyes with high tension glaucoma and normal tension glaucoma. Br J Ophthalmol 2003;87:604-8.
26) Anderson AJ, Johnson CA, Fingeret M, et al. Characteristics of the normative database for the Humphrey matrix perimeter.
Invest Ophthalmol Vis Sci 2005;46:1540-8.
27) Haymes SA, Hutchison DM, McCormick TA, et al.
Glaucomatous visual field progression with frequency-doubling technology and standard automated perimetry in a longitudinal prospective study. Invest Ophthalmol Vis Sci 2005;46:547-54.
=ABSTRACT=
The Effect of Myopic Optical Defocus on the Humphrey Matrix 30-2 Test
Jae Hui Kim, M.D., Changwon Kee, M.D.
Department of Ophthalmology, Samsung Medical Center, Sungkyunkwan University School of Medicine, Seoul, Korea
Purpose: To investigate the effect of myopic optical defocus on Humphrey Matrix 30-2 test.
Methods: Twenty-nine myopic eyes of 29 patients underwent 2 consecutive tests with the Humphrey Matrix 30-2 threshold program. The first and second tests were performed with and without correction for myopia.
Differences between the mean deviation (∆MD) and the pattern standard deviation (∆PSD) were calculated, and a correlation between the spherical equivalent (SE) and ∆MD and ∆PSD was investigated. The influence of optical defocus according to the visual field (central and peripheral) and the severity of glaucomatous visual field damage (area with total deviation plot of ‘P<0.1%’ or ‘P<0.5%’ and the other area) were also evaluated.
Results: The correlation between SE and ∆MD was significant (p=0.02, r=0.62). However, the correlation between SE and ∆PSD was not significant (p=0.81, r=0.15). The differences in the mean total deviation printout value of the central and peripheral visual field groups between the two tests were 5.85±4.26dB and 5.66±3.56dB, respectively (P=0.86). The differences in the mean total deviation printout value of severely damaged and less damaged areas between the two tests were 3.16±3.39dB and 6.62±4.62dB, respectively (P<0.01).
Conclusions: Myopic optical defocus has a significant effect on the results of the Humphrey Matrix 30-2 test.
There is no difference in the effect of myopia between the central and peripheral visual fields, and the effect is decreased in severely damaged visual fields.
J Korean Ophthalmol Soc 49(1):119-124, 2008 Key Words: FDT, Humphrey, Matrix, Myopia
Address reprint requests to Changwon Kee, M.D.
Department of Ophthalmology, Samsung Medical Center, Sungkyunkwan University School of Medicine
#50 Ilwon-dong, Gangnam-gu, Seoul 130-710, Korea
Tel: 82-2-3410-3564, Fax: 82-3410-0074, E-mail: [email protected]