Research Article
Evaluation of Forage Productivity and Nutritional Value of Kenaf (Hibiscus cannabinus L.) at Different Fertilizer Application Amounts and Different
Stages of Maturity
Byamungu Mayange Tomple and Ik-Hwan Jo*
Department of Animal Resources, College of Natural and Life Sciences, Daegu University, Gyeongsan, 38453, South Korea
ABSTRACT
The purpose of this study was to assess the forage productivity and nutritive value of kenaf at different fertilizer application amounts and various stages of maturity. The experiment was conducted from May to September 2020, the amount of 80 kg of kenaf seed/ha was supplied with different types and amounts of nitrogen fertilizer and the plants were harvested at 10-day intervals from different harvesting dates (24th August and 3rd, 13th, 23rd September). According to the different fertilizer types and application amounts, the highest kenaf height was recorded in the inorganic fertilizer amounts of 200 and 250 kg N/ha and the fresh and DM yield were significantly improved in the inorganic nitrogen amount of 250 kg N/ha. The highest CP and TDN content in the leaf was achieved in the inorganic fertilizer amounts of 150 and 200 kg N/ha, respectively; and the highest TDN content in the stem was also found in the inorganic fertilizer amount of 200 kg N/ha. According to the different harvesting dates, the highest DM ratio was found in the harvesting date of 13th September, the leaf ratio increased with advanced maturity, whereas the stem ratio decreased significantly and the highest DM yield of kenaf was recorded in the harvesting dates of 13th and 23rd September. Besides, the highest CP, CF, CA, ADF, NDF and TDN content in the leaf as influenced by different harvesting dates was 15.4, 31.8, 10.2, 22.1, 34.7 and 76.5%, respectively, and the CP, CA, ADF and TDN in stem decreased significantly with advanced maturity of kenaf. In conclusion, the optimal fertilizer amounts and the appropriate harvesting dates for a high forage yield and high-quality kenaf as livestock feed were the inorganic fertilizer application amounts of 200-250 kg N/ha and from 13th and 23rd September, respectively.
(Key words: Forage productivity, Harvesting dates, Inorganic and Organic fertilizer, Kenaf, Nutritive value)
Ⅰ. INTRODUCTION
Annual crops such as kenaf (Hibiscus canabinus L.) may be able to meet characteristics required for feedstock in the livestock sector in Korea and can be integrated into the existing cropping system because they require minimal inputs to achieve maximum production in a shorter period of time (Anifinrud et al., 2013). As a summer crop, kenaf is usually planted during spring and harvested in early autumn. Since it grows very fast, kenaf can be harvested in 3 to 4 months after sowing (Sim and Nyam, 2021) and the selection of the appropriate harvest maturity and cultivar are all important factors that contribute to achieving maximum protein and dry matter production (Kipriotis et al., 2015). Kenaf belongs to the Malvales order, Malvaceae family, and Hibiscus genus (Ayadi et al., 2017) and also showed its versatile utility as a functional
ingredient in food and animal nutrition (Sim and Nyam, 2021).
Their contents in main nutrients, as protein, carbohydrates, fats and minerals appear very satisfactory, combined with good palatability and digestibility (Kipriotis et al., 2015). Kenaf is considered to be a high-protein feed (Aminah et al., 2006) and is suggested to be suitable as a protein supplement for livestock feed (Mohd et al., 2014). Liang et al., (2003) reported that kenaf feed has positive effects on the growth, milk yield and milk quality of goats. Noori et al., (2016) stated that the crude protein of forage is one of the most important criteria in forage quality; and high crude protein is considered a favorable trait for forage production because it contains amino acids that are useful for animal growth and milk production. The kenaf seed had the highest crude protein 30.2% and fat 22%, followed by leaves, flowers and stem (Sim and Nyam, 2021). Islam et al., (2011) reported that differences in the combination of organic
*Corresponding author : Ik-Hwan Jo, Department of Animal Resources, College of Natural and Life Sciences, Daegu University, Gyeongsan 38453, Korea, Tel: ***-****-**** Fax: +82-53-850-6729, E-mail: [email protected]
and inorganic fertilizers significantly affected plant growth and yield. Mohd et al., (2014) reported that kenaf is considered to be a nutrient-demanding crop and Othman et al. (2006) suggested an optimal nitrogen application amount of 300 kg N/ha in sandy soils. However, there are few reports regarding the cultivation, growth and use of kenaf as a livestock feed.
Therefore, this study was conducted to evaluate the forage productivity and nutritive value of kenaf as feed at different inorganic and organic fertilizer application amounts and different stages of maturity, in order to enhance the livestock sector.
Ⅱ. MATERIALS AND METHODS
This research was conducted from 16th May to 23rd September 2020 at the experimental field of Daegu University in Yeongcheon, in the southeast of Gyeongbuk Province, South Korea at the Geological coordinates: latitude: 35°54'11.12" N and longitude: 128°51'22.67" E. Plant species used was
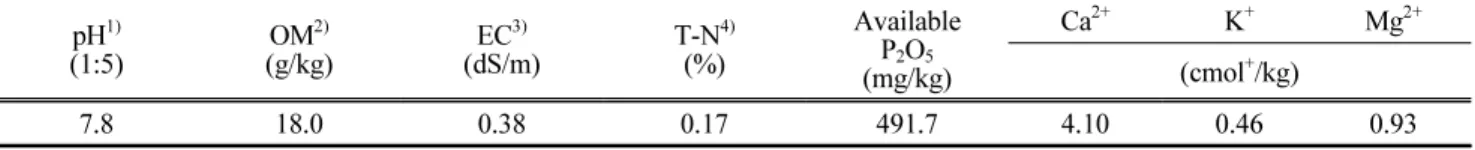
“Hongma 74-3” which is one of the varieties of kenaf (Hibiscus cannabinus L.). The initial physicochemical properties of the soil before amending with different inorganic and organic fertilizers are presented in Table 1 and consisted mainly of a mixture of sand and mud. Its physicochemical properties were favorable and showed no negative effect on the growth of kenaf in 2020. The sowing amount of 80 kg/ha of seed was applied with a planting density of 20 cm × 20 cm (made by hand on dry soil) and width measurement of 5 m
× 1 m was prepared for the planting of kenaf according to the standard application rate of kenaf. Kenaf was evaluated under a strip plot design method in triplicates using 4 different harvesting dates (24th August and 3rd, 13th, 23rd September 2020), with 3 different amounts of inorganic fertilizer (I1: 150, I2: 200 and I3: 250 kg of N/ha) and 3 different amounts of compost (O1: 150, O2: 200 and O3: 250 kg of N/ha). Plot zero
was used as the control as neither inorganic or organic fertilizer was applied. The growth characteristics and forage yield surveys such as plant height, fresh matter yield, leaf ratio, stem ratio and dry matter yield, respectively; were investigated according to the standardization of research survey on agricultural science and technology (RDA, 2012).
Samples were taken from each test section and dried in a 70
℃ circulating air dryer for 72 hours or more and then weighed after drying. The collected samples were first crushed by an electric mixer and then passed through a 2.0 mm standard, which was placed in a plastic sample storage bottle and the amount required for the experiment was used for sampling and analysis. The chemical composition analysis was performed according to the scientific methods of AOAC (2000). The crude protein (CP) content was determined through the Kjeldahl digestion method using quantitative determination of organic nitrogen. Crude fat content was also determined by extracting the fat from the sample using a solvent, then determining the weight of the fat recovered. Fiber analysis like neutral detergent fiber (NDF) and acid detergent fiber (ADF) was made by Van-Soest et al., (1991) method and the total digestible nutrients (TDN) were calculated by the following formula of Linn and Martin (1989). TDN = 88.9 - (0.79 × ADF)
Statistical analysis of all data obtained in this experiment was carried out with a two-way analysis of variance on forage yield and quality of kenaf according to different harvest periods and fertilization amounts (Inorganic/Organic) by SAS Statistical Package Program (version 9.1; SAS Institute Inc.;
Cary, USA) and the significant differences among the treatment were determined at 5% probability level by using the least significant difference (LSD).
Table 1. Physicochemical properties of the experimental soils pH1)
(1:5) OM2)
(g/kg) EC3)
(dS/m) T-N4)
(%)
Available P2O5
(mg/kg)
Ca2+ K+ Mg2+
(cmol+/kg)
7.8 18.0 0.38 0.17 491.7 4.10 0.46 0.93
1)pH: potential of hydrogen, 2)OM: organic matter, 3)EC: electric conductivity, 4)T-N: total nitrogen, available phosphorus (P2O5)
Ⅲ. RESULTS AND DISCUSSIONS 1. Variations in the meteorological characteristics of
the experimental site
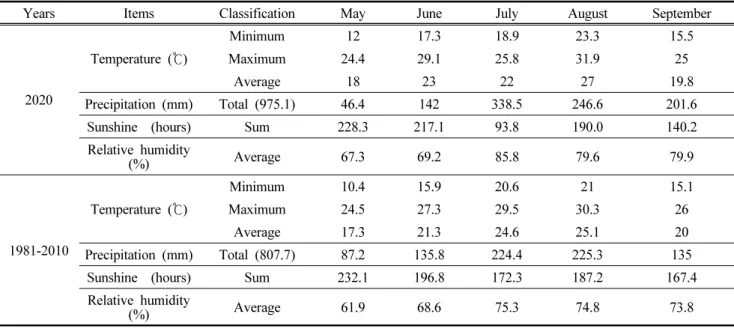
Table 2 shows the average temperature and precipitation of the experiment area. The average temperature in 2020 and 30-year averages gradually increased from May to August (from 18 to 27 °C in 2020 and 17.3 to 25.1 °C for the historical mean) and decreased significantly in September.
Archontoulis et al., (2005) reported that the optimum temperature for kenaf growth was in the range of 25-29 °C.
The average temperature in 2020 was slightly lower than the 30-year average. The maximum temperature in 2020 and 30-year averages was recorded in August and was 31.9 and 30.3 °C, respectively. During the experimental period in 2020, the level of precipitation increased from 46 to 338 mm and 87.2 to 225 mm for the historical mean, but the experimental in 2020 was 167.4 mm more than the 30-year average which is considered to reflect the recent effects of global warming.
The duration of sunshine decreased significantly during the experimental process and was less compared to the 30-year average, and the highest relative humidity was observed in July.
2. Variations in the growth characteristics and dry matter yield of kenaf according to different sources
of nitrogen
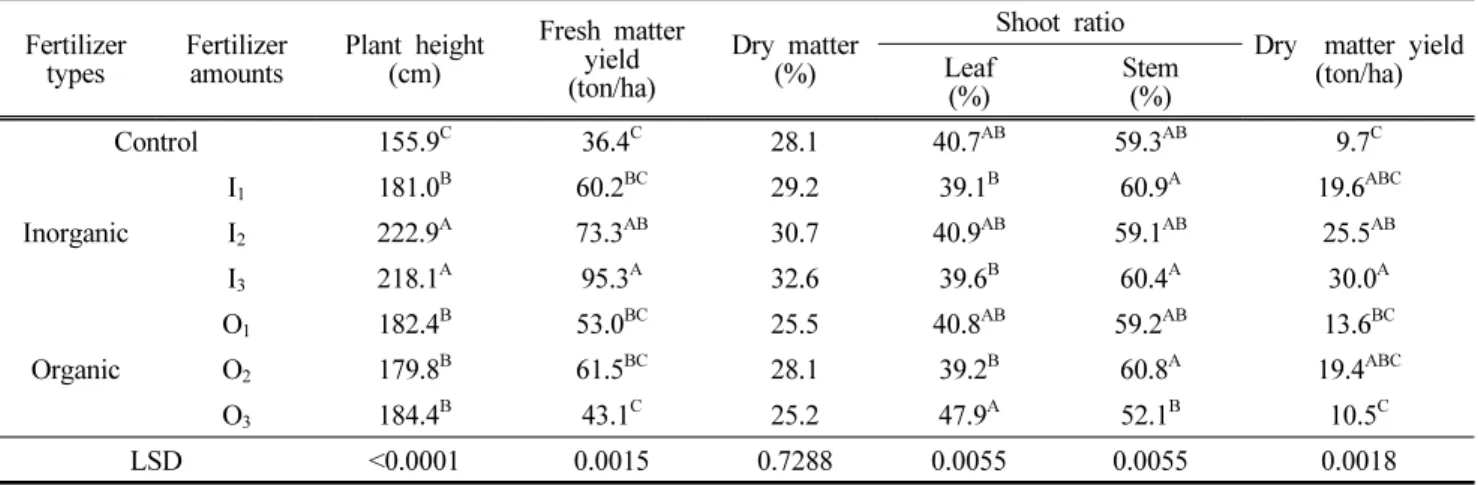
Table 3 shows the plant height, the total fresh matter yield, DM ratio, leaf ratio, stem ratio and DM y ield of kenaf as influenced by different inorganic fertilizer amounts (Control, I1, I2 and I3) and organic fertilizer amounts (Control, O1 O2 and O3). The highest kenaf height was achieved in the inorganic fertilizer application amounts I2 and I3 which was 222.9 and 218.1 cm, respectively (p<0.05) and the inorganic fertilizer application amount I1 was similar to the organic fertilizer application amounts O1, O2 and O3. In this study, comparing the different fertilizer types, the plant height in the inorganic fertilizers were significantly higher than the organic fertilizers and tended to increase in both fertilizers. Chew et al., (1982) reported that when the nitrogen fertilization increased the plant height and the stem yields were also significantly increased and Kang et al., (2018) compared different organic fertilizers with chemical fertilizer and found out that kenaf significantly improved and was higher than other fertilizer applications, which supports the findings of this study. The total fresh forage productivity and the DM yield as influenced by different inorganic and organic fertilizer amounts were significantly improved in the highest dose of the inorganic nitrogen amount I3, which were 95.3 and 30 ton/ha, respectively. Islam et al., (2011) stated that differences in the combination of organic and inorganic fertilizer applications significantly affected plant growth and yield. In this study, O2 is where we found the
Table 2. Monthly meteorological data during the experimental period
Years Items Classification May June July August September
2020
Temperature (℃)
Minimum 12 17.3 18.9 23.3 15.5
Maximum 24.4 29.1 25.8 31.9 25
Average 18 23 22 27 19.8
Precipitation (mm) Total (975.1) 46.4 142 338.5 246.6 201.6
Sunshine (hours) Sum 228.3 217.1 93.8 190.0 140.2
Relative humidity
(%) Average 67.3 69.2 85.8 79.6 79.9
1981-2010
Temperature (℃)
Minimum 10.4 15.9 20.6 21 15.1
Maximum 24.5 27.3 29.5 30.3 26
Average 17.3 21.3 24.6 25.1 20
Precipitation (mm) Total (807.7) 87.2 135.8 224.4 225.3 135
Sunshine (hours) Sum 232.1 196.8 172.3 187.2 167.4
Relative humidity
(%) Average 61.9 68.6 75.3 74.8 73.8
highest total fresh forage productivity and DM yield of kenaf as influenced by different organic fertilizer amounts only. The DM ratio of kenaf as influenced by different inorganic and organic fertilizer amounts showed no significant differences between all the treatments, the highest leaf ratio was found in the organic fertilizer amount O3 and the stem ratio of kenaf showed no statistical difference between the control, the inorganic fertilizer amount I2 and the organic fertilizer amount O2. In this study, the leaf ratio as influenced by different organic fertilizer amounts only tended to increase whilst the stem ratio decreased significantly with increasing nitrogen dose contains in the organic fertilizer. A similar observation was made in the study of Jo and Byamungu (2020) who found that the leaf ratio increased and the stem ratio decreased significantly as the growth of kenaf progressed consecutively with increasing organic fertilizer levels from 200 to 250 kg of N/ha.
3. Variations in the growth characteristics and dry matter yield of kenaf according to the different stages of maturity and fertilizer amounts
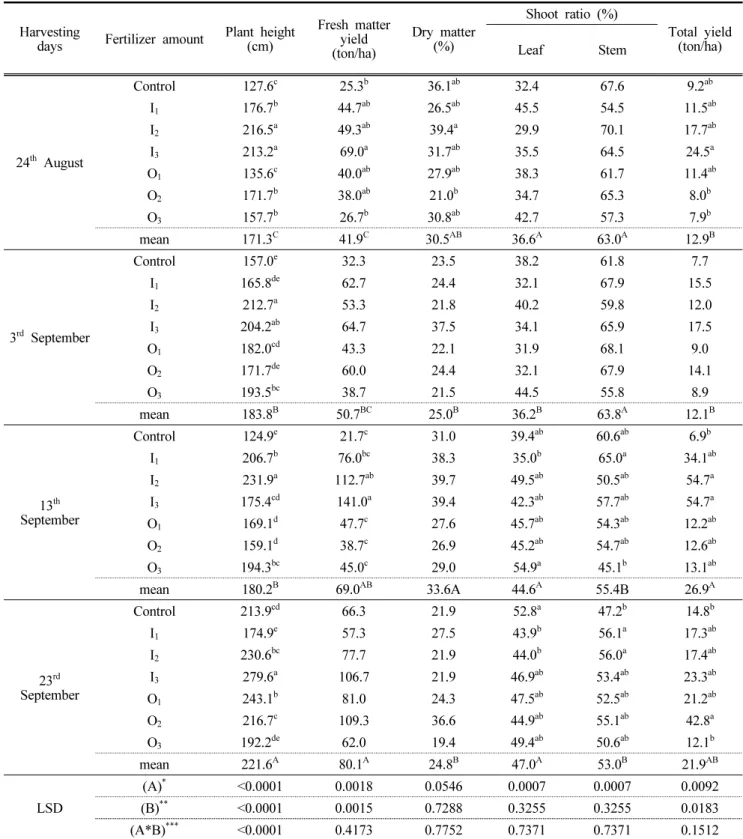
Table 4 shows the plant height, the total forage yield, DM ratio, leaf ratio, stem ratio and DM yield of kenaf as influenced by different harvesting dates (24th August and 3rd, 13th, 23rd September) and fertilizer amounts. In this research, the plant height increased consecutively as the growth of kenaf progressed. This affirmation is supported by the findings of Patanè and Cosentino (2013) with kenaf under reduced water
and nitrogen soil availability area who reported that the height of kenaf had increased as the harvest date was delayed from 30 to 170 days after sowing. As well as this, Danalatos et al., (2010) found that the plant height of kenaf increased almost linearly until flowering when stem elongation ceased due to the transition to the reproductive stage and the greater final height was due to the longer period available for vegetative growth.
On the other hand, the highest total fresh forage productivity in this study was found in the late harvesting date of September (23rd September) and was 80.1 ton/ha. Contrary to the findings of Jo and Byamungu (2020), this study showed significant differences between different harvesting dates and the total fresh matter yield was significantly higher compared to their findings due to some period of significant rainfall during this growing process. The DM ratio of the harvest of 24th August and, 23rd September were similar (p>0.05) and the highest DM ratio was found in the Mid-September harvest (13th September). While the leaf ratio increased with the advanced maturity of kenaf, the stem ratio tended to decrease significantly. Similar findings were reported by Nam et al.
(2018) with kenaf harvested at different stages of maturity. The highest DM yield of kenaf in this study was recorded in the late harvesting dates of September (13th and 23rd September 2020, respectively) and the DM yield in the harvest of 24th August and, 3rd September was similar (p>0.05). Muchow and Wood (1980) reported that the distribution of precipitation had a greater effect on kenaf yield than total growing season precipitation. Additionally, another study conducted by Massey Table 3. Effect of different inorganic and organic fertilizer application amounts on agronomic traits and matter yield of kenaf
Fertilizer
types Fertilizer
amounts Plant height (cm)
Fresh matter yield (ton/ha)
Dry matter (%)
Shoot ratio
Dry matter yield (ton/ha) Leaf
(%) Stem
(%)
Control 155.9C 36.4C 28.1 40.7AB 59.3AB 9.7C
Inorganic
I1 181.0B 60.2BC 29.2 39.1B 60.9A 19.6ABC
I2 222.9A 73.3AB 30.7 40.9AB 59.1AB 25.5AB
I3 218.1A 95.3A 32.6 39.6B 60.4A 30.0A
Organic
O1 182.4B 53.0BC 25.5 40.8AB 59.2AB 13.6BC
O2 179.8B 61.5BC 28.1 39.2B 60.8A 19.4ABC
O3 184.4B 43.1C 25.2 47.9A 52.1B 10.5C
LSD <0.0001 0.0015 0.7288 0.0055 0.0055 0.0018
a-c Different letters in the same column are statistically different (p<0.05). Inorganic fertilizer (I1: 150, I2: 200 and I3: 250 kg of N/ha) and Organic fertilizer (O1: 150, O2: 200 and O3: 250 kg of N/ha)
Table 4. Effect of different harvesting periods and nitrogen application amounts on agronomic traits and matter yield of kenaf
Harvesting
days Fertilizer amount Plant height (cm)
Fresh matter yield (ton/ha)
Dry matter (%)
Shoot ratio (%)
Total yield (ton/ha)
Leaf Stem
24th August
Control 127.6c 25.3b 36.1ab 32.4 67.6 9.2ab
I1 176.7b 44.7ab 26.5ab 45.5 54.5 11.5ab
I2 216.5a 49.3ab 39.4a 29.9 70.1 17.7ab
I3 213.2a 69.0a 31.7ab 35.5 64.5 24.5a
O1 135.6c 40.0ab 27.9ab 38.3 61.7 11.4ab
O2 171.7b 38.0ab 21.0b 34.7 65.3 8.0b
O3 157.7b 26.7b 30.8ab 42.7 57.3 7.9b
mean 171.3C 41.9C 30.5AB 36.6A 63.0A 12.9B
3rd September
Control 157.0e 32.3 23.5 38.2 61.8 7.7
I1 165.8de 62.7 24.4 32.1 67.9 15.5
I2 212.7a 53.3 21.8 40.2 59.8 12.0
I3 204.2ab 64.7 37.5 34.1 65.9 17.5
O1 182.0cd 43.3 22.1 31.9 68.1 9.0
O2 171.7de 60.0 24.4 32.1 67.9 14.1
O3 193.5bc 38.7 21.5 44.5 55.8 8.9
mean 183.8B 50.7BC 25.0B 36.2B 63.8A 12.1B
13th September
Control 124.9e 21.7c 31.0 39.4ab 60.6ab 6.9b
I1 206.7b 76.0bc 38.3 35.0b 65.0a 34.1ab
I2 231.9a 112.7ab 39.7 49.5ab 50.5ab 54.7a
I3 175.4cd 141.0a 39.4 42.3ab 57.7ab 54.7a
O1 169.1d 47.7c 27.6 45.7ab 54.3ab 12.2ab
O2 159.1d 38.7c 26.9 45.2ab 54.7ab 12.6ab
O3 194.3bc 45.0c 29.0 54.9a 45.1b 13.1ab
mean 180.2B 69.0AB 33.6A 44.6A 55.4B 26.9A
23rd September
Control 213.9cd 66.3 21.9 52.8a 47.2b 14.8b
I1 174.9e 57.3 27.5 43.9b 56.1a 17.3ab
I2 230.6bc 77.7 21.9 44.0b 56.0a 17.4ab
I3 279.6a 106.7 21.9 46.9ab 53.4ab 23.3ab
O1 243.1b 81.0 24.3 47.5ab 52.5ab 21.2ab
O2 216.7c 109.3 36.6 44.9ab 55.1ab 42.8a
O3 192.2de 62.0 19.4 49.4ab 50.6ab 12.1b
mean 221.6A 80.1A 24.8B 47.0A 53.0B 21.9AB
LSD
(A)* <0.0001 0.0018 0.0546 0.0007 0.0007 0.0092
(B)** <0.0001 0.0015 0.7288 0.3255 0.3255 0.0183
(A*B)*** <0.0001 0.4173 0.7752 0.7371 0.7371 0.1512
a-e Different letters in the same column are statistically different (p<0.05).
A-C Means in the column of every harvesting date with the different letter are significantly different (p<0.05). *Harvesting date, ** Fertilizer amount, ***Interaction between harvesting date and Fertilizer amount. Inorganic fertilizer (I1: 150, I2: 200 and I3: 250 kg of N/ha) and Organic fertilizer (O1: 150, O2: 200 and O3: 250 kg of N/ha)
(1974) reported that differences in kenaf yield occurred when rainfall in July and August totalled 339 mm versus 204 mm.
In this research, the DM yield of kenaf increased as the growth of plants progressed consecutively. In parallel research carried out with the same protocol, Jalal et al., (2012) found that the total DM yield of 6 kenaf cultivars increased significantly as the harvesting date was delayed.
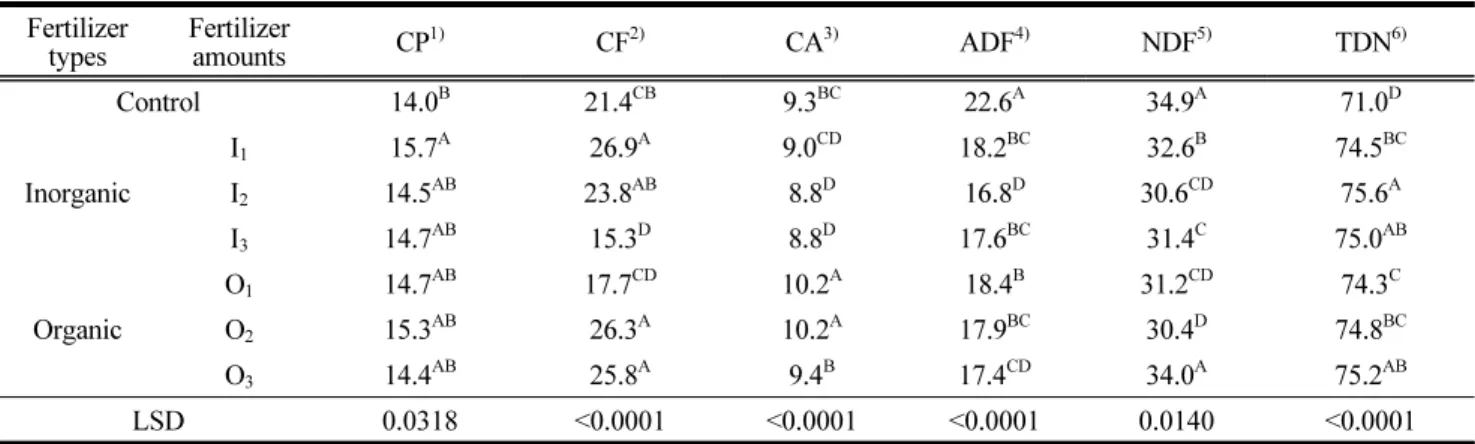
4. Variations in the nutritive value of kenaf (leaf and stem) according to different sources of nitrogen Table 5 and Table 6 show the CP, CF, CA, ADF, NDF and TDN content in the leaf and stem of kenaf as influenced by
different inorganic and organic fertilizer amounts. The highest CP content in the leaf as influenced by different inorganic and organic fertilizer amounts among all the treatments was achieved in the inorganic fertilizer application amount I1 and no significant difference was observed from the inorganic fertilizer amounts I2 and I3, and the organic fertilizer amounts O1, O2 and O3. On the other hand, the highest CP content in the stem was recorded in the organic fertilizer application amounts O1, O2 and O3 (150, 200 and 250 kg of N/ha, respectively). However, the CP content in the stem as influenced by different inorganic fertilizers only and organic fertilizers only tended to increased as we increased nitrogen
Table 5. Effect of different inorganic and organic fertilizer application amounts on the nutritional value (chemical composition, %) of kenaf leaf
Fertilizer
types Fertilizer
amounts CP1) CF2) CA3) ADF4) NDF5) TDN6)
Control 14.0B 21.4CB 9.3BC 22.6A 34.9A 71.0D
Inorganic
I1 15.7A 26.9A 9.0CD 18.2BC 32.6B 74.5BC
I2 14.5AB 23.8AB 8.8D 16.8D 30.6CD 75.6A
I3 14.7AB 15.3D 8.8D 17.6BC 31.4C 75.0AB
Organic
O1 14.7AB 17.7CD 10.2A 18.4B 31.2CD 74.3C
O2 15.3AB 26.3A 10.2A 17.9BC 30.4D 74.8BC
O3 14.4AB 25.8A 9.4B 17.4CD 34.0A 75.2AB
LSD 0.0318 <0.0001 <0.0001 <0.0001 0.0140 <0.0001
A-D Different letters in the same column are statistically different (p<0.05).
1)CP: Crude Protein, 2)CF: Crude Fat, 3)CA: Crude Ash, 4)ADF: Acid Detergent Fiber, 5)NDF: Neutral Detergent Fiber, 6)TDN: Total Digestible Nutrient, Inorganic fertilizer (I1: 150, I2: 20 0 and I3: 250 kg of N/ha) and Organic fertilizer (O1 150, O2: 200 and O3: 250 kg of N/ha) Table 6. Effect of different inorganic and organic fertilizer application amounts on the nutritional value (chemical
composition, %) of kenaf stem Fertilizer
types Fertilizer
amounts CP1) CF2) CA3) ADF4) NDF5) TDN6)
Control 2.1C 18.6A 7.1A 60.3BCD 70.2D 41.2ABC
Inorganic
I1 2.6B 20.4A 6.6B 61.6BC 74.1A 40.2BC
I2 3.0AB 17.0A 6.1C 58.7D 72.1C 42.5A
I3 2.9AB 11.9B 6.3C 59.8CD 73.1B 41.7AB
Organic
O1 3.2A 12.0B 7.2A 60.9BC 73.7AB 40.8ABC
O2 3.1A 19.0A 7.1A 62.6B 73.3B 39.5C
O3 3.3A 18.2A 6.6B 65.1A 73.7AB 37.4D
LSD <0.0001 <0.0001 <0.0001 <0.0001 <0.0001 <0.0001
A-D Different letters in the same column are statistically different (p<0.05).
1)CP: Crude Protein, 2)CF: Crude Fat, 3)CA: Crude Ash, 4)ADF: Acid Detergent Fiber, 5)NDF: Neutral Detergent Fiber, 6)TDN: Total Digestible Nutrient, Inorganic fertilizer (I1: 150, I2: 20 0 and I3: 250 kg of N/ha) and Organic fertilizer (O1150, O2: 200 and O3: 250 kg of N/ha)
dose from 0 to 250 kg of N/ha (p<0.05). In this study, the CP content in the leaf was higher than the CP content found in the stem. Similar studies reported by Noori et al., (2016) indicated that the CP content in the leaves was higher than the CP content in the stem because the low CP content in the stem was mainly due to a rapid accumulation of fibrous components.
The highest CF content in the leaf was found in the inorganic fertilizer application amount I1 and the organic fertilizer application amounts O2 and O3, whereas, the highest CF content in the stem was reported in the control, the inorganic fertilizer amounts I1 and I2 (150 and 200 kg N/ha, respectively) and the organic fertilizer amounts O2 and O3 (200 and 250 kg N/ha, respectively ). Although the CF content in the leaf and stem of I3 and O1 tended to be less than other treatments, the experiment's overall CF content was similar to that found by the study of Wong et al., (2008) and showed that they are still very concentrated sources of energy, when added to the animal feeds to increase the energy density of the ration. In this study, the highest CA content in leaf among all the treatments was found in the organic fertilizer application amounts O1 and O2
(p<0.05). INFIC(1978) data, indicated that the crude ash from dry leaves, fresh leaves and fresh stems was 11.8, 10.6 and 8.2%, respectively, which is slightly higher than the results of this study. The ADF content in the leaf did not show any statistical difference between the inorganic fertilizer application amounts I1 and I3 and the organic fertilizer application amount O2, whereas, the highest ADF content in the stem was found in the organic fertilizer application amount O3 (250 kg of N/ha) (p<0.05). In this study, the ADF content in the leaf tended to decrease with increasing inorganic nitrogen fertilizer amounts and the same observation was made when we increased organic fertilizer amounts, however the ADF in stem tried to increase with increasing organic fertilizer amounts. The ADF content in the leaf and stem in this study were ranged from 16.8 to 22.6%
and 58.7 to 65.1%, respectively. This was in agreement with the standard composition of kenaf leaf and stem by Noori et al., (2016) with 40 varieties of kenaf and found that the ADF content in the leaf and stem generally varies from 16 to 24%
and 50 to 58%, respectively with the average leaf and stem ADF being 20 and 54%, respectively. The highest NDF content in the leaf in this research was found in the control and the organic fertilizer application amount O3. On the other hand, the highest NDF content in stem among all the treatments was
found in the chemical fertilizer application amount I1 (150 kg of N/ha) and no significant difference was found between the inorganic fertilizer application amount I3 and the organic fertilizer application amount O2. The highest TDN content in the leaf among the treatments was recorded in the inorganic fertilizer application amount I2 (200 kg of N/ha) and the lowest was observed in the control (p<0.05). Whereas, the highest TDN content in the stem was achieved in the inorganic fertilizer application amount I2 (200 kg of N/ha) but the control and the organic fertilizer amount O1 (150 kg of N/ha) were similar.
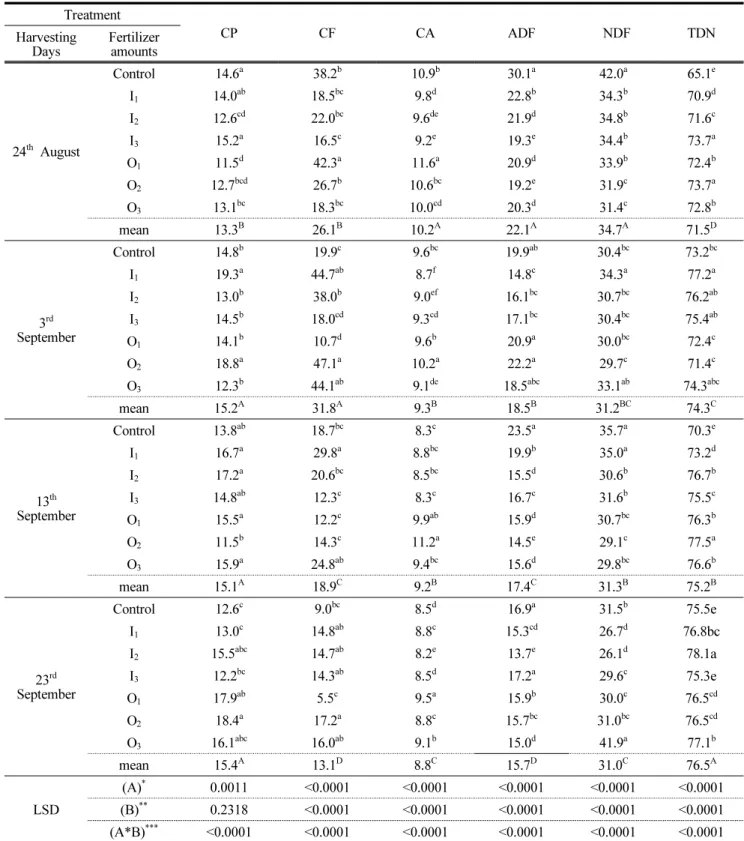
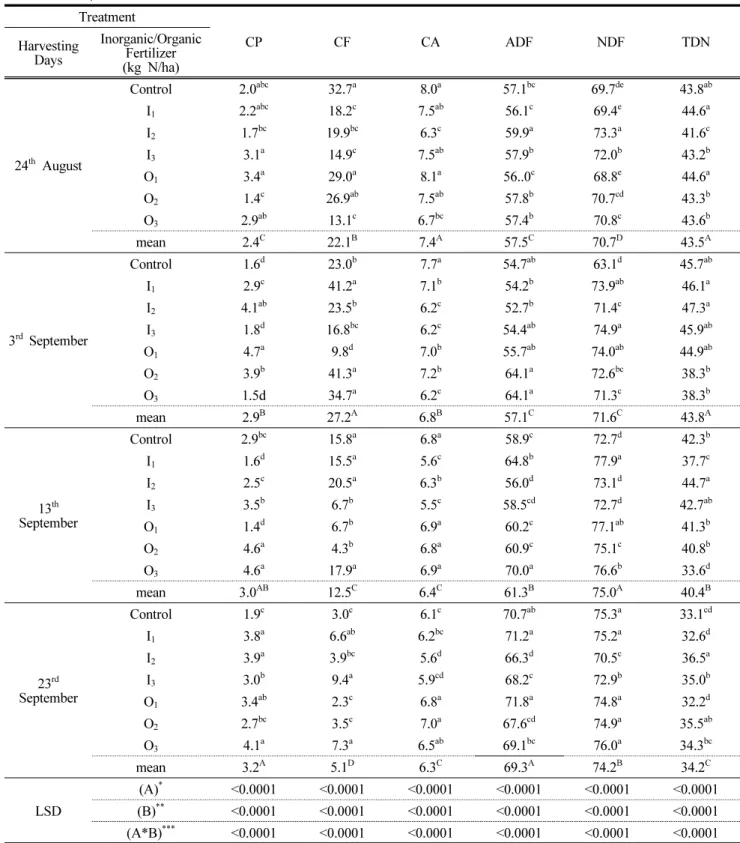
5. Variations in the nutritive value of kenaf (leaf and stem) according to different stages of maturity and fertilizer amounts
Table 7표안 and Table 8 show the CP, CF, CA, ADF, NDF and TDN content in the leaf and stem of kenaf as influenced by different harvesting dates (24th August and 3rd, 13th, 23rd September) and fertilizer amounts. The highest CP content in the leaf as influenced by different harvesting dates was achieved in the harvest of 3rd, 13th and 23rd September. But this finding contradicted the recent findings of Ammar et al., (2020) who reported that the protein concentration in leaves decreased significantly as the harvesting date was delayed from 50 to 75 days after planting. Different sowing and harvesting periods could be contributing factors to this disagreement in findings.
Noori et al., (2016) reported that kenaf leaves are the main source of protein which are made up of amino acids essential for animal growth and milk production. On the other hand, the highest CP content in stem in this study was recorded in the harvest of 23rd September. In this experiment, the CP content in the leaf and stem increased significantly with the advanced maturity of kenaf. However, the average CP content in this study was significantly higher than that reported by Jo and Byamungu (2020). In this study, the CP content in the leaf was higher than the CP content in the stem. This affirmation has also been confirmed by Ammar et al., (2020) who reported that leaf DM contained more (p<0.01) than twice the CP as stem DM at the same growth stage. The highest CF content in the leaf and stem were recorded during the harvesting date of 3rd September and the lowest CF content was observed during the late harvesting date of September. In general, as the harvest
Table 7. Effect of different harvesting dates and nitrogen application amounts on the nutritional value (chemical composition, %) of kenaf leaf
Treatment
CP CF CA ADF NDF TDN
Harvesting
Days Fertilizer amounts
24th August
Control 14.6a 38.2b 10.9b 30.1a 42.0a 65.1e
I1 14.0ab 18.5bc 9.8d 22.8b 34.3b 70.9d
I2 12.6cd 22.0bc 9.6de 21.9d 34.8b 71.6c
I3 15.2a 16.5c 9.2e 19.3e 34.4b 73.7a
O1 11.5d 42.3a 11.6a 20.9d 33.9b 72.4b
O2 12.7bcd 26.7b 10.6bc 19.2e 31.9c 73.7a
O3 13.1bc 18.3bc 10.0cd 20.3d 31.4c 72.8b
mean 13.3B 26.1B 10.2A 22.1A 34.7A 71.5D
3rd September
Control 14.8b 19.9c 9.6bc 19.9ab 30.4bc 73.2bc
I1 19.3a 44.7ab 8.7f 14.8c 34.3a 77.2a
I2 13.0b 38.0b 9.0ef 16.1bc 30.7bc 76.2ab
I3 14.5b 18.0cd 9.3cd 17.1bc 30.4bc 75.4ab
O1 14.1b 10.7d 9.6b 20.9a 30.0bc 72.4c
O2 18.8a 47.1a 10.2a 22.2a 29.7c 71.4c
O3 12.3b 44.1ab 9.1de 18.5abc 33.1ab 74.3abc
mean 15.2A 31.8A 9.3B 18.5B 31.2BC 74.3C
13th September
Control 13.8ab 18.7bc 8.3c 23.5a 35.7a 70.3e
I1 16.7a 29.8a 8.8bc 19.9b 35.0a 73.2d
I2 17.2a 20.6bc 8.5bc 15.5d 30.6b 76.7b
I3 14.8ab 12.3c 8.3c 16.7c 31.6b 75.5c
O1 15.5a 12.2c 9.9ab 15.9d 30.7bc 76.3b
O2 11.5b 14.3c 11.2a 14.5e 29.1c 77.5a
O3 15.9a 24.8ab 9.4bc 15.6d 29.8bc 76.6b
mean 15.1A 18.9C 9.2B 17.4C 31.3B 75.2B
23rd September
Control 12.6c 9.0bc 8.5d 16.9a 31.5b 75.5e
I1 13.0c 14.8ab 8.8c 15.3cd 26.7d 76.8bc
I2 15.5abc 14.7ab 8.2e 13.7e 26.1d 78.1a
I3 12.2bc 14.3ab 8.5d 17.2a 29.6c 75.3e
O1 17.9ab 5.5c 9.5a 15.9b 30.0c 76.5cd
O2 18.4a 17.2a 8.8c 15.7bc 31.0bc 76.5cd
O3 16.1abc 16.0ab 9.1b 15.0d 41.9a 77.1b
mean 15.4A 13.1D 8.8C 15.7D 31.0C 76.5A
LSD
(A)* 0.0011 <0.0001 <0.0001 <0.0001 <0.0001 <0.0001
(B)** 0.2318 <0.0001 <0.0001 <0.0001 <0.0001 <0.0001
(A*B)*** <0.0001 <0.0001 <0.0001 <0.0001 <0.0001 <0.0001
a-e Different letters in the same column are statistically different (p<0.05).
A-D Means in the column of every harvesting date with different letters are significantly different (p<0.05). *Harvesting date, ** Fertilizer amount, ***Interaction between harvesting date and Fertilizer amount. Inorganic fertilizer (I1: 150, I2: 200 and I3: 250 kg of N/ha) and Organic fertilizer (O1: 150, O2: 200 and O3: 250 kg of N/ha)