INTRODUCTION
Fracture is a serious complication that often occurs in ad-
vanced chronic kidney disease (CKD) patients, causing pa- tients to often become bed-ridden (or have restricted ambula- tion) for a long time, and it also has detrimental effects on
Cystatin C is Better than Serum Creatinine
for Estimating Glomerular Filtration Rate to Detect Osteopenia in Chronic Kidney Disease Patients
Young Eun Kwon
1, Mi Jung Lee
1, Kyoung Sook Park
1, Seung Hyeok Han
1, Tae-Hyun Yoo
1, Kook-Hwan Oh
2, Joongyub Lee
3, Kyu Beck Lee
4, Wookyung Chung
5, Yeong-Hoon Kim
6, Curie Ahn
2, and Kyu Hun Choi
11Department of Internal Medicine, Yonsei University College of Medicine, Seoul;
2Department of Internal Medicine, Seoul National University, Seoul;
3Medical Research Collaborating Center, Seoul National University Hospital, Seoul;
4Department of Internal Medicine, Kangbuck Samsung Hospital, Sungkyunkwan University School of Medicine, Seoul;
5Division of Nephrology, Department of Internal Medicine, Gachon University Gil Medical Center, Incheon;
6Department of Nephrology, College of Medicine, Inje University, Busan, Korea.
Purpose: Recent studies have reported that loss of bone mass is associated with renal function decline and increased fracture
risks in chronic kidney disease (CKD) patients. The aim of this study was to investigate the best estimated glomerular filtration rate (eGFR) equation to detect osteopenia in CKD patients.
Materials and Methods: This was a cross-sectional study, and 780 patients aged 50 years or above were classified into normal
bone mass or osteopenia groups according to the -1.0 of T-scores at total hip and femur neck. Comparisons of area under the re- ceiver operating characteristic (ROC) curves (AUC) were performed to investigate significant differences among three eGFR for- mulas: Modification of Diet in Renal Disease, CKD-Epidemiology Collaboration (EPI) creatinine, and CKD-EPI cystatin C (CKD-EPI- Cys).
Results: The mean age was 61 years old and the proportion of females was 37.3%. The total hip osteopenia group showed lower
CKD-EPI-Cys eGFR levels (osteopenia group, 33.3±19.0 mL/min/1.73 m
2; normal group, 48.1±26.2 mL/min/1.73 m
2, p<0.001). In multiple logistic regression analysis, CKD-EPI-Cys eGFR was independently associated with osteopenia at the total hip (per 1 mL/min/1.73 m
2increase, odds ratio 0.98, 95% confidence interval 0.97–0.99, p=0.004) after adjusting for confounding variables.
ROC curve analyses indicated that CKD-EPI-Cys shows the largest AUC for osteopenia at the total hip (AUC=0.678, all p<0.01) and the femur neck (AUC=0.665, all p<0.05).
Conclusion: Decreased renal function assessed by CKD-EPI-Cys equation correlates with osteopenia better than creatinine-
based methods in CKD patients, and the CKD-EPI-Cys formula might be a useful tool to assess skeletal-related event risks.
Key Words: Renal insufficiency, chronic, bone diseases, metabolic, glomerular filtration rate
pISSN: 0513-5796 · eISSN: 1976-2437
Received: May 19, 2016 Revised: August 30, 2016 Accepted: September 13, 2016
Corresponding author: Dr. Kyu Hun Choi, Department of Internal Medicine, Yonsei University College of Medicine, 50-1 Yonsei-ro, Seodaemun-gu, Seoul 03722, Korea.
Tel: 82-2-2228-1953, Fax: 82-2-393-6884, E-mail: [email protected]
•The authors have no financial conflicts of interest.
© Copyright: Yonsei University College of Medicine 2017
This is an Open Access article distributed under the terms of the Creative Commons Attribution Non-Commercial License (http://creativecommons.org/licenses/by-nc/3.0) which permits unrestricted non-commercial use, distribution, and reproduction in any medium, provided the original work is properly cited.
Yonsei Med J 2017 Mar;58(2):380-387 https://doi.org/10.3349/ymj.2017.58.2.380
clinical outcomes and quality of life. The effect of mild to mod- erate renal dysfunction on increased fracture risk is consid- ered controversial, although it has been verified in a few stud- ies recently.
1-4The risks of fracture are known to be influenced by both quantity and quality of bone.
5Bone biopsy is a stan- dard method in order to diagnose bone quality and type of CKD-mineral bone disorder (MBD). However, due to its inva- siveness, bone biopsy is not used frequently in clinical set- tings. Even though bone mineral density (BMD) is a useful tool for evaluating bone quantity and fracture risk in the gen- eral population, its application in CKD patients has been lim- ited, as it has been shown that low BMD cannot predict risk of fracture in renal failure patients.
6Despite controversy sur- rounding BMD, recent studies have shown that CKD patients who experienced fracture had low bone mass in meta-analy- sis
7and osteoporosis assessed by dual-energy X-ray absorpti- ometry (DXA) can predict fracture risk in patients with CKD.
8,9These results suggest that BMD can serve as an alternative surrogate marker for fracture risk in CKD patients.
Renal clearance tests using inulin or inulin analogs are the gold standard for measuring glomerular filtration rate (GFR).
However, difficulties during the infusion procedure and risks of anaphylactic allergic reactions limit its routine clinical appli- cation. In addition, creatinine clearance rate calculated from 24-hour urine collection can estimate renal function. Howev- er, it is not convenient to collect urine specimens throughout a day. Clinically, serum creatinine levels are used to estimate renal function, although the accuracy of this approach is easi- ly affected by individual muscle mass variations and renal tu- bular secretion levels. On the other hand, a recent study has presented cystatin C as a more valid marker for renal function estimation, overcoming the limitations of serum creatinine.
10Several equations have been formulated to calculate estimated GFR (eGFR): Modification of Diet in Renal Disease (MDRD),
11CKD-Epidemiology Collaboration (CKD-EPI) creatinine (CKD-EPI-Cr),
12and CKD-EPI cystatin C (CKD-EPI-Cys).
10Cystatin C is known to be an effective marker of adverse out- comes in CKD patients, such as coronary artery disease, heart failure, and stroke.
13-15In addition, previous research has re- vealed that cystatin C acts as an inhibitor of bone resorption
in vitro16and that it possibly reflects hip fracture risks in older women.
17In light of this, we hypothesized that cystatin C-based eGFR might be more precisely correlated with loss of bone mass than creatinine-based eGFR. Among the eGFR methods described above, we aimed to identify the formula that would be optimal for correlating osteopenia in CKD patients by mea- suring BMD by DXA.
MATERIALS AND METHODS
Ethics
This study was performed in accordance with the Declaration
of Helsinki. It was approved by the Institutional Review Board at each participating hospital: Gachon University Gil Medical Center (GIRBA2553), The Catholic University of Korea Seoul St. Mary’s Hospital (KC11OIMI0441), Kangbuk Samsung Hos- pital (2011-01-076), Seoul National University Bundang Hos- pital (B-1106/129-008), Seoul National University Hospital (1104-089-359), Seoul Eulji Hospital (201105-01), Severance Hospital (4-2011-0163), Inje University Busan Paik Hospital (11-091), and Chonnam National University Hospital (CNUH- 2011-092). Written informed consent was provided by every participant in the study.
Study design and population
This study was cross-sectional in design, using patient-based cohort data from the KoreaN cohort study for Outcome in pa- tients With Chronic Kidney Disease (KNOW-CKD) study.
18KNOW-CKD study was performed over 5 years, from 2011 to 2015, and enrolled 2450 CKD patients at nine university hospi- tals in Korea. In the present study, we included only 1529 CKD patients who were enrolled until December 2013. In this study, we could not obtain Z-score data from BMD. Male pa- tients aged <50 years and pre-menopausal female patients were not suitable to diagnose osteopenia with only T-score data. The mean age of menopause in Korean women is 49.7 years old;
19therefore, we excluded patients aged <50 years (n=527). The patients who had missing data on cystatin C lev- els (n=169) or BMD T-scores (n=53) were also excluded. Fi- nally, 780 patients were included in the study.
Data collection
All data analyzed in this study were collected at study enroll- ment. Baseline demographic data included age, gender, body mass index (BMI), smoking status, blood pressure, and medi- cal histories, such as diabetes mellitus, hypertension, coro- nary artery disease, cerebrovascular disease, and congestive heart failure. Laboratory data included complete blood cell counts, blood urea nitrogen levels, serum creatinine and cys- tatin C levels, calcium and phosphate concentrations, lipid profiles, albumin levels, intact parathyroid hormone levels, 25-hydroxyvitamin D and 1,25-dihydroxyvitamin D concen- trations, and C-reactive protein levels. We collected 24-hour urine specimens to analyze daily urine protein and creatinine levels. Other methodological issues were described in our previous study.
18Creatinine and cystatin C measurement and eGFR formula
Serum creatinine levels were measured using an isotope dilu-
tion mass spectrometry (IDMS)-traceable method at a central
laboratory, and cystatin C concentration was assessed by im-
munonephelometry calibrated against the reference. We com-
pared three eGFR methods in this study: four-variable MDRD
by IDMS-traceable method (MDRD), creatinine-based CKD-
EPI (CKD-EPI-Cr), and cystatin C-based CKD-EPI (CKD-EPI- Cys). The formulas were taken from previous studies
10-12and are described in Supplementary Table 1 (only online). Addition- ally, we calculated eGFR using Korean-specific equations to compare with CKD-EPI-Cys formula (Supplementary Table 1, only online).
20BMD measurement
BMD was measured at baseline by DXA, and total hip and fe- mur neck T-scores were used to diagnose osteopenia. Spine BMD measurement can be misleading if there are anatomical abnormalities in the bone, extensive osteophyte formation, or aortic calcifications, thus we excluded L-spine T-score data in the analysis. The T-score was expressed as the number of stan- dard deviations of the BMD based on the mean value of a healthy, 30-year-old individual of the same gender and eth- nicity as the patient. Osteopenia was defined as a T-score un- der -1.0 at two pre-defined points (total hip and femur neck).
According to the definition of osteopenia, we divided the pa- tients into two groups: the normal bone mass group (T-score
>-1.0) and the osteopenia group (T-score ≤-1.0).
Statistical analyses
We performed statistical analyses using IBM SPSS for Windows, version 21 (IBM Corporation, Armonk, NY, USA). Numerical variables were expressed either as means±standard devia- tions for data with standard normal distributions or as medi- ans (interquartile range) for skewed data. Categorical vari- ables were expressed as numbers (percentages). We analyzed the differences between the groups using Student’s t-test or the Mann-Whitney U test for continuous variables and the chi-squared test for categorical variables. Multiple logistic re- gression analyses were performed to verify independent fac- tors related to osteopenia after adjusting for confounding variables. Receivers operating characteristic (ROC) curves were created for the eGFR calculation methods, and area un- der ROC curves (AUCs) were compared to identify the eGFR equation best correlated with osteopenia according to the method of DeLong, et al.
21Analyses related to ROC curves were performed using MedCalc
®for Windows, version 14.8.1 (Med- Calc Software, Ostend, Belgium). To make up for the difference of baseline renal function between normal bone mass group and osteopenia group, we conducted 1:1 propensity score matching (PSM) analysis according to the baseline CKD stage using IBM SPSS for Windows, version 23 (IBM Corporation).
RESULTS
Characteristics of the study subjects
Baseline demographic and laboratory data of all patients are presented in Table 1. Among a total of 780 patients, the mean age was 61.0±7.0 years and 291 (37.3%) were female. When
the patients were classified into groups according to CKD stage, the CKD stage 3 (42.7%) and stage 4 (29.4%) groups were the largest. In the entire cohort, 185 (23.7%) patients had osteope- nia at the total hip and 312 (40.0%) at the femur neck. At both pre-defined points, the proportion of female patients was high- er among the osteopenia patients, and the osteopenia pa- tients were generally older and had lower mean BMIs. The pa- tients in the normal bone mass group mainly had CKD stages 1 to 3, although the osteopenia group predominantly included CKD stage 4 and 5 patients. Co-morbid conditions were not statistically different between the two groups. With respect to laboratory data, the osteopenia group had higher blood urea nitrogen and cystatin C concentrations and lower mean eGFR levels than the normal bone mass group. However, serum cre- atinine levels in the osteopenia group were not higher, and the total hip osteopenia group showed statistically lower mean serum creatinine concentrations than the normal bone mass group for the total hip. In addition, serum calcium, 25-hy- droxyvitamin D, and 1,25-dihydroxyvitamin D levels were lower in the osteopenia group; however, serum phosphate and intact parathyroid hormone levels were higher in the osteope- nia group. Furthermore, 24-hour urine creatinine levels were lower in the osteopenia group for both total hip and femur neck osteopenia groups, and 24-hour urine protein concen- trations were not significantly different between the two groups.
eGFR as an independent factor associated with osteopenia
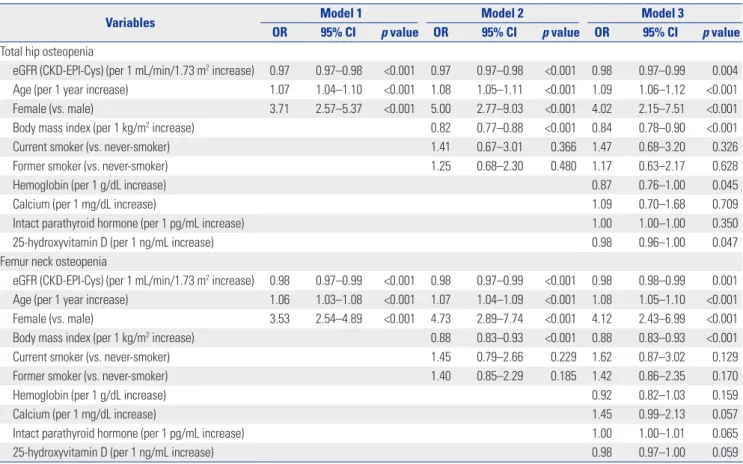
To identify the relationship between eGFR and osteopenia, multiple logistic regression analysis was performed using three models. All three models showed that eGFR calculated by CKD-EPI-Cys was independently associated with osteope- nia at the total hip after adjusting for confounding variables [odds ratio (OR) 0.98, 95% confidence interval (CI) 0.97–0.99,
p=0.004] (Table 2). Similarly, eGFR calculated by CKD-EPI-Cysshowed comparable results for osteopenia at the femur neck (OR 0.98, 95% CI 0.98–0.99, p=0.001). However, the models using creatinine-based eGFR data showed discordant results between total hip and femur neck assessments. Osteopenia at the femur neck correlated with results determined using cre- atinine-based eGFR methods (MDRD, CKD-EPI-Cr); results at the total hip, however, were not related to those determined using creatinine-based eGFR formulas (MDRD, CKD-EPI-Cr) (Supplementary Table 2 and 3, only online).
Comparison of osteopenia AUCs depending on eGFR formulas
We plotted three ROC curves to illustrate the relationship be-
tween osteopenia and eGFR and compared the AUCs to de-
termine which eGFR calculation was best correlated with os-
teopenia in CKD patients. Among the methods, CKD-EPI-Cys
had the largest AUC at the total hip (AUC 0.678, vs. MDRD,
p<0.001; vs. CKD-EPI-Cr, p=0.001) (Table 3) (Supplementary
Fig. 1, only online). At the femur neck, CKD-EPI-Cys also showed similar trends when we compared the AUC thereof
with those of the other eGFR formulas (AUC 0.665, vs. MDRD,
p=0.008; vs. CKD-EPI-Cr, p=0.011) (Table 3) (SupplementaryFig. 2, only online). The data comparing AUCs of Korean-spe-
Table 1. Baseline Demographic and Laboratory Data Total (n=780)
Total hip Femur neck
Normal (n=595)
Osteopenia
(n=185) p value Normal (n=468)
Osteopenia
(n=312) p value
Age (yr) 61.0±7.0 60.3±6.9 63.3±6.7 <0.001 59.9±6.7 62.6±7.1 <0.001
Female (%) 291 (37.3) 183 (30.8) 108 (58.4) <0.001 127 (27.1) 164 (52.6) <0.001
Body mass index (kg/m2) 24.5±3.0 24.8±2.9 23.5±3.0 <0.001 24.8±2.9 23.9±3.0 <0.001
CKD stage <0.001 <0.001
Stage 1 40 (5.1) 36 (6.1) 4 (2.2) 31 (6.6) 9 (2.9)
Stage 2 111 (14.2) 96 (16.1) 15 (8.1) 78 (16.7) 33 (10.6)
Stage 3 333 (42.7) 268 (45.0) 65 (35.1) 219 (46.8) 114 (36.5)
Stage 4 229 (29.4) 159 (26.7) 70 (37.8) 119 (25.4) 110 (35.3)
Stage 5 67 (8.6) 36 (6.1) 31 (16.8) 21 (4.5) 46 (14.7)
eGFR
MDRD (mL/min/1.73 m2) 41.8±23.5 44.4±23.8 33.7±20.5 <0.001 46.1±23.9 35.5±21.5 <0.001
CKD-EPI-Cr (mL/min/1.73 m2) 43.5±24.7 46.2±25.0 34.7±21.5 <0.001 48.0±24.9 36.7±22.8 <0.001 CKD-EPI-Cys (mL/min/1.73 m2) 44.6±25.4 48.1±26.2 33.3±19.0 <0.001 50.1±26.3 36.4±21.7 <0.001 Bone mineral density
T-score at total hip 0.0±1.3 0.5±0.9 -1.7±0.6 <0.001 0.7±0.9 -1.2±0.8 <0.001
T-score at femur neck -0.6±1.3 -0.1±1.0 -2.1±0.7 <0.001 0.3±0.9 -1.8±0.6 <0.001
Comorbidities
Diabetes mellitus 326 (42.3) 245 (41.7) 81 (44.0) 0.662 193 (42.0) 133 (42.8) 0.251
Hypertension 734 (95.2) 560 (95.4) 174 (94.6) 0.664 439 (95.4) 295 (94.9) 0.712
Coronary artery disease 87 (11.3) 67 (11.4) 20 (10.9) 0.518 54 (11.7) 33 (10.6) 0.826
Cerebrovascular disease 98 (12.7) 75 (12.8) 23 (12.5) 0.202 60 (13.0) 38 (12.2) 0.453
Congestive heart failure 8 (1.0) 5 (0.9) 3 (1.6) 0.404 3 (0.7) 5 (1.6) 0.279
Laboratory data
Hemoglobin (g/dL) 12.5±2.0 12.8±2.0 11.6±1.7 <0.001 12.9±2.0 11.9±1.8 <0.001
Blood urea nitrogen (mg/dL) 31.5±16.4 29.9±15.7 36.5±17.6 <0.001 28.8±14.7 35.5±18.0 <0.001
Creatinine (mg/dL) 1.1±0.5 1.2±0.5 1.0±0.5 0.002 1.1±0.5 1.1±0.5 0.549
Cystatin C (mg/L) 1.8±0.8 1.7±0.8 2.2± 0.9 <0.001 1.7±0.6 2.1±0.9 <0.001
Uric acid (mg/dL) 7.3±1.9 7.3±1.8 7.4±2.0 0.470 7.2±1.8 7.4±2.0 0.107
Calcium (mg/dL) 9.1±0.5 9.1±0.5 9.0±0.5 0.020 9.1±0.5 9.1±0.5 0.393
Phosphate (mg/dL) 3.7±0.7 3.7±0.7 3.9±0.6 0.001 3.6±0.7 3.9±0.7 <0.001
Albumin (g/dL) 4.2±0.4 4.2±0.4 4.1±0.4 0.415 4.2±0.4 4.2±0.4 0.936
Total cholesterol (mg/dL) 170.0±35.7 169.7±34.9 170.8±38.0 0.717 168.4±34.4 172.3±36.6 0.139
Intact parathyroid hormone (pg/mL) 51.5 (32.7–84.8) 48.0 (31.0–77.9) 69.3 (41.5–116.6) <0.001 48.0 (31.2–78.1) 65.4 (40.0–115.9) <0.001 C-reactive protein (mg/dL) 0.1 (0.0–0.2) 0.1 (0.0–0.2) 0.1 (0.0–0.5) 0.585 0.1 (0.0–0.2) 0.1 (0.0–0.7) 0.016
25-hydroxyvitamin D (ng/mL) 18.4±10.0 18.7±9.7 17.1±10.9 0.035 19.7±10.3 17.8±9.5 0.008
1,25-dihydroxyvitamin D (pg/mL) 31.8±17.2 32.8±17.7 27.4±13.9 <0.001 33.6±19.8 28.1±14.9 <0.001 24-hour urine protein (g/day) 0.5 (0.2–1.6) 0.5 (0.2–1.6) 0.6 (0.2–1.5) 0.103 0.6 (0.2–1.7) 0.6 (0.2–1.6) 0.346 24-hour urine creatinine (mg/day) 1168.7±415.0 1277.9±413.5 899.0±299.5 <0.001 1211.5±393.8 973.4±323.4 <0.001 Creatinine clearance (mL/min) 51.2±31.1 55.8±31.7 35.7±23.4 <0.001 58.2±32.3 40.1±25.5 <0.001 CKD, chronic kidney disease; CKD-EPI, Chronic Kidney Disease Epidemiology Collaboration; Cr, creatinine; Cys, cystatin C; eGFR, estimated glomerular filtration rate; MDRD, Modification of Diet in Renal Disease.
All continuous data are expressed as mean±standard deviation or median (interquartile range) as appropriate. CKD stage is defined using the MDRD eGFR val- ues: stage 1, ≥90 mL/min/1.73 m2; stage 2, 60–89 mL/min/1.73 m2; stage 3, 30–59 mL/min/1.73 m2; stage 4, 15–29 mL/min/1.73 m2; stage 5, <15 mL/
min/1.73m2. The number of patients who provided 24-hour urine was 736 (94.4%). Conversion factors for units: serum creatinine in mg/dL to μmol/L, ×88.4;
urea nitrogen in mg/dL to mmol/L, ×0.357.
cific eGFR equation and the CKD-EPI formula at two pre-de- fined points are provided in Supplementary Table 4 (only on- line). The AUC of the CKD-EPI equation was larger than that of the Korean-specific and creatinine based eGFR equation, and it was also statistically significant.
Propensity score matching analysis data
As shown in Table 1, baseline kidney function was different be- tween the normal bone mass group and osteopenia group. This could be a confounding factor to solidify the effect of cystatin C-based equation on osteopenia. For this reason, we con- ducted 1:1 PSM analysis according to baseline CKD stage. Af- ter PSM, 185 patients of each group were selected in regard to total hip osteopenia, and 312 patients of each group were
chosen for femur neck osteopenia. Table 4 lists the result after PSM analysis, and the AUC of CKD-EPI-Cys was the signifi- cantly largest among the AUCs of all three equations.
Subgroup analysis according to the gender
A previous study reported gender differences in BMD in the elderly.
22Therefore, we performed subgroup analysis to find differences according to gender (Table 5). As expected, the AUCs of the CKD-EPI-Cys were the biggest among the three methods irrespective of gender at both pre-defined points. In terms of osteopenia at the total hip, CKD-EPI-Cys was superi- or to the other formulas in men (vs. MDRD, p=0.003; vs. CKD- EPI-Cr, p=0.007), but not in women (vs. MDRD, p=0.054; vs.
Table 2. Multiple Logistic Regression Analysis for Osteopenia with eGFR by the CKD-EPI-Cys Formula
Variables Model 1 Model 2 Model 3
OR 95% CI p value OR 95% CI p value OR 95% CI p value Total hip osteopenia
eGFR (CKD-EPI-Cys) (per 1 mL/min/1.73 m2 increase) 0.97 0.97–0.98 <0.001 0.97 0.97–0.98 <0.001 0.98 0.97–0.99 0.004 Age (per 1 year increase) 1.07 1.04–1.10 <0.001 1.08 1.05–1.11 <0.001 1.09 1.06–1.12 <0.001
Female (vs. male) 3.71 2.57–5.37 <0.001 5.00 2.77–9.03 <0.001 4.02 2.15–7.51 <0.001
Body mass index (per 1 kg/m2 increase) 0.82 0.77–0.88 <0.001 0.84 0.78–0.90 <0.001
Current smoker (vs. never-smoker) 1.41 0.67–3.01 0.366 1.47 0.68–3.20 0.326
Former smoker (vs. never-smoker) 1.25 0.68–2.30 0.480 1.17 0.63–2.17 0.628
Hemoglobin (per 1 g/dL increase) 0.87 0.76–1.00 0.045
Calcium (per 1 mg/dL increase) 1.09 0.70–1.68 0.709
Intact parathyroid hormone (per 1 pg/mL increase) 1.00 1.00–1.00 0.350
25-hydroxyvitamin D (per 1 ng/mL increase) 0.98 0.96–1.00 0.047
Femur neck osteopenia
eGFR (CKD-EPI-Cys) (per 1 mL/min/1.73 m2 increase) 0.98 0.97–0.99 <0.001 0.98 0.97–0.99 <0.001 0.98 0.98–0.99 0.001 Age (per 1 year increase) 1.06 1.03–1.08 <0.001 1.07 1.04–1.09 <0.001 1.08 1.05–1.10 <0.001
Female (vs. male) 3.53 2.54–4.89 <0.001 4.73 2.89–7.74 <0.001 4.12 2.43–6.99 <0.001
Body mass index (per 1 kg/m2 increase) 0.88 0.83–0.93 <0.001 0.88 0.83–0.93 <0.001
Current smoker (vs. never-smoker) 1.45 0.79–2.66 0.229 1.62 0.87–3.02 0.129
Former smoker (vs. never-smoker) 1.40 0.85–2.29 0.185 1.42 0.86–2.35 0.170
Hemoglobin (per 1 g/dL increase) 0.92 0.82–1.03 0.159
Calcium (per 1 mg/dL increase) 1.45 0.99–2.13 0.057
Intact parathyroid hormone (per 1 pg/mL increase) 1.00 1.00–1.01 0.065
25-hydroxyvitamin D (per 1 ng/mL increase) 0.98 0.97–1.00 0.059
CI, confidence interval; CKD-EPI, Chronic Kidney Disease Epidemiology Collaboration; Cys, cystatin C; eGFR, estimated glomerular filtration rate; OR, odds ratio.
Table 3. p value of ROC Curves Pairwise Comparisons on Osteopenia at the Total Hip and Femur Neck
MDRD CKD-EPI-Cr CKD-EPI-Cys Total hip osteopenia
AUC 0.646 0.647 0.678
p value (vs. CKD-EPI-Cys) <0.001 0.001 - Femur neck osteopenia
AUC 0.645 0.645 0.665
p value (vs. CKD-EPI-Cys) 0.008 0.011 -
AUC, area under the ROC curve; CKD-EPI, Chronic Kidney Disease Epidemiol- ogy Collaboration; Cr, creatinine; Cys, cystatin C; MDRD, Modification of Diet in Renal Disease; ROC, receiver operating characteristic.
Table 4. p value of ROC Curves Pairwise Comparisons on Osteopenia at the Total Hip and Femur Neck after 1:1 Propensity Score Matching Ac- cording to Baseline Chronic Kidney Disease Stage
MDRD CKD-EPI-Cr CKD-EPI-Cys Total hip osteopenia
AUC 0.508 0.510 0.546
p value (vs. CKD-EPI-Cys) 0.003 0.005 -
Femur neck osteopenia
AUC 0.556 0.557 0.587
p value (vs. CKD-EPI-Cys) <0.001 0.001 - AUC, area under the ROC curve; CKD-EPI, Chronic Kidney Disease Epidemiol- ogy Collaboration; Cr, creatinine; Cys, cystatin C; MDRD, Modification of Diet in Renal Disease; ROC, receiver operating characteristic.
CKD-EPI-Cr, p=0.111). However, at the femur neck, CKD-EPI- Cys was not superior to the other formulas when assessing os- teopenia in both male and female patients, except when com- pared to MDRD in males (vs. MDRD, p=0.039).
DISCUSSION
We compared three eGFR formulas used to estimate renal function and osteopenia using BMD as a standard, and found that CKD-EPI-Cys was the best formula in CKD patients. For the first time, we used ROC curve analysis to demonstrate that the cystatin C-based eGFR formula was superior to conven- tional creatinine-based eGFR calculation methods to detect osteopenia in CKD patients.
CKD patients experience loss of bone mass accompanied by a decline in renal function, and the prevalence of fractures has been reported as 18–47% in CKD stage 3 and 4
2,3and 30–
52% in ESRD patients.
6,23Bone mass decline has been revealed as one of the factors associated with increased fracture risks in CKD patients recently, although current guidelines recom- mend not testing BMD in CKD patients. Therefore, there is an unmet clinical need for effective markers for predicting bone mass decline in CKD patients. Cystatin C recently came into the spotlight as a valid marker for estimating renal function, and some studies have reported that cystatin C-based eGFR equation is superior to creatinine-based eGFR ones in esti- mating renal function and predicting cardiovascular events.
13-15Furthermore, a recent study also proposed cystatin C as a pre- dictor of hip fracture risk in elderly female patients,
17and sev- eral previous studies regarding the association between mild decreased renal function assessed by cystatin C in the elderly and loss of bone mass have also been reported.
24-26However, little is known about the relationship between cystatin C and decreased bone mass determined by BMD in CKD patients, and further research is needed on this patient group.
We measured BMD using DXA in all patients at enrollment, and the results were analyzed by three eGFR formulas. As mentioned earlier, the Kidney Disease Improving Global Out- comes CKD-MBD guidelines recommend that BMD testing should not be performed routinely, because BMD cannot pre- dict fracture risks and the type of renal osteodystrophy in CKD
patients.
5However, several reports on general populations with mild renal function decline and bone loss,
1,24,26and recent studies with CKD patients have demonstrated contrasting re- sults: BMD can predict fracture risk in patients with CKD.
8,9,27Considering the invasiveness of bone biopsy, BMD assess- ment can be an effective method to predict fracture risk in CKD patients.
In this study, CKD-EPI-Cys had the largest AUC among the three eGFR calculation methods for reflecting osteopenia in CKD patients. In contrast to CKD-EPI-Cys, eGFR calculated using creatinine (MDRD and CKD-EPI-Cr) showed discrep- ancies between the two BMD measurement sites in reflecting osteopenia. All of these results consistently support the supe- riority of cystatin C-based eGFR formula over creatinine- based eGFR formulas for detecting osteopenia in CKD pa- tients. A previous study on women without clinical CKD (eGFR ≥60 mL/min/1.73 m
2) demonstrated a relationship be- tween increased risk of hip fracture and higher cystatin C lev- els, but not higher serum creatinine levels.
17We suggest that early changes in bone metabolism due to mild deterioration of renal function, including changes in calcium, phosphorus, and vitamin D homeostasis, cannot be easily detected by se- rum creatinine changes and that cystatin C could reflect these changes earlier than serum creatinine. We also suggest that individual muscle mass variations can hinder the accuracy of creatinine-based eGFR calculation methods. In patients with low muscle mass, creatinine-based eGFR might overestimate renal function, compared to measured GFR. Therefore, creati- nine-based eGFR formulas cannot accurately reflect renal function in patients with low muscle mass. Finally, cystatin C is not only implicated in renal function, but also has consider- able extrarenal effects that can impact outcomes.
15,28Therefore, other underlying mechanisms of cystatin C, such as interaction with inflammatory factors and direct effects on bone resorp- tion,
16,29,30might explain why cystatin C is particularly effective in predicting bone mass changes in CKD patients.
In addition, gender subgroup analysis showed that CKD- EPI-Cys was not statistically significantly associated with os- teopenia in female patients. The most plausible explanation for this is the relatively small number of the female patients included in the study. Nevertheless, we also speculate that the effect of menopause in females aged >50 years may play an
Table 5. p value of ROC Curve Pairwise Comparisons/Subgroup Analysis According to GenderMale MDRD CKD-EPI-Cr CKD-EPI-Cys Female MDRD CKD-EPI-Cr CKD-EPI-Cys
Total hip osteopenia
AUC 0.655 0.658 0.693 AUC 0.637 0.642 0.666
p value (CKD-EPI-Cys) 0.003 0.007 - p value (CKD-EPI-Cys) 0.054 0.111 -
Femur neck osteopenia
AUC 0.657 0.662 0.679 AUC 0.628 0.633 0.649
p value (CKD-EPI-Cys) 0.039 0.101 - p value (CKD-EPI-Cys) 0.113 0.211 -
AUC, area under the ROC curve; CKD-EPI, Chronic Kidney Disease Epidemiology Collaboration; Cr, creatinine; Cys, cystatin C; MDRD, Modification of Diet in Re- nal Disease; ROC, receiver operating characteristic.
important role in BMD changes, making it hard to diagnose osteopenia by CKD-EPI-Cys alone. Therefore, additional in- vestigations combining the effects of menopause and renal function decline are needed to predict bone mass changes in elderly female CKD patients.
Bone quantity and quality are the main factors contributing to bone force, and bone quantity decline has an additive ef- fect on increasing fracture risk in CKD-MBD patients. The evaluation of bone quality by bone biopsy is a proven-diag- nostic method to predict fracture risks in CKD-MBD patients.
5Therefore, high-risk patients need to be assessed for fracture earlier with respect to decreased bone mass, and using cystatin C to accurately assess renal function and predict skeletal events could be a useful tool in CKD patients.
This study has several limitations. First, we did not directly measure GFR, and thus, we could not compare eGFR with ac- curately measured GFR. Second, we could not obtain data about menopause, fracture history, and medication history, such as steroid use, as well as data about Z-score and mea- sured BMD values, muscle and lean body mass, and bone turnover markers. Due to these shortcomings, exclusion of the patients aged less than 50 years old may affect the results of this study. Third, this is a cross sectional study, and we did not check the incidence of fracture or serial BMD changes. Al- though our findings demonstrated an important aspect of de- terioration of renal function and low BMD, future investiga- tions taking into account fracture incidence data are needed.
Despite these caveats, this study emphasizes, for the first time, the importance of cystatin C-based eGFR in the detection of bone mass decline in CKD patients, and may provide clinical evidence that calls for early detection strategies to prevent loss of bone mass and fracture risks in CKD patients with cystatin C measurement.
In conclusion, deterioration of renal function assessed by CKD-EPI-Cys correlates with osteopenia better than eGFR calculated using creatinine-based methods in CKD patients.
CKD-EPI-Cys is the most powerful method for detecting os- teopenia among three eGFR formulas tested, suggesting it might be a useful tool for assessing the risk of skeletal events in CKD patients.
ACKNOWLEDGEMENTS
This work was supported by the Research Program funded by the Korea Centers for Disease Control and Prevention (2011E3300300, 2012E3301100, 2013E3301600).
REFERENCES
1. Kaji H, Yamauchi M, Yamaguchi T, Shigematsu T, Sugimoto T.
Mild renal dysfunction is a risk factor for a decrease in bone min- eral density and vertebral fractures in Japanese postmenopausal women. J Clin Endocrinol Metab 2010;95:4635-42.
2. Ensrud KE, Lui LY, Taylor BC, Ishani A, Shlipak MG, Stone KL, et
al. Renal function and risk of hip and vertebral fractures in older women. Arch Intern Med 2007;167:133-9.
3. LaCroix AZ, Lee JS, Wu L, Cauley JA, Shlipak MG, Ott SM, et al. Cys- tatin-C, renal function, and incidence of hip fracture in postmeno- pausal women. J Am Geriatr Soc 2008;56:1434-41.
4. Fried LF, Shlipak MG, Stehman-Breen C, Mittalhenkle A, Seliger S, Sarnak M, et al. Kidney function predicts the rate of bone loss in older individuals: the Cardiovascular Health Study. J Gerontol A Biol Sci Med Sci 2006;61:743-8.
5. Kidney Disease: Improving Global Outcomes (KDIGO) CKD-MBD Work Group. KDIGO clinical practice guideline for the diagnosis, evaluation, prevention, and treatment of Chronic Kidney Disease- Mineral and Bone Disorder (CKD-MBD). Kidney Int Suppl 2009;
(113): S1-130.
6. Jamal SA, Chase C, Goh YI, Richardson R, Hawker GA. Bone den- sity and heel ultrasound testing do not identify patients with dial- ysis-dependent renal failure who have had fractures. Am J Kidney Dis 2002;39:843-9.
7. Bucur RC, Panjwani DD, Turner L, Rader T, West SL, Jamal SA. Low bone mineral density and fractures in stages 3-5 CKD: an updated systematic review and meta-analysis. Osteoporos Int 2015;26:449- 58.
8. Yenchek RH, Ix JH, Shlipak MG, Bauer DC, Rianon NJ, Kritchevsky SB, et al. Bone mineral density and fracture risk in older individu- als with CKD. Clin J Am Soc Nephrol 2012;7:1130-6.
9. Iimori S, Mori Y, Akita W, Kuyama T, Takada S, Asai T, et al. Diag- nostic usefulness of bone mineral density and biochemical mark- ers of bone turnover in predicting fracture in CKD stage 5D pa- tients--a single-center cohort study. Nephrol Dial Transplant 2012;
27:345-51.
10. Inker LA, Schmid CH, Tighiouart H, Eckfeldt JH, Feldman HI, Greene T, et al. Estimating glomerular filtration rate from serum creatinine and cystatin C. N Engl J Med 2012;367:20-9.
11. Levey AS, Coresh J, Greene T, Stevens LA, Zhang YL, Hendriksen S, et al. Using standardized serum creatinine values in the modifica- tion of diet in renal disease study equation for estimating glomer- ular filtration rate. Ann Intern Med 2006;145:247-54.
12. Levey AS, Stevens LA, Schmid CH, Zhang YL, Castro AF 3rd, Feld- man HI, et al. A new equation to estimate glomerular filtration rate.
Ann Intern Med 2009;150:604-12.
13. Koenig W, Twardella D, Brenner H, Rothenbacher D. Plasma con- centrations of cystatin C in patients with coronary heart disease and risk for secondary cardiovascular events: more than simply a marker of glomerular filtration rate. Clin Chem 2005;51:321-7.
14. Madero M, Sarnak MJ. Association of cystatin C with adverse out- comes. Curr Opin Nephrol Hypertens 2009;18:258-63.
15. Peralta CA, Katz R, Sarnak MJ, Ix J, Fried LF, De Boer I, et al. Cys- tatin C identifies chronic kidney disease patients at higher risk for complications. J Am Soc Nephrol 2011;22:147-55.
16. Lerner UH, Johansson L, Ranjsö M, Rosenquist JB, Reinholt FP, Grubb A. Cystatin C, and inhibitor of bone resorption produced by osteoblasts. Acta Physiol Scand 1997;161:81-92.
17. Ensrud KE, Parimi N, Cauley JA, Ishani A, Slinin Y, Hillier TA, et al.
Cystatin C and risk of hip fractures in older women. J Bone Miner Res 2013;28:1275-82.
18. Oh KH, Park SK, Park HC, Chin HJ, Chae DW, Choi KH, et al.
KNOW-CKD (KoreaN cohort study for Outcome in patients With Chronic Kidney Disease): design and methods. BMC Nephrol 2014;15:80.
19. Kim IK, Choi HM, Kim MH. Menopausal knowledge and man- agement in peri-menopausal women. J Korean Soc Menopause 2012;18:124-31.
20. Lee CS, Cha RH, Lim YH, Kim H, Song KH, Gu N, et al. Ethnic co-
efficients for glomerular filtration rate estimation by the Modifi- cation of Diet in Renal Disease study equations in the Korean population. J Korean Med Sci 2010;25:1616-25.
21. DeLong ER, DeLong DM, Clarke-Pearson DL. Comparing the ar- eas under two or more correlated receiver operating characteris- tic curves: a nonparametric approach. Biometrics 1988;44:837-45.
22. Blunt BA, Klauber MR, Barrett-Connor EL, Edelstein SL. Sex dif- ferences in bone mineral density in 1653 men and women in the sixth through tenth decades of life: the Rancho Bernardo Study. J Bone Miner Res 1994;9:1333-8.
23. Ureña P, Bernard-Poenaru O, Ostertag A, Baudoin C, Cohen-Solal M, Cantor T, et al. Bone mineral density, biochemical markers and skeletal fractures in haemodialysis patients. Nephrol Dial Trans- plant 2003;18:2325-31.
24. Kim HL, Park IY, Choi JM, Hwang SM, Kim HS, Lim JS, et al. A de- cline in renal function is associated with loss of bone mass in Ko- rean postmenopausal women with mild renal dysfunction. J Ko- rean Med Sci 2011;26:392-8.
25. Fujita Y, Iki M, Tamaki J, Kouda K, Yura A, Kadowaki E, et al. Renal function and bone mineral density in community-dwelling elderly
Japanese men: the Fujiwara-kyo Osteoporosis Risk in Men (FOR- MEN) Study. Bone 2013;56:61-6.
26. Ishani A, Paudel M, Taylor BC, Barrett-Connor E, Jamal S, Canales M, et al. Renal function and rate of hip bone loss in older men: the Osteoporotic Fractures in Men Study. Osteoporos Int 2008;19:
1549-56.
27. Akaberi S, Simonsen O, Lindergård B, Nyberg G. Can DXA predict fractures in renal transplant patients? Am J Transplant 2008;8:
2647-51.
28. Menon V, Shlipak MG, Wang X, Coresh J, Greene T, Stevens L, et al.
Cystatin C as a risk factor for outcomes in chronic kidney disease.
Ann Intern Med 2007;147:19-27.
29. Séronie-Vivien S, Delanaye P, Piéroni L, Mariat C, Froissart M, Cristol JP; SFBC “Biology of renal function and renal failure” work- ing group. Cystatin C: current position and future prospects. Clin Chem Lab Med 2008;46:1664-86.
30. Strålberg F, Henning P, Gjertsson I, Kindlund B, Souza PP, Persson E, et al. Cysteine proteinase inhibitors regulate human and mouse osteoclastogenesis by interfering with RANK signaling. FASEB J 2013;27:2687-701.