Received:
26 November 2014
Revised:
9 February 2015
Accepted:
31 March 2015
doi: 10.1259/bjr.20140797
Cite this article as:
Park HJ, Lee SY, Lee SM, Kim WT, Lee S, Ahn KS. Strain elastography features of epidermoid tumours in superficial soft tissue: differences from other benign soft-tissue tumours and malignant tumours. Br J Radiol 2015;88:20140797.
FULL PAPER
Strain elastography features of epidermoid tumours in superficial soft tissue: differences from other benign soft-tissue tumours and malignant tumours
1H J PARK,MD,1S Y LEE,MD,2S M LEE,MD,3W T KIM,MD,4S LEE,MDand5K S AHN,MD
1Department of Radiology, Kangbuk Samsung Hospital, Sungkyunkwan University School of Medicine, Seoul, Republic of Korea
2Department of Radiology, Dongsan Hospital, Keimyung University School of Medicine, Daegu, Republic of Korea
3Department of Radiology, Veterans Health Service Medical Center, Seoul, Republic of Korea
4Department of Radiology, Hanyang University Hospital, Seoul, Republic of Korea
5Department of Radiology, Anam Hospital, Korea University College of Medicine, Seoul, Republic of Korea
Address correspondence to: Dr So Yeon Lee E-mail:[email protected]
Objective: We evaluated ultrasonographic features of superficial epidermoid tumour with a focus on strain elastography (SE) features that will help in the differential diagnosis of epidermoid tumour from other benign and malignant soft-tissue tumours.
Methods: We retrospectively evaluated ultrasonographic and SE data of 103 surgically confirmed superficial soft- tissue tumours and tumour-like lesions: 29 cases of epidermoid tumour, 46 cases of other benign tumours and 28 cases of malignant tumour. SE and B-mode imaging were performed at the same time. SE character- istics were assigned into four grades (1–4) according to their elasticity. Interobserver agreement for the four SE scores between the two radiologists was analysed using kappa statistics. We classified each SE finding as a hard lesion (SE Score 3–4) or soft lesion (SE Score 1–2) and compared these findings using the x2 test to identify
whether a significant difference in mass hardness existed among epidermoid tumour, other benign tumour and malignant tumour.
Results: Overall interobserver agreement according to the four SE scores was moderate (k 5 0.540), and overall agreement for the hardness [soft (Score 1–2) or hard (Score 3–4)] was almost perfect (k 5 0.825). Malignant tumours showed higher SE scores (3–4, hard nature) than did epidermoid tumour or other benign soft-tissue tumours. There were no differences in SE score between epidermoid tumour and other benign tumours.
Conclusion: Superficial epidermoid tumour exhibits a softer nature than does malignant tumour but does not have a different SE pattern from other benign tumours.
Advances in knowledge: SE features of epidermoid tumour might be helpful in differentiating from other benign and malignant tumours.
Epidermoid tumour is a slow-growing dermal or sub- cutaneous epithelial cyst that contains keratin material within the lesion and is lined by epidermis.1 Epidermoid tumour may result from traumatic implantation of the epidermis into the dermis or subcutaneous fat layer.2 Although most epi- dermoid tumours remain asymptomatic, some lesions may grow large enough to compress the surrounding structures, become infected or rupture, and thus become symptomatic.3 Common ultrasonographic findings of epidermoid tumour are a circumscribed solid or mixed nature mass with variable echogenicity.4 Repeated trauma or enlargement of the epi- dermoid tumour can precipitate rupture, and ruptured epi- dermoid tumours elicit inflammation with abundant foreign body giant cells.3,5 The rate of malignant transformation into squamous cell carcinoma has been reported to range
epidermoid tumour is very important for the establishment of the treatment plan. Strain elastography (SE) has been in- troduced for the diagnosis of soft-tissue tumours and is used to evaluate tissue stiffness.9,10Hard lesions are more resistant to extrinsic compression and show smaller strain, whereas soft lesions show larger strain.10Patel et al11reported that most epidermoid tumours show a predominant blue colour, which represents their hard nature. However, it is not possible to ascribe a characteristic SE pattern to epidermoid tumour that differentiates it from malignancy. To the best of our knowl- edge, there has not been a study of SE-applied differential diagnosis among superficial epidermoid tumour, other benign soft-tissue tumours and malignant soft-tissue tumours. In this study, we evaluated ultrasonographic features of superficial epidermoid tumour with an emphasis on SE features that
from other benign soft-tissue tumours and malignant soft-tissue tumours.
METHODS AND MATERIALS Case selection
We retrospectively evaluated ultrasonographic and SE data of 103 surgically confirmed superficial soft-tissue tumours and tumour-like lesions. The patients visited our hospital because of superficial soft-tissue masses and underwent ultrasonography and SE between September 2011 and May 2014. Pathological diagnosis and number of lesions are summarized inTable 1. The study included 29 cases of epidermoid tumour, 46 cases of other benign tumour and 28 cases of malignant tumour. The other benign tumours were lipoma (n5 20), haemangioma (n 5 5), schwannoma (n5 4), abscess (n 5 4), giant cell tumour (n 5 3), fibroma (n 5 3), benign lymph node (n 5 3), angioleiomyoma (n5 2), neurofibroma (n 5 1) and xanthoma (n 5 1). Malignant tumours included lymphoma (n5 5), metastatic lymph node (n5 4), malignant melanoma (n 5 4), metastatic tumour (n5 3), myxofibrosarcoma (n 5 3) and others (n 5 9). This study was approved by the institutional ethics review board, and
the requirement for informed consent was waived because of the retrospective study design.
Ultrasound evaluation
A single musculoskeletal radiologist with 10 years’ experience in musculoskeletal sections performed all ultrasonographic examinations using a LOGIQ E9 (GE Medical Systems, Mil- waukee, WI) imaging device equipped with linear 6–15 MHz probes and an IU22 (Philips Medical Systems, Bothell, WA) imaging device equipped with linear 5–12 MHz probes. SE and B-mode imaging were performed at the same time. Our current institutional protocol for ultrasound evaluation of a soft-tissue mass consists of the following standardized scanning planes.
B-mode images of the soft-tissue masses are obtained in the longitudinal and transverse planes. Discrete lesions are measured in three dimensions (length, width and thickness). Low-flow colour Doppler settings are also used to permit optimal visual- ization of vessels but were not included in the present study.
Immediately after B-mode ultrasonography, the same radiologist performed SE of the soft-tissue mass in the short and long axis.
The force transmitted to the mass was adjusted appropriately
Table 1. Case selection and pathological diagnosis
Category Pathology Number Frequency (%)
Epidermoid tumour Epidermoid tumour 29 28
Other benign tumour
Lipoma 20 19
Haemangioma 5 5
Schwannoma 4 4
Abscess 4 4
Giant cell tumour 3 3
Fibroma 3 3
Benign lymph node 3 3
Angioleiomyoma 2 2
Neurofibroma 1 1
Xanthoma 1 1
Malignant tumour
Lymphoma 5 5
Metastatic lymph node 4 4
Malignant melanoma 4 4
Metastasis 3 3
Myxofibrosarcoma 3 3
Kaposi’s sarcoma 2 2
Undifferentiated pleomorphic carcinoma 2 2
Malignant peripheral nerve sheath tumour 1 1
Merkel cell carcinoma 1 1
Synovial sarcoma 1 1
Squamous cell carcinoma 1 1
Basal cell carcinoma 1 1
All Total 103 100
according to the pressure graph that is presented on the liquid crystal display monitor and shows optimal strain at the region of interest (ROI). The rectangular ROI in the strain image was enlarged to cover the entire mass. The relative stiffness of the mass is represented as colour, ranging from red (high elasticity, soft) to blue (low elasticity, hard) in a continuous spectrum. SE was repeated at least two times to obtain reproducible images.
Image analysis
Ultrasonographic images were retrospectively retrieved from case files and transferred to a picture archiving and communicating
system. The images were interpreted by two fellowship-trained academic musculoskeletal radiologists with 10 and 7 years of experience, respectively. SE characteristics were classified into four grades (1–4) according to their elasticity: Score 1 (very soft, high elasticity), predominantly green to red (.70% of the total area of the lesion), with a few small areas of blue in the ROI; Score 2 (moderately soft, moderately high elasticity), more green than blue but not predominant (between 50% and 70%) in the ROI;
Score 3 (moderately hard, moderately low elasticity), more blue than green but not predominant in the ROI; Score 4 (very hard, low elasticity), predominantly blue with a few small areas of
Figure 1. Case of epidermoid tumour: a 45-year-old male presented with a palpable mass in the neck. Greyscale ultrasound (left) revealed an 8-mm-sized ovoid hypoechoic mass with posterior enhancement. Simultaneous sonoelastography (right) showed green to orange colour in.70% of the lesion (arrow). The strain elastography grade was one. LOGIQ E9; GE Medical Systems, Milwaukee, WI. For colour images see online.
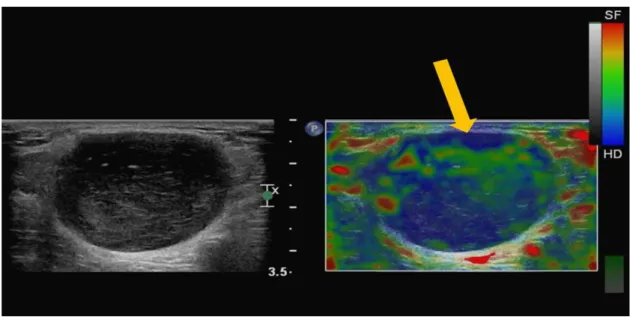
Figure 2. Case of epidermoid tumour: a 33-year-old male presented with a palpable non-tender mass on the right chin. Greyscale ultrasound (left) revealed a 13-mm-sized ovoid hypoechoic mass with posterior enhancement. Simultaneous sonoelastography (right) showed green to orange colour in.50%, but ,70%, of the lesion (arrow). The strain elastography grade was two. For colour images see online.
green in the ROI (Figures 1–4). SE images were interpreted in- dependently by two radiologists who were unaware of the path- ological diagnosis and radiological reports because the cases were mixed randomly. After evaluation of the SE characteristics, tumour size, margin irregularities, shape and echogenicity were evaluated by the two radiologists in consensus because the main focus of this study was the SE characteristics. Lesion shape was classified as elliptical, ovoid or round. The size of the lesion was measured through the largest diameter of the mass. Echogenicity relative to that of adjacent fat tissue was classified as hypoechoic, hyperechoic, isoechoic or mixed. The margins of the mass were analysed on B-mode and categorized as either well circumscribed
or poorly demarcated. Because excision of the mass was per- formed in every case, the reference diagnosis was made through histopathological analyses.
Statistical analysis
Interobserver agreement for the four SE scores between the two radiologists was analysed using kappa statistics. Thek value was interpreted as follows: poor (k # 0.01), slight (0.01 , k # 0.2), fair (0.2, k # 0.4), moderate (0.4 , k # 0.6), substantial (0.6, k # 0.8) and almost perfect (0.8 , k # 1) agreement.12 Margin irregularities, mass shape and echogenicity were com- pared between patients with epidermoid tumour, other benign
Figure 3. Case of epidermoid tumour: a 29-year-old female presented with a palpable mass in the abdominal wall. Greyscale ultrasound (left) revealed an 8-mm-sized round hypoechoic mass with posterior enhancement. Simultaneous sonoelastography (right) showed blue colour in.50%, but ,70%, of the lesion (arrow). The strain elastography grade was three. LOGIQ E9; GE Medical Systems, Milwaukee, WI. For colour images see online.
Figure 4. Case of epidermoid tumour: a 5-year-old girl presented with a palpable mass in the left thigh. Greyscale ultrasound (left) revealed a 10-mm-sized ovoid mixed echogenic mass with posterior enhancement. Simultaneous sonoelastography (right) showed predominant blue colour in.70% of the lesion (arrow). The strain elastography grade was four. For colour images see online.
tumour and malignant tumour using thex2 test. Tumour size and patient age were compared using Mann–Whitney U tests.
We classified each SE finding as a hard lesion (SE Score 3–4) or soft lesion (SE Score 1–2) and compared these findings using the x2 test to identify whether a significant difference in mass hardness existed among epidermoid tumour, other benign tu- mour and malignant tumour. Statistical analyses were per- formed using PASW® software v. 18.0 (IBM Corp., Armonk, NY). A p# 0.05 was considered statistically significant.
RESULTS
A summary of the pathological diagnoses and the frequency of each tumour type are provided in Table 1. The mean age of patients with epidermoid tumour, other benign tumour and malignant tumour was 37.8 (617) years, 44.4 (615) years and 58.4 (618) years, respectively. The patient age distribution was from 5 to 89 years. The mean age of patients with malignant tumour was significantly higher than that of patients with epi- dermoid tumour or other benign tumour (p, 0.001). Table 2 shows interobserver agreement according to tumour type.
Overall interobserver agreement according to the four SE scores was moderate (k 5 0.540), and overall agreement for the hard- ness [soft (Score 1–2) or hard (Score 3–4)] was almost perfect (k 5 0.825). Malignant tumours showed higher SE scores (3–4, hard nature) than did epidermoid tumour or other benign soft- tissue tumours (Table 3 and 4, Figures 5–7). There were no differences in SE score between epidermoid tumour and other benign tumours. A summary of other greyscale ultrasonographic findings is provided inTable 3. The mean sizes of epidermoid tumour, other benign tumour and malignant tumour were 21, 30 and 34 mm, respectively, and the difference was statistically
significant (p , 0.05). There were no significant differences in the presence of margin irregularities and the shape of the tu- mour among the groups. There were significant differences in the echogenicity of the tumour between epidermoid tumour and other benign tumour, and between malignant tumour and entire benign tumour (p, 0.05). Other benign tumour showed a much higher incidence of isoechogenicity than did epidermoid tumour, and malignant tumour showed a higher incidence of mixed echogenicity. However, there was no significant difference between epidermoid tumour and malignant tumour.
DISCUSSION
The differential diagnoses of epidermoid tumour in the su- perficial layer include other benign soft-tissue tumours such as haemangioma, angioleiomyoma, neurogenic tumour and li- poma, inflammatory masses such as abscess and malignant soft-tissue tumours.13Magarelli et al9reported that SE can be a useful method for evaluation of superficial soft-tissue lesions and that malignant lesions exhibit increased stiffness on SE.
Likewise, our study revealed a different SE pattern between malignant tumour and benign tumour, including epidermoid tumour; malignant tumours showed a harder nature than did benign tumours (p, 0.05), but there was no significant dif- ference in the SE pattern between epidermoid tumour and other benign tumours. In the differential diagnosis between epidermoid tumour and other benign tumour, mean size and echogenicity showed significant differences. These results are consistent with those of previous studies on thyroid nodules, which reported that a hard nodule is more likely to be ma- lignant than a soft nodule.14 The mean size of epidermoid tumour was smaller than that of other benign tumours (21 vs
Table 2. Interobserver reliabilities of strain elastography (SE) score by kappa values
SE score Epidermoid tumour Other benign tumour Malignant tumour Total
All four grades 0.662 0.501 0.402 0.540
Standard error 60.101 60.091 60.126 60.059
Soft vs hard (1–2 vs 3–4) 0.863 0.778 0.789 0.825
Standard error 60.093 60.094 60.140 60.056
Values given as kappa values: poor (k , 0.1), slight (0.1 # k # 0.2), fair (0.2 , k # 0.4), moderate (0.4 , k # 0.6), substantial (0.6 , k # 0.8) and almost perfect (0.8, k # 1).
Table 3. Characteristics of epidermoid tumour, other benign tumour and malignant tumour
Diagnosis Size (mm)
Margin irregularities
(%)
Shape elliptical/
ovoid/round (%)
Echogenicity hyper/iso/hypo/
mixed (%)
SE score (Reader 1) 1–2/3–4 (%)
SE score (Reader 2) 1–2/3–4 (%)
Epidermoid
tumour 21.2 (616.4) 7 (24) 11/15/3 (38/52/10) 4/0/12/13 (14/0/41/45) 14/15 (48/52) 16/13 (56/44) Other
benign tumour
30.6 (620.6) 10 (22) 23/13/10 (50/28/22) 1/19/13/13 (2/42/28/28) 26/20 (56/44) 27/19 (59/43) Malignant
tumour 34.3 (613.5) 11 (39) 11/12/5 (39/43/18) 0/0/11/17 (0/0/39/61) 5/23 (18/82) 7/21 (25/75) SE, strain elastography.
30 mm; p5 0.009) and smaller than that of malignant tumour (21 vs 34 mm; p, 0.001). We attribute the difference between epidermoid tumour and malignant lesion to the fact that epi- dermoid tumour is a slow-growing benign tumour, whereas malignant tumours included in our study are rapid-growing tumours such as sarcoma and lymphoma.2 Regarding echo- genicity, other benign tumours showed a much higher in- cidence of isoechogenicity than did epidermoid tumours, which might result from the large population of lipomas among the other benign tumours. In comparison with all be- nign tumours, malignant tumour showed a higher incidence of mixed echogenicity (p5 0.006). Our study suggests that the presence of margin irregularities and the shape of the tumour are not useful for differential diagnoses between benign and malignant tumour or between epidermoid tumour and ma- lignant tumour.
Reproducibility of the SE evaluation is an important feature of our study. Interobserver agreement regarding the four grades of
softness on SE showed moderate to substantial reproducibility, whereas agreement for the presence of hardness (soft nature vs hard nature) showed substantial to almost perfect re- producibility. Thesefindings indicated that SE has excellent re- producibility for binary decision“hard or soft” and not perfect for each grades. The high level of interobserver agreement fur- ther implies that SE is a suitable objective method for the evaluation of hardness in soft-tissue tumours.
Although we found that malignant tumours had a hard SE pattern and benign tumours had a soft SE pattern, we could not find a characteristic SE pattern that differentiated epidermoid tumour from other benign tumours. The results of our study are consistent with the conclusion of Patel et al,11who reported that it is not possible to define a SE pattern unique for epidermoid tumour and concluded that SE is not useful as a solitary feature but other greyscalefindings are necessary in the study of testicular epider- moid tumour. However, they reported that epidermoid tumour showed a predominant blue colour, which indicates the hard
Table 4. Statistical analysis of epidermoid tumour, other benign tumour and malignant tumour
Diagnosis Size
Margin irregularities
positive
Shape elliptical/
ovoid/round
Echogenicity hyper/iso/hypo/
mixed
SE score (Reader 1)
1–2/3–4
SE score (Reader 2)
1–2/3–4
Benign vs
malignant 0.005 0.092 0.887 0.006 0.001 0.003
Epidermoid vs other benign tumour
0.009 0.809 0.173 ,0.001 0.486 0.764
Epidermoid vs malignant tumour
,0.001 0.219 0.665 0.102 0.015 0.020
SE, strain elastography.
Values are p-values.
Figure 5. Case of lipoma: a 69-year-old female presented with a non-tender palpable mass in the right forearm. Greyscale ultrasound (left) revealed a 54-mm-sized isoechogenic mass. Simultaneous sonoelastography (right) showed green to orange colour in.70%
of the lesion (arrow). The strain elastography grade was one. For colour image please see online.
nature, whereas our study showed a similar distribution of the hard and soft nature of the lesion among benign lesions (Table 3). The discrepancy in these results might be because the previous study focused on testicular lesions and/or because our data were derived from a larger study population, as Patel et al11 performed their study on only seven lesions in three patients. Therefore, we think that our results of SE pattern are a more reliable indication of the characteristics of epidermoid tumour in superficial soft tissue.
One limitation of this study is that the composition of the group of other benign tumours, which contained a large proportion of
lipomas (43% of other benign tumours), cannot represent the entire suite of benign soft-tissue tumours. For example,fibro- mas are usually hard (fibrous tissue is usually harder than fat). In our study,fibroma constitutes only 7% of all other benign tu- mour whereas lipoma constitutes 43%. This makes group of benign lesions rather inhomogenous and explains the variety of the results and the lack of statistical difference. Another limi- tation is the use of a semi-quantitative analysis method for evaluation of the SE pattern. The third limitation is that we adopted compression type elastography, in which strain varia- tions can develop owing to changes in compression.15Thefinal
Figure 6. Case of lymphoma: an 83-year-old male presented with a non-tender mass in the left inguinal area. Greyscale ultrasound (left) revealed a 30-mm-sized well-demarcated hypoechogenic mass. Simultaneous sonoelastography (right) showed predominant blue colour in.70% of the lesion (arrow). The strain elastography grade was four. The lesion was surgically proven to be lymphoma.
For colour image please see online.
Figure 7. Case of malignant melanoma: a 54-year-old male presented with a mass on the right sole. Greyscale ultrasound (left) revealed a 34-mm-sized ovoid hypoechoic mass. Simultaneous sonoelastography (right) showed predominant blue colour in.70%
of the lesion (arrow). The strain elastography grade was four. The lesion was surgically proven to be malignant melanoma. For colour image please see online.
limitation is the retrospective study design. Therefore, we could not evaluate interoperator agreement that might result in obtaining SE images, because SE is a kind of operator-dependent technique.
In conclusion, superficial epidermoid tumour shows a softer nature than does malignant tumour; however, it does not have a different SE pattern from other benign tumours. Nonetheless, superficial epidermoid tumour is smaller than other benign tumours and
malignant tumours and the incidence of hypoechogenicity or mixed echogenicity is higher in epidermoid tumours than in other benign tumours. These characteristics might be helpful in differ- entiating epidermoid tumours from other benign tumours and malignant tumours.
ACKNOWLEDGMENTS
Special thanks to Soo Hyun Park (Gae Po High school, Seoul, Republic of Korea).
REFERENCES
1. Huang CC, Ko SF, Huang HY, Ng SH, Lee TY, Lee YW, et al. Epidermal cysts in the superficial soft tissue: sonographic features with an emphasis on the pseudotestis pattern.
J Ultrasound Med 2011;30: 11–17.
2. Jin W, Ryu KN, Kim GY, Kim HC, Lee JH, Park JS. Sonographicfindings of ruptured epidermal inclusion cysts in superficial soft tissue: emphasis on shapes, pericystic changes, and pericystic vascularity. J Ultra- sound Med 2008;27: 171–6.
3. Misner SC, Mariash SA, Alvarez G. Ruptured plantar epidermal inclusion cyst with foreign body giant cell reaction. J Foot Surg 1991;30: 38–42.
4. Lee HJ, Joo KB, Song HY, Kim YS, Park DW, Park CK, et al. Relationship between sono- graphic and pathologicfindings in epidermal inclusion cysts. J Clin Ultrasound 2001;29:
374–83. doi:10.1002/jcu.1052
5. Cooper RA, Ramamurthy L. Epidermal in- clusion cysts in the male breast. Can Assoc Radiol J 1996;47: 92–3.
6. Ziadi S, Trimeche M, Hammedi F, Sriha B, Jomaa W, Mokni M, et al. Squamous cell
carcinoma arsing from an epidermal in- clusion cyst: a case report. N Am J Med Sci 2010;2: 46–7.
7. Chiu MY, Ho ST. Squamous cell carcinoma arsing from an epidermal cyst. Hong Kong Med J 2007;13: 482–4.
8. Cameron DS, Hilsinger RL Jr. Squamous cell carcinoma in an epidermal inclusion cyst:
case report. Otolaryngol Head Neck Surg 2003;129: 141–3. doi:10.1016/s0194-5998 (03)00466-2
9. Magarelli N, Carducci C, Bucalo C, Filograna L, Rapisarda S, De Waure C, et al. Sonoelastography for qualitative and quantitative evaluation of superficial soft tissue lesions: a feasibility study. Eur Radiol 2014;24: 566–73. doi:10.1007/s00330- 013-3069-6
10. Lee SY, Park HJ, Choi YJ, Choi SH, Kook SH, Rho MH, et al. Value of adding sonoelas- tography to conventional ultrasound in patients with congenital muscular torticollis.
Pediatr Radiol 2013;43: 1566–72. doi:
10.1007/s00247-013-2750-x
11. Patel K, Sellar ME, Clarke JL, Sidhu PS.
Features of testicular epidermoid cysts on contrast-enhanced sonography and real-time tissue elastography. J Ultrasound Med 2012;
31: 115–22.
12. Viera AJ, Garrett JM. Understanding in- terobserver agreement: the kappa statistic.
Fam Med 2005;37: 360–3.
13. Hong SH, Chung HW, Choi JY, Koh YH, Choi JA, Kang HS. MRIfindings of sub- cutaneous epidermal cysts: emphasis on the presence of rupture. AJR Am J Roent- genol 2006;186: 961–6. doi:10.2214/
AJR.05.0044
14. Kagoya R, Monobe H, Tojima H. Utility of elastography for differential diagnosis of benign and malignant thyroid nodules.
Otolaryngol Head Neck Surg 2010;143:
230–4. doi:10.1016/j.otohns.2010.04.006 15. Lee SY, Park HJ, Kwag HJ, Hong HP, Park
HW, Lee YR, et al. Ultrasound elastography in the early diagnosis of plantar fasciitis. Clin Imaging 2014;38: 715–18. doi:10.1016/j.
clinimag.2012.12.004