Analysis and Implications of Twitter Data during the 2012 Election
Hongwon Yun1)
Abstract Twitter is a microblogging service that allows users to post short messages on a variety of topics in real-time. In this work, we analyze Twitter messages posted during the 2012 elections and find those implications. This study uses Twitter messages related to the 2012 South Korean presidential campaign. The three main candidates are represented by the abbreviations A, M, and P. According to the statistical analysis, the number of tweets and re-tweets for candidate P was relatively stable over the entire campaign period. Candidate P had the highest percentage of terms related to elections pledges, and candidates A and M were judged to be a little bit poorer with respect to campaign promises. The positive terms ratio for candidate P was higher than those for the other two candidates. The negative terms ratio in the Twitter messages of P was considerably smaller than those of candidates A and M. After considering all these results, it is suggested cautiously that Twitter messages posted during an election campaign could be correlated with the outcome of the election.
Key Words : Twitter data, Election, Social media, Tweet
1. INTRODUCTION1)
Twitter users can post short messages with up to 140 characters. These messages are called tweets, which convey not only their thoughts, ideas, and opinions but also political opinions. The use of social network services (SNS) for communication has increased explosively. According to research, 22% of adult Internet users posted messages related to the political campaign on social media during the 2010 US election period [1-3]. One of the successful use cases of an SNS, such as Twitter, is the US Presidential Campaign of Barack Obama. Twitter, Facebook, and other social media were useful for collecting donations and raising funds to help Obama win the elections. Some analysts attributed Obama’s victory to the use of evolving SNS [4-8].
1) Silla University, Professor, 1st Author
The use of such successful social media affected the 2012 South Korean Presidential Campaign.
During the election campaign, Twitter users produced and broadcasted content in a variety of ways, such as tweets, re-tweets, and website links.
Further, social media companies like Twitter provide their data to researchers through application program interfaces and aid in the analyses of the collected data. These analyses can predict consumer behavior in areas, such as business, stock markets, and politics [9-11]. In this study, Twitter data related to the 2012 South Korean Presidential Election were collected and analyzed. The contribution of this study is to look for the possibility that election results could be predictable through an analysis of Twitter messages posted before an election. Consequently, Twitter messages associated with the main presidential candidates were collected and analyzed to support the aim of this study. The
rest of this paper is organized as follows: Section II shows the Google trends for the main presidential candidates along with some data published by the National Election Commission in Korea. Section III describes the statistical analyses of Twitter messages. The final section, Section IV, presents the conclusion and the direction for future work.
2. BACKGROUND ON THE SOUTH KOREAN ELECTION AND THE COLLECTED DATA
The 2012 South Korean Presidential Election was held in South Korea on December 19, 2012. The candidate receiving the highest number of votes was elected the President and has to work for a single term of five years in office. Three major candidates contested in this election. According to alphabetical order, candidate A as an independent announced his intention to run for the 2012 Presidential Election on September 19, 2012. He emerged as the leading potential candidate.
Candidate M was nominated as the Democratic United Party’s candidate for the 2012 Presidential Election on September 16, 2012. Candidate P was officially declared as the Saenuri Party’s candidate on July 10, 2012.
In recent years, a number of researches have shown that Twitter data have some forecasting ability. Further, electoral prediction using social media is very interesting even though it is still a difficult research problem. For this study, the 2012 South Korean Presidential Election presented a good opportunity to estimate the prediction power of Twitter messages. Twitter data were collected during the presidential campaign in South Korea.
For each candidate, we executed a query on Tweet Archivist by using the candidate’s name and retrieved the relevant Twitter messages posted between October 31 and November 21, 2012. The
top 200 terms with higher frequencies were selected by a program that we developed. In addition, we obtained the top 200 Twitter users’ IDs who tweeted and re-tweeted messages related to the three above mentioned presidential candidates. Each result was manually inspected and filtered, leaving only 73 words. The analysis was performed on for the three candidates.
3. RESULTS
3.1 Considerations for Candidate Selection and Google Trends
National Election Commission in South Korea published “The Voters’ Survey for 18th Presidential Election” in February 2013. To compare between the voters’ considerations for candidate selections and the Twitter users’ opinions related to election pledges, these data were searched and are shown below. Fig. 1 shows the voters’ considerations for candidate selections in the 16th, 17th, and the 18th (the 2012) presidential elections. When choosing a candidate, about 4 in 10 (44.6%) voters said that they would consider policies and commitments [12].
This trend emerged more strongly in the 18th presidential election as shown in Fig. 1.
<Fig. 1> Considerations for candidate selections
<Fig. 2> Google trends for three candidates
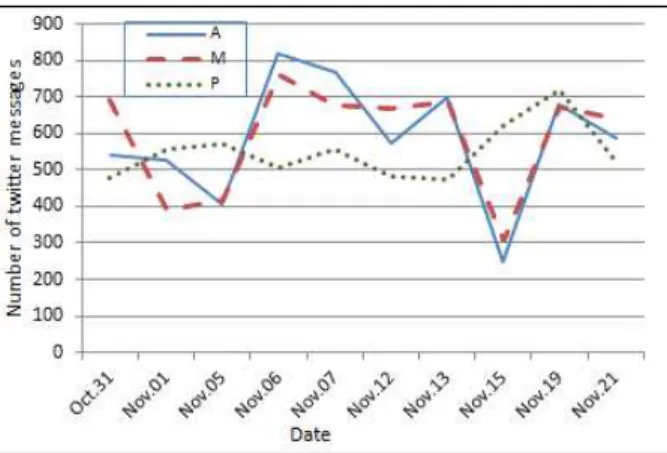
<Fig. 3> Number of Twitter messages of top 20 Twitter users for the three candidates
Fig. 2 shows the Google trends for the three considered candidates from October 31 to November 21, 2012. According to this figure, candidate A is more popular than the other two candidates during the search period. For candidate P, there seems to be no significant change during this period, as shown in Fig. 1. These trends are similar to the trend shown in Fig. 3.
3.2 Statistics for Twitter Data
First of all, Twitter users who broadcast a lot of Twitter messages are investigated as the beginning of analysis. Table 1 shows the top 5 Twitters ranked based on number of tweets and retweets in the data set. Each number of tweets and retweets in Table 1 is total Twitter messages including full name for A or M or P and duplicates are allowed.
The number of tweets and re-tweets posted by
the top 20 Twitter users between October 31 and November 21 is shown in Fig. 3. Candidates A and M are shown to have a similar trend, and candidate P shows a relatively different trend. The fluctuation range of candidate P is less than that of the other two candidates during the data collection period. In other words, it can be said that the popularity of candidate P was stable over the entire period in terms of the number of Twitter messages.
The re-tweet function is used to repost a message from another Twitter user and share it with one’s own followers. Candidate P had a higher number of re-tweets than the other two candidates, as shown in Fig. 4. Candidates A and M had a large deviation between the maximum value and the minimum value of each candidate’s re-tweets; on the other hand, the deviation for candidate P was smaller than that for the other two candidates. Fig. 5 shows the total number of Twitter messages and the percentage of re-tweets for each candidate. The total number of Twitter messages was similar for candidates A and M, while the numbers for the two were vastly greater than the total number of Twitter messages for candidate P. However, the proportion of re-tweets for candidate P was larger than that for the other two candidates, as shown in Fig. 5.
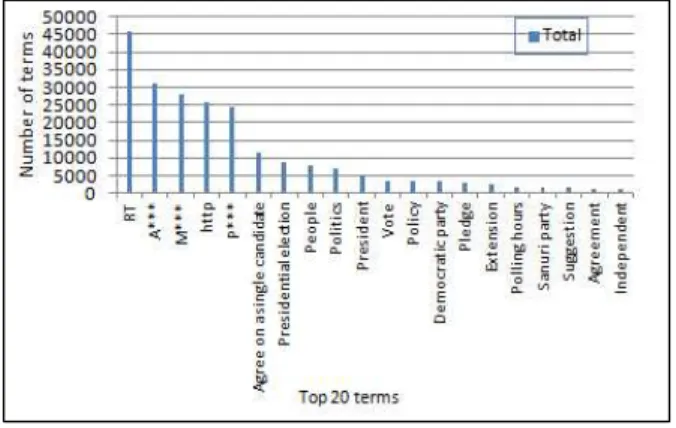
Fig. 6 shows the top 20 terms in the Twitter messages for the three candidates in the descending order; Fig. 6(a) and (b) have similar terms throughout the order. On the other hand, Fig. 6(c) has different terms at the end of the order. Election pledges such as household debt and economic democratization appear at the tail of Fig. 6(c). The top 20 terms in common are shown in Fig. 6(d).
Further, it is interesting to note that in Fig. 6(d), the word ‘people’ (‘국민’ in Korean) appears eighth from the left. In Fig. 6(d), we see the number of appearance for the two parties and one the independent candidate (Democratic party > Saenuri parity > Independent) on the basis of the frequency of the top 20 terms in common.
Terms related to election pledges, such as those
on household debt, economic democratization, and were relatively more common in candidate P’s Twitter messages than those in the messages for the other two candidates. The extended voting hours were announced during the election campaign;
therefore, the term ‘polling hours’ also had a notable frequency, as shown in Fig. 7. More concrete
<Table 1> Top 5 ranked by number of tweets and retweets
Rank Twitter User ID Number of Twitter messages
1 supe*** 2807
2 Scar*** 1332
3 Julk*** 1273
4 iame*** 705
5 andy*** 615
<Fig. 4> Statistics of re-tweets for each candidate
<Fig. 5> Total number of messages and percentage of re-tweets for each candidate
analyses on the campaign promises are discussed in detail in the next section.
(a)
(b)
(c)
(d)
<Fig. 6> Top 20 terms for candidate A (a), for candidate M (b), for candidate P (c), and in common (d)
<Fig. 7> Comparison between terms related to election pledges of each candidate.
3.3 Analyses of Election Pledges
For each candidate, the percentage of terms related to election pledges was 1.72%, 1.75%, and 2.80%, as shown in Table 2; candidate P had the highest percentage among them. The percentages were almost similar for candidates A (1.72%) and M (1.75%). The performance of candidates A and M was considered to be poor with respect to their campaign promises. As shown in Fig. 1, voters said that they would consider policies and pledges first.
In order to evaluate the effect of the positive and the negative terms in the datasets, the total number of terms is computed. As shown in Table 3, candidates A and M had similar ratios of the positive and the negative terms, whereas candidate P had a higher positive ratio than the other two candidates. The negative terms ratio in the dataset of candidate P was considerably smaller than that of candidates A and M.
Table 4 shows a few selected terms that we used to calculate the total number of terms with respect to the election pledges of each candidate, and these words were included in the considered datasets.
<Table 2> Statistics of terms related to the election pledges of the three candidates
Candidate Total no. of terms related to
election pledges %
A 1,460 1.72
M 1,487 1.75
P 2,107 2.80
<Table 3> Positive and negative terms in the datasets of the three candidates
Candidate No. of terms Terms ratio Positive Negative Positive Negative
A 1,570 1,588 0.50 0.50
M 1,390 1,425 0.49 0.51
P 1,561 594 0.72 0.28
<Table 4> A selection of a few positive and negative terms
Positive Negative
Future, Vision, Communication, Peace,
Renovation, Improvement
Ignorance, Obsolete things, Reckless talk,
Disappointment, Suspicion, Decrease
4. DISCUSSION AND CONCLUSIONS In this paper, we analyzed Twitter messages
posted during the 2012 presidential elections and investigated those implications. In addition, we gave a thought to find the possibility of forecasting election results through an analysis of Twitter messages. Before the 2012 South Korean Presidential Election, Twitter messages associated with the main presidential candidates were collected during the presidential campaign.
The analysis results can be summarized as follows: According to the number of tweets and re-tweets ranked by top 20 Twitter users, the popularity of candidate P was stable over the entire period. Further, candidate P had a higher number of re-tweets than the other two candidates. On the other hand, the total numbers of Twitter messages of the other two candidates were vastly greater than the total number of messages for candidate P.
However, there were considerably more messages on election pledges such as those related to household debt and economic democratization for candidate P. Candidate P had the highest percentage of terms related to election pledges, and candidates A and M were considered poor with respect to campaign promises. Candidates A and M showed similar ratios with respect to positive and negative terms, whereas candidate P had a higher positive terms ratio than the other two candidates. The negative terms ratio for candidate P was considerably less than that for candidates A and M.
Considering these results, we suggested cautiously that Twitter messages posted during an election campaign could be correlated with the outcome of the election, even though many questions have still remained unresolved.
References
[1] D. Gayo-Avello, P. Metaxax and E. Mustafaraj,
“Limits of Electoral Predictions Using Twitter,”
in Proceedings of the Fifth International AAAI Conference on Weblogs and Social Media, 2011.
[2] D. Gayo-Avello, “Don't turn social media into another 'Literary Digest' poll,” Communications of theACM, Vol. 54, no. 10, pp. 121-128, 2011.
[3] A. Mislove, S. Lehmann, Y. Y. Ahn, J. P.
Onnela, and J. N. Rosenquist, “Understanding the demographics of Twitter users,” in Proceedings of the International AAAI Conference on Weblogs and Social Media(ICWSM), Barcelona, Spain, pp.
554-557, 2011.
[4] A. L. Hughes and L. Palen, “Twitter adoption and use in mass convergence and emergency events,”International Journal of Emergency Management, Vol. 6, no. 3, pp. 248-260, 2009.
[5] E. Mustafaraj and P. T. Metaxas, “From obscurity to prominence in minutes: political speech and real-time search,” in Proceedings of the WebSci10: Extending the Frontiers of Society On-Line, Raleigh, NC, pp.1-7, 2010.
[6] A. Livne, M. P. Simmons, E. Adar, and L. A.
Adamic, “The party is over here: structure and content in the 2010 Election,” in Proceedings of the International AAAI Conference on Weblogs and Social Media(ICWSM), Barcelona, Spain, pp.
201-208, 2011.
[7] A. Tumasjan, T. O. Sprenger, P. G. Sandner, and I. M. Welpe, “Predicting elections with Twitter: what 140 characters reveal about political sentiment,” in Proceedings of the International AAAI Conferenceon Weblogs and Social Media(ICWSM), Washington, DC, pp.
178-185. 2010.
[8] B. O'Connor, R. Balasubramanyan, B. R.
Routledge, and N. A. Smith, “From tweets to polls: linking text sentiment to public opinion time series,” in Proceedings of the International AAAI Conference on Weblogs and Social Media(ICWSM), Washington, DC, pp.122-129, 2010.
[9] P. T. Metaxas, E. Mustafaraj, and D. Gayo- Avello, “How (not) to predict elections,” in Proceedings of the IEEE 3rd International Conference on Social Computing(SocialCom),
Boston, MA, pp.165-171,2011.
[10] A. Bermingham and A. F. Smeaton, “On using Twitter to monitor political sentiment and predict election results,” in Proceedings of the Workshop on Sentiment Analysis where AI meets Psychology(SAAIP), ChiangMai, Thailand, pp. 2-10, 2011.
[11] S. Asur and B. A. Huberman, “Predicting the future with social media,” in Proceedings of IEEE/WIC/ACM International Conference on Web Intelligence and Intelligent Agent Technology (WI-IAT), Toronto, Canada, pp. 492-499, 2010.
[12] National Election Commission in South Korea, The voters’ survey for 18th Presidential Election [Internet], Available: http://info.nec.go.kr/.
윤 홍 원 (Hongwon Yun)
∙정회원
∙부산대학교 계산통계학과 이학사
∙한국외국어대학교 경영정보대학원 전자계산학과 이학석사
∙부산대학교 전자계산학과 이학박사
∙신라대학교 공과대학 IT학과 교수
∙관심분야 : 데이터베이스, 소셜 네트워크
논 문 접 수 일 1차수정완료일 게 재 확 정 일 : : :
2014년 07월 09일 2014년 08월 07일 2014년 08월 21일