Superconductivity and Cryogenics Vol.14, No.2, (2012), pp.28~31
Abstract-- The study on the dielectric characteristics of gaseous insulation medium is important for designing current leads of superconducting machines using a sub-cooled liquid nitrogen (LN
2) cooling method. In a sub-cooled LN
2cooling system, the temperature of gaseous insulation medium surrounding current leads varies from the temperature of coolant to 300 K according to the displacement between the electrode system and the surface of sub-cooled LN
2. In this paper, AC withstand voltage experiments on gaseous nitrogen according to temperature are conducted. Also, AC withstand voltage experiments on gaseous nitrogen according to pressure, size of electrode, and gap length between two electrodes are performed. It is found that there is a functional relation between the electrical breakdown voltage and the field utilization factor (ξ). As a result, the empirical formula for estimating an electrical breakdown voltage is deduced by adopting the concept of field utilization factors. It is expected that the experimental results presented in this paper are helpful to design current leads for a high voltage superconducting apparatus such as a superconducting fault current limiter (SFCL) using a sub-cooled LN
2cooling system.
1. INTRODUCTION
There are several technical obstacles such as dielectric, cryogenic, and economic problems to develop and commercialize a high voltage superconducting apparatus such as an SFCL, a superconducting motor, a superconducting transformer, and so on with high reliability. In this paper, a study on the dielectric characteristics of gaseous nitrogen is conducted to design current leads for a sub-cooled LN
2cooling system known to be a most promising method to develop a high voltage superconducting machine [1]. In a sub-cooled LN
2cooling system, the electrical insulation design for current leads is important because the dielectric performance of gaseous insulation medium is inferior to that of LN
2[1]. In Republic of Korea, SF
6, CF
4, He, and N
2are taken into consideration as a candidate for regulating the pressure of the sub-cooled LN
2cooling system of a high voltage superconducting apparatus [1]. In this paper, dielectric experiments on N
2and analyses using a finite element method (FEM) are performed because N
2is known as the most promising insulation medium for its homogeneity with the coolant as well as dielectric performance [1]. It is known that the dielectric characteristics of gaseous media are deeply
* Corresponding author: [email protected]
dependent on the temperature. Therefore, the electrical breakdown voltage experiments of N
2according to temperature are conducted in this study. This is very important point to determine the electrical insulation design criterion of current leads.
Many papers and reports on the dielectric characteristics of N
2have been published. However, there have not been ever conducted experiments and analysis on the dielectric characteristics of N
2considering ξ. Currently, it has been reported that the electrical breakdown voltage of gaseous insulation media such as He, Ne, and SF
6is determined by ξ as well as temperature, gap length between electrodes and pressure [3]. Also, many efforts have been devoted to applying the results to design superconducting apparatuses.
This investigation is a part of those efforts.
In this investigation, seven kinds of sphere-to-plane electrode systems with different diameters are designed and fabricated to verify the functional relation between ξ and E
max,meanto contemplate the various conditions. The gap length between two electrodes is varied from 10 mm to 60 mm to conduct experiments in wide range of the ξ. Also, electrical breakdown voltage experiments on GN
2according to pressure are carried out and functional formulae for calculating the electrical breakdown voltage are derived. This paper presents not only the dielectric experimental results of GN
2according to temperature and pressure but also the electrical insulation design method for high voltage superconducting apparatuses.
2. DIELECTRIC CHARACTERISTICS OF GN
2ACCORDING
TO TEMPERATURE A sub-cooled LN
2cooling system is regarded as a most promising method for its excellent cooling characteristics, thermal conduction, and dielectric characteristics [4].
Therefore, the dielectric characteristics of GN
2considering several conditions for a sub-cooled LN
2cooling system are investigated in this study. A sub-cooled LN
2cooling system is largely composed of liquid part and gaseous part [4]. Fig.
1 shows the schematic sketch of a sub-cooled LN
2cooling system. In Fig. 1, the ellipse with broken line indicates the gaseous part. The current leads are installed at the gaseous part and surrounded by GN
2. The temperature gradient of GN
2surrounding current leads is varied from approximately the temperature of LN
2to 300 K because the end of current leads is immersed into LN
2and the other end
Study on the Dielectric Characteristics of Gaseous Nitrogen for Designing a High Voltage Superconducting Fault Current Limiter
Jeong Il Heo, Jonggi Hong, Seokho Nam, and Hyoungku Kang*
Dept. of Electrical Engineering, Korea National University of Transportation, Chungbuk, Korea
Received 13 April 2012; accepted 8 May 2012
Jeong Il Heo, Jonggi Hong, Seokho Nam, and Hyoungku Kang is exposed to the atmosphere. Therefore, the dielectric
characteristics of current leads could be quite different according to the displacement from the surface of LN
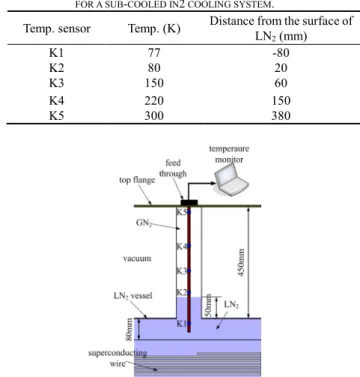
2. 2.1. Temperature distribution of a gaseous part
The temperature gradient at the gaseous part of a sub-co oled LN
2cooling system is measured by attaching five K-t ype thermocouples on a GFRP rod like Fig. 2. The explana tion on the structure of a sub-cooled LN
2cooling system is described in another paper in detail [4]. The saturated 77 K LN
2is poured into a cryostat and then the GFRP rod with t hermocouples is installed. After the stabilization, the temperature distribution of GN
2in the gaseous part is measured and shown in Table І. As shown in Table І, it is found that the temperature of GN
2next above the surface of LN
2is about 80 K and the temperature of GN
2beneath the top flange is about 300 K. The difference of dielectric performance is caused by this temperature gradient in the gaseous part.
2.2. Dielectric experiments according to temperature In the gaseous part of a sub-cooled LN
2cooling system the temperature gradient is distributed according to the displacement from the surface of coolant. The variation of dielectric characteristics according to temperature is confirmed by performing AC breakdown voltage experiments. The dielectric experiment is conducted by using an electrode system with a sphere electrode of 50 mm in diameter. The gap length between a sphere electrode and a plane electrode is varied from 1 mm to 10 mm. The temperature of experiment was regulated by controlling the distance between the electrode system and the surface of coolant and the temperature was measured by K-type thermocouples which are installed near the electrodes like Fig. 3. The experimental results are plotted in Fig. 3. As shown in Fig. 3, the electrical breakdown voltage at 80 K is definitely more than two times superior to that of 300 K in case of a 0.1 bar pressure condition. For this reason, the dielectric characteristics at 300 K should be a criterion to design current leads for a high voltage superconducting apparatus considering safety factor Therefore, every dielectric experiment on GN
2according to gap length, size of electrode, and pressure is conducted at 300 K temperature and 0.1 bar pressure condition. In this paper, all of the described pressures mean the absolute pressure.
Fig. 1. Structure of a sub-cooled LN
2cooling system.
TABLE I
T
EMPERATURE GRADIENT OF GASEOUS PART FOR A SUB-
COOLED IN2
COOLING SYSTEM.
Temp. sensor Temp. (K) Distance from the surface of LN
2(mm)
K1 77 -80
K2 80 20
K3 150 60
K4 220 150
K5 300 380
Fig. 2. Temperature measurement by using thermocouple sensors.
Fig. 3. Temperature dependency of AC breakdown voltage according to gap length at 0.1 bar pressure.
3. EXPERIMENTAL SET-UP AND CALCULATION
In this paper, AC breakdown voltage experiment on GN
2was performed under the condition of pressures: 0.1 and 0.4 bar with seven kinds of electrode systems. GN
2is injected into a test chamber after vacuumizing it until the pressure reaches down to 10
-3Torr by using a rotary pump with a capacity of 192 liter/min in order to minimize the adverse effect of impurities.
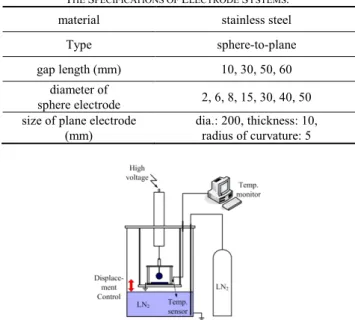
3.1. Sphere-plane electrode system
Seven kinds of electrode systems with different diameters are designed and manufactured to understand the AC electrical breakdown characteristics of GN
2. The gap length between a sphere electrode and a plane electrode is varied from 10 mm to 60 mm. The specifications of electrode systems are shown in Table ІІІ. AC voltage is
29
Study on the Dielectric Characteristics of Gaseous Nitrogen for Designing a High Voltage Superconducting Fault Current Limiter
TABLE III
T
HES
PECIFICATIONS OFE
LECTRODES
YSTEMS.
material stainless steel
Type sphere-to-plane
gap length (mm) 10, 30, 50, 60 diameter of
sphere electrode 2, 6, 8, 15, 30, 40, 50 size of plane electrode
(mm) dia.: 200, thickness: 10, radius of curvature: 5
Fig. 4. Schematic sketch of dielectric experiment according to temperature.
applied to the sphere electrode and the plane electrode is grounded. AC electrical breakdown voltage experiment is repeated 12 times for every experimental condition (determined by electrode sizes and gap lengths) and ten values apart from the extrema are selected to calculate the mean values of electrical breakdown voltage. This is a usual statistical method to enhance the reliability of experimental results. The mean value of electrical breakdown voltage is calculated by using a software program, Minitab.
3.2. Calculation of field utilization factors
The electric field analysis is performed by using a simulation program, Magnet. In the analysis, 1kV is applied to a sphere electrode and a plane electrode is grounded.
As a result, the maximum electric field intensity (E
max), the mean electric field intensity (E
mean), and the ξ of the electrode system are calculated. The ξ could be represented as Eq. (1). Table ІІІ shows the calculated ξ by finite element method (FEM). The ξ is a relative magnitude of the E
meanin comparison with the E
max.
E
maxE
meanξ = (1)
4. EXPERIMENTAL RESULTS AND DISCUSSION
AC withstand voltage experiment on GN
2is conducted and the statistical mean value of the electrical breakdown voltage (V
BD,mean) is calculated. Also, the E
max,meancan be obtained by multiplying the V
BD,meanby the analytic maximum electric field intensity (E
max,1kV). The relation of E
max,mean, E
max,1kVand V
BD,meancan be represented as follows:
mean BD kV
mean
E V
E
max,=
max,1×
,(2) 4.1. Experimental results of AC withstand voltage
experiments
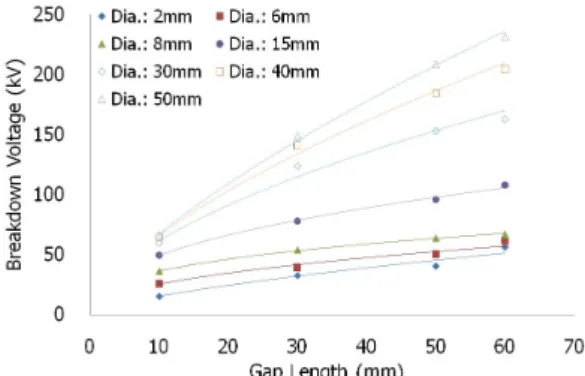
The electrical breakdown voltage of GN
2with various gap lengths and electrode diameters at 1 bar pressure is shown in Fig. 5. It is revealed that the electrical breakdown voltage increases in proportion to the gap length. Seen from Fig. 5, the saturation tendency of electrical breakdown voltage caused by size effect appears when the sphere electrode is over 40 mm in diameter [5]. This phenomenon is also shown in the experimental results at 4 bar pressure.
Fig. 6 shows the electrical breakdown voltage of GN
2at 4 bar pressure condition.
4.2. Discussion
The E
max,meanof GN
2at 1 bar and 4 bar pressure could be calculated by the experimental results and Eq (2). Through the calculation, it is found that the graph plots of E
max,meancould be fitted by exponentially decaying formula according to the ξ increases. The functional relation between the ξ and the E
max,meanunder AC experiment on GN
2is shown in Fig. 7. As shown in Fig. 7, the E
max,meandecreases as the ξ increases until it reaches about 0.2. When the ξ is over 0.2, there is no drastic variation of the E
max,meanand maintain nearly constant value. Especially, this is more obviously observed in 1 bar pressure condition. The empirical formulae for estimating the E
max,meanand the AC electrical breakdown voltage could be inferred from trend curves as follows:
479 . 1 0
1 ,
max,mean bar
= f ( ξ
bar) = 1 . 65 × ξ
−E (3)
412 . 4 0
4 ,
max,mean bar