─ 258 ─
ISSN: 2288-1115(Print), 2288-1123(Online)ⓒ The Korean Society of Limnology. All rights reserved.
This is an open-access article distributed under the terms of the Creative Commons Attribution Non-Commercial License(http://creativecommons.org/licenses/by-nc/3.0/), which permits unrestricted non-commercial use, distribution, and reproduction in any medium, provide the original work is properly cited.
서 론
녹조(green-tide)는 부영양 또는 과영양 수준의 담수 수 체에서 고온기 여름철을 중심으로 소수 종의 남조류가 대 량으로 발생하여 수표면과 가장자리에 고밀도로 집적되 는 스컴성 현상(water-blooms)을 일컫는다(Reynolds and
소옥천 하류 (추소리)에서 녹조현상 경감기술의 현장 시험 적용 및 효과 비교
신재기*·김영성1·노준우1·김종명2·황순진3,*
한국수자원공사 낙동강남부권관리단, 1한국수자원공사 K-water연구원, 2(주)제이엠이엔비,
3건국대학교 보건환경과학과
Application Testing and Comparative Effectiveness of Green-tide Mitigation Technique in the Lower Part (Chusori) of the So-ok Stream (Daecheong Reservoir), Korea. Shin, Jae-Ki* (0000-0002-5380-5078), Youngsung Kim
1(0000-0001-5422-1915), Joonwoo Noh
1(0000-0001-8998-9596), Jong-Myung Kim
2(0000-0002- 9467-1360) and Soon-Jin Hwang
3,* (0000-0001-7083-5036) (Office for Southern Region Management of the Nak- dong River, Korea Water Resources Corporation (K-water), Busan 49300, Republic of Korea;
1K-water Research Institute, Korea Water Resources Corporation (K-water), Daejeon 34045, Republic of Korea;
2JM Environment and Bioscience Co. Ltd., Gwangmyung Gyeonggi 14322, Republic of Korea;
3Department of Environmental Health Science, Konkuk University, Seoul 05029, Republic of Korea)
Abstract This study was conducted to test the green-tide mitigation technique in the lower part of the So-
ok Stream(Chusori) of Daecheong Reservoir from June 27 to August 24, 2014. And the effects were compared with weekly monitoring result of the watching station of the algae alert system(AAS) as well as test beds reach. The green-tide in a test bed was begun from the upstream, and it was gradually transferred and spread toward the downstream by the hydrological factors. The total amount of algae removed by algae removal device during the test period was 33,920kg, and solids dewatered by natural gravity was 8,480kg. Also chlorophyll-a content was 2.83kg, the number of blue-green algae cells was equivalent to 78.6×10¹⁴ cells.Compared with the results of the watching station of AAS, the pre-concentrate removal work in the outbreak waters was able to suggest the possibility of green-tide mitigation. In addition, an effective management of the green-tide was required spatial and temporal occurrence information and practical device technology.
Particularly, the optimal timing of algae removal in the river-reservoir hybrid system was recommended at times before the monsoon rainy season and reached the lowest water level.
Key words: Daecheong Reservoir, water-bloom, green-tide, algae removal, algae alert system, mitigation,
mobile device techniqueManuscript received 21 June 2016, revised 11 October 2016, revision accepted 25 October 2016
* Corresponding author: Tel: +82-10-3870-6121, Fax: +82-51-529-3168, E-mail: [email protected]
Tel: +82-2-450-3748, Fax: +82-2-456-5062, E-mail: [email protected]
Walsby, 1975; Watanabe et al., 1994; Shin, 1998; Shin et al., 2003a). 그 정도는 조류의 양이 수생태계뿐만 아니라 물을 이용하는 인간에게까지 피해를 줄 정도로 엄청나게 많음을 가리키며(Reynolds, 1984; NRA, 1990; Paerl, 2014), 최근 들어, 조류독소(microcystin)에 더하여 이취미 원인물 질(geosmin, 2-MIB)의 2차 영향까지 부각되어 관리를 강 화하고 있는 실정에 있다(GRERC, 2012; Kim et al., 2014).
소옥천은 금강 중류에 위치하고 있는 대청호의 주요 지 류 중의 하나이다(Shin et al., 2016b). 과거 댐 완공 후 담 수 초기부터 수질 부영양화에 대한 대명사로 손꼽혔던 것 은 내수면가두리양식장과 소옥천 수역이었다(Lee et al., 1993). 이 중에서 가두리양식장은 2001년에 완전 철거되었 으나, 소옥천의 추소리 수역은 여전히 고질화된 녹조현상 에서 벗어나지 못하고 현재까지 미해결 상태의 과제로 남 아 있는 상태에 있다(Shin et al., 2016b). 그동안 이를 개선 하고자 막대한 예산과 많은 노력을 기울여 왔으나 좀처럼 진전되지 않고 있으며, 그 이유는 물환경시스템 자체가 하 천과 저수지의 성향을 공히 가진 매우 역동적이고 복잡한 구조를 가지고 있기 때문이었다(Shin et al., 2003a). 또한, 현장을 중심으로 한 물리, 화학 및 생물학을 아우르는 육수 학적 관점의 문제 해결형 통합 장기연구가 없었고, 선행된 단기 또는 개별 조사연구는 다양한 현상들의 자세한 분석 과 해석이 매우 부족하였기 때문이었다(Shin et al., 2016b).
그 결과, 실질적 효과를 거둘 수 있는 대책은 미흡하였고, 단편적 연구결과만으로 문제의 원인 규명과 해결 방안을 찾고자 하여 시간이 경과될수록 의혹만을 더욱 증폭시킨 점도 또 다른 주요한 원인으로 제기될 수 있었다.
소옥천에 관한 선행연구는 주로 유역 오염부하, 수질 및 퇴적물에 관한 내용이었고, 대부분 부영양화와 녹조현상 해결에 초점을 맞추고 있었다. 유역의 오염부하 관점에서, Oh et al.(2004)은 강우시 비점오염원 유출 특성 연구에서 초기 강우에 의한 오염부하 관리의 중요성과 탁수 유입에 의한 수질오염을 지적하였고, Jeong et al.(2012)은 토양유 실 우심지역 선정 및 대책 연구에서 경작지와 채광지 관리 를 강조하였다. Park et al.(2015)은 오염 우심지역 선정 결 과로부터 토지계와 축산계의 배출부하 제어를 언급하였고, Shim et al.(2015)은 대청호의 수질에 미치는 영향으로써 소옥천의 유입부하가 절대적임을 제시하였다. Shin and Cho(2000)는 남조류 Microcystis 개체군에 의한 녹조현상 으로 수질 부영양화가 가중됨을 생물검정하였고, Kim et al.(2005)은 미세조류의 생리생화학적 분석을 통해 녹조 발생의 잠재력을 탐색하였다. Shin et al.(2003a)은 하천-저 수지 hybrid 시스템에서 녹조현상의 원인으로 점오염원인 하수처리수와 빈산소(hypoxia) 저질층에서 영양염 용출 및
수문학 요인의 복합적 영향이 결정적임을 지적하였다. 또 한, Shin and Cho(2001), Oh and Cho(2015) 및 Oh et al.
(2015)은 퇴적물의 오염도와 영양염 용출 잠재력 평가를 통한 남조류 증식에 기여 가능성을 제시하였다. 이상의 연 구결과를 종합할 때, 추소리 수역에서 발생하는 녹조현상 은 외부 오염과 내부 오염의 복합적이며, 다양한 원인에 기 인하는 것으로 추정할 수 있었다. 따라서 다각적인 연구를 추진하는 것도 필요하겠지만 많은 시간, 노력 및 비용이 요 구되는 어려움이 있기 때문에 동시에 단기적으로 경감할 수 있는 기술 효과적 접근 전략도 필요하였다.
본 연구는 대청호에서 매년 녹조현상이 가장 극심한 소 옥천 추소리 수역에서 이동식 녹조 제거 장치(Shin et al., 2014)를 현장 테스트하였으며, 그 효과를 환경부(금강유역 환경청)가 운영 중인 조류경보제 관찰 지점의 주간 모니터 링 결과로써 비교하였다. 이를 통해, 대댐 저수지의 하천~
저수지 구간에서 발생하는 녹조현상 경감기술에 대한 정 보를 제공하고자 하였다.
재료 및 방법
1. 조사지 개황
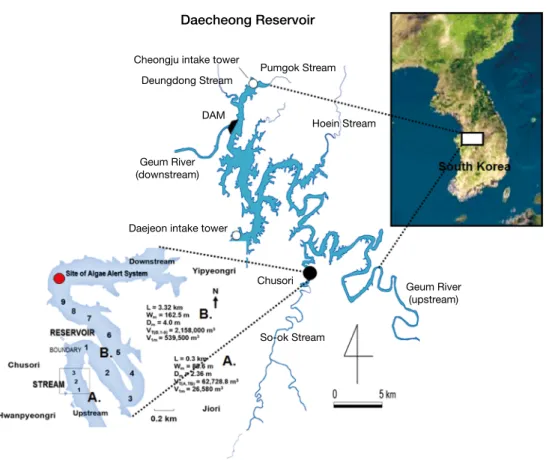
1975년 3월부터 1981년 6월까지 댐 건설로 만들어진 대 청호는 금강 수계의 중류에 위치하며(Fig. 1), 저수 면적은 72.8km2이고, 총 저수량은 1,490×106 m3로써 그 규모로 볼 때 우리나라에서 세 번째로 큰 다목적 인공호이다(Shin et al., 2016b). 충남, 충북과 대전광역시의 광역 수원으로써 국가의 수자원 측면에서 중요한 기능을 하고 있다. 소옥천 은 유역 면적과 유로 연장이 각각 537.2km2 (농경지 20.0
%, 임야 65.3% 및 주거 공용지 14.7%)와 29.0km로써 대 청호의 중상류에서 금강 본류로 유입하는 주요 지류이다 (Shin et al., 2003a). 그 중 추소리 수역은 지리지형적으로 하천의 하류와 저수지의 최상류부가 교차하는 지역에 위 치함으로써 댐 운영의 수위 변동에 따라 유수역과 정수역 의 형태 변화를 반복하는 전형적인 하천-저수지 hybrid 시 스템의 전이대 구간에 해당한다(K-water, 2007). 따라서 이 수역의 수질과 생태계의 물 환경은 시공간적으로 구조와 기능을 달리하고 있을 뿐만 아니라 유역의 오염 상황과 강 우-수문학적 패턴에 따라 녹조현상도 시시각각 변동하는 독특한 지역으로 볼 수 있다(Shin et al., 2016b).
현장조사는 2014년 5월부터 10월까지 수행하였고, 필요 시에 국지적인 관찰 조사를 추가하였다. 조사지점(테스트 베드)은 수위 변동곡선을 기준(예, 장마 전)으로 추소리 수
역을 하천 성향이 강한 상류(A)와 저수지 성향이 우세한 하류(B)로 구분하였고, A구간에서 3개 지점(A1~A3, N36°
20′56.9″~E127°33′56.0″), B구간에서 9개 지점(B1~B9,
N36°20′38.3″~N36°21′11.2″, E127°33′44.5″~E127°34′
12.4″)을 각각 선정하여 총 12개 지점이었다(Fig. 1, Table 1). 각 지점마다 부표를 설치하였고, GPS(Garmin, USA)를
Fig. 1. Map showing the test-bed area of Chusori and study sites for an experimental application of green-tide removal device in the So-ok
Stream of Daecheong Reservoir.
Cheongju intake tower
Daecheong Reservoir
Pumgok Stream Deungdong Stream
Daejeon intake tower
Hoein Stream
Chusori
So-ok Stream Geum River
(downstream)
Geum River (upstream) DAM
Table 1. Description for test-bed area and sampling locality in the So-ok Stream of Daecheong Reservoir from May to August, 2014.
Sampling
stations Location Width (m) Water depth (m)
Remarks Mean Left Center Right
A1 A2
A3 N36°20′45.0″, E127°33′54.4″ 88.5
110.7 209.5
4.2 3.3 3.4
7.2 5.9 2.9
3.5 3.8 5.4
1.8 0.3 1.8
L=0.30 km W=88.6 m D=3.4 m V
T=62.7×10
3m
3V
1=26.6×10
3m
3B1 B2
B3 B4 B5 B6 B7 B8 B9
N36°20′56.9″, E127°33′56.0″
N36°20′49.2″, E127°34′02.4″
N36°20′38.3″, E127°34′10.2″
N36°20′47.2″, E127°34′12.4″
N36°20′53.3″, E127°34′06.7″
N36°20′59.3″, E127°34′01.3″
N36°20′05.7″, E127°33′55.4″
N36°21′06.5″, E127°33′51.6″
N36°21′11.2″, E127°33′44.5″
110.7 88.5 209.5 210.5 96.5 167.0 227.5 195.5 156.5
4.2 3.3 3.4 4.1 4.4 3.9 4.5 3.9 4.6
7.2 5.9 2.9 1.6 4.3 5.6 4.1 1.7 0.8
3.5 3.8 5.4 3.5 5.7 5.5 6.5 3.9 6.7
1.8 0.3 1.8 7.3 3.2 0.7 3.0 6.0 6.4
L=3.32 km
W=162.5 m
D=4.0 m
V
T=2,158×10
3m
3V
1= 539.5×10
3m
3 L: length, W: width, D: depth, V: volume.이용하여 매번 조사 시 위치를 확인하였다.
A구간(L=0.3km, VT=62,728.8m3, V1m=26,580m3)에 서 하폭과 수심의 평균값(범위)은 각각 88.6m(81.0~95.5 m), 2.4m(1.6~3.5m)이었고, B구간(L =3.32km, VT= 2,158,000m3, V1m=539.500m3)은 각각 162.5m(88.5~
210.5m), 4.0m(0.7~7.2m)이었다. 하폭은 다소 넓어졌다 좁아졌다를 반복하였고, 수심은 암반이 병풍처럼 넓게 펼 쳐진 곳에서 깊었고, 좌안 또는 우안에서 교대로 증감하는 지형 구조를 나타냈다(Table 1). 본 연구를 수행하는 기간 에 A구간은 하상 바닥을 들어내기 직전의 수심 상태이었 고, B구간은 초기 녹조현상의 조짐 징후를 보이기 시작하 였다. 환경부 금강유역환경청에서 운영하는 조류경보제 (algae alert system, AAS)의 관찰 지점(Chuso)은 테스트베 드 구간의 최하류 B9 지점보다 약 0.5km 하류에 위치해 있다(Fig. 1).
2. 강우·수문 및 조류경보제 관측자료 분석
강수량과 수문 관측자료는 대청호 유역에 분포하고 있 는 기상측후소와 한국수자원공사 대청댐관리단에서 관측 한 일 누적자료 또는 평균값을 이용하였다. 유량은 유입량 과 유출량으로 구분하였고, 유출량은 수문, 발전 및 취수량 으로 각각 나누었다. 저수지의 주요 제원은 한국수자원공 사에서 발간된 대청댐관리연보(K-water, 2015)를 활용하 였다. 조류경보제의 관찰 지점에서 조사된 수온, chl-a 및 남조류 현존량(세포수)의 주간자료는 환경부 금강유역환 경청(수계관리위원회)으로부터 제공받았다.
3. 현장조사 및 실험분석
수질분석을 위한 시료는 표층수를 이용하였고, A구간은 수심이 얕아서 하상에 흐르는 물을 직접 채수하였으며, B 구간은 수심과 퇴적층을 고려하여 고무보트를 이용하였다. 채수한 시료는 아이스박스에 담아 보관한 후 차량을 이용 하여 12시간 이내에 실험실로 옮겼고, 즉시 전처리 및 분 석하였다(APHA, 1992). 수온과 DO는 YSI-550A meter, pH는 Orion 230A+ meter, Conductivity는 WTW-34meter, 탁도는 HACH 2400N meter를 이용하여 현장에서 각각 측 정하였다. Chlorophyll-a(chl-a) 농도는 시료를 Whatman GF/F filter에 여과한 후 90% ethanol로 비등 추출하는 Nusch(1980)법으로 정량하였다.
식물플랑크톤 시료는 정성분석과 정량분석을 병행하였 다. 정성시료는 식물플랑크톤 네트(20μm mesh, Wildco USA)를 이용하여 채집한 후, 생물량 분석시료를 제외하 고 즉시 formalin으로 고정하였다. 정량시료는 1리터를 채
수한 후 Lugol’s 용액으로 고정하였다(APHA, 1992). 또한, 정량시료는 고정한 시료를 1주일 이상 침강시켰고, 상등액 을 조심스럽게 뽑아내고 일정량(100~200mL)으로 농축한 후 계수하는 데 이용하였다. 종조성은 400× 또는 1,000×
배율의 광학현미경 하에서 검경 관찰로써 파악하였고, 현 존량은 200× 배율에서 Sedgwick-Rafter chamber를 이용 하여 계수하였다(APHA, 1992). 규조류는 Jensen(1984), Krammer and Lange-Bertalot(1986, 1988, 1991a, b)를, 규조류 이외 다른 분류군은 Hirose et al.(1977), Prescott (1982) 및 Watanabe et al.(1996) 문헌을 참고하여 동정하 였다.
4. 녹조현상 경감기술의 현장 시험 적용
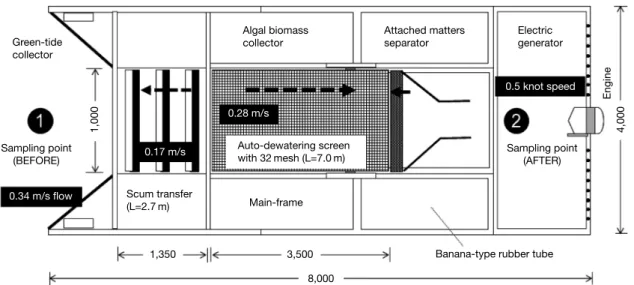
현장에서 조류의 직접 제거는 Shin et al.(2014)에 의해 소개된 조립분해 가능한 이동식 장치(L 8,000×W 4,000×
H 1,00mm)를 이용하였다. 장치의 세부 구성은 본체(main frame)와 부력재(rubber tube boat), 이송호퍼(scum transfer connected with green-tide collector), 스크린 컨베이어(algal biomass collector), 녹조 선별기(attached algae separator) 및 회수조체 수집기(harvest pocket) 등 총 5개 모듈로 되었 다(Fig. 2). 여름철 일조시간을 고려하여 10시간 작업할 때 녹조를 제거할 수 있는 수표면 규모는 500×103 m2 day-1 이었다(Shin et al., 2014). 수심과 녹조 양상을 고려하여 5 월에는 A1~A3 구간에서, 6월~8월에는 B1~B9 구간에서 각각 시험 적용하였다(Fig. 1, Table 1 참고). 수중의 chl-a 농도가 50mgm3를 초과하거나 수표면에 부상하여 집적되 는 현상이 관찰될 때 장치를 가동하였다. Chl-a 농도의 시 공간적 현장모니터링은 조류 분류군별 광합성 색소량을 총 량으로 정량할 수 있는 Fluoro-probe meter(bbe company, Germany)를 이용하였고, 필요 시에는 시료를 별도로 채수 하여 실험실 분석도 병행하였다. 장치의 적용 효과는 수면 에서 이동하며 작업할 때 앞쪽(①)과 뒤쪽(②)에서 각각 sampling하여 운영 전·후 차이로써 비교하였고, chl-a, 식 물플랑크톤 종조성, 현존량 및 탁도 항목을 중심으로 조사 분석하였다(Fig. 2).
결과 및 고찰
1. 강수량 및 수문요인의 변동 특성
대청호 유역에서 2012년 1월부터 2015년 12월까지 관측 된 강수량, 유입량 및 유출량의 기상 및 수문 결과는 Figs.
3~5, Table 2와 같다. 2012년, 2013년, 2014년 및 2015년
에 총 강수량은 각각 1,428.7mm, 957.9mm, 996.6mm 및 735.8mm로써 연도별 차이가 매우 컸다. 그 차이는 최대 693mm이었고, 무강수일을 제외한 연평균 일강수량은 4.7~
8.4mm 범위이었다(Fig. 3). 강수량의 최대값과 최소값은 각각 103.8mm, 0.1mm로서 그 차이가 매우 컸고, 최대 강 수량은 평균 총 강수량의 7.3%에 해당하였다(Table 2). 유 입량이 유출량을 초과하는 시기를 기준으로 할 때, 7월~9 월은 풍수기에 해당하였고, 11월~2월은 상대적으로 수량 이 적었던 갈수기로 구분되었다. 강수량의 연중 변동은 계 절적인 편차가 심하여 여름철에 풍부하고 겨울철에 빈약
한 현상이 현저하였다(Shin et al., 2003b; Park et al., 2015).
유입량은 강우의 직접적인 영향이 커서 강우가 있은 직 후에 급증하는 경향을 보였다(Fig. 3). 이러한 양상은 강 수량이 30mm 이상일 때 두드러졌다(Shin et al., 2003b, 2016b). 매년 총 유입량은 각각 36,872.1m3 s-1, 19,474.8 m3 s-1, 19,322.0m3 s-1 및 12,780.8m3 s-1로써 평균 유입량 은 22,112.4m3 s-1이었다(Fig. 3). 2014년의 유입량은 2012 년에 비해 47.6% 정도 적었고, 2015년에 비해 33.8% 많았 다(Table 2). 연간 변동에서 월별 유입량의 최대값과 최소 값은 각각 7월~9월에 2,081.7~12,354.8m3 s-1, 2월, 9월
Fig. 3. Seasonal fluctuations of rainfall, total inflow, inflow inside the dam basin and discharge of the upstream dam discharge in Daecheong Reservoir from January 2012 to December 2015. Vertical bar indicates the algae removal period in the Chusori area of the So-ok Stream from June 27 to August 24, 2014.
3000
2500
2000
1500
1000
500
0
J M M J S N J M M J S N J M M J S N J M M J S N 2012 2013 2014 2015
Sampling date
3000
2500
2000
1500
1000
500
0
300
200
100
0 150
100 50 0
Total inflow discharge(m3 s-1) Inflow of inside basin(m3 s-1) Upstream dam discharge(m3 s-1)
Rainfall(mm)
Fig. 2. Schematic diagram showing external morphology (unit: mm), each module and operating condition of the green-tide removal device.
Numerics ①, ② within circle symbols indicate before and after sampling point during device operation.
Green-tide collector
Algal biomass
collector Attached matters
separator Electric
generator
Sampling point (AFTER) Sampling point
(BEFORE)
Banana-type rubber tube Main-frame
1,350
0.5 knot speed
0.34 m/s flow
0.17 m/s
0.28 m/s
4,000
1,000 Engine
3,500 8,000 Auto-dewatering screen with 32mesh (L=7.0m)
Scum transfer (L=2.7m)
및 11월에 545.2~665.8m3 s-1 범위로써 그 시기는 다소 차 이가 있었다. 또한, 유입량의 증가는 강우 빈도와 양에 의 해 7월~9월 사이에 뚜렷이 집중되었다(Fig. 3). 이 시기의 유입량은 3,465.9~27,717.3m3 s-1 범위이었고, 연중 총 유 입량의 27.1~72.9%를 차지하여 변동 폭은 컸으나 저수 지에서 수문 변화가 가장 급변하는 시기로 볼 수 있었다 (Shin et al., 2003b).
2012년, 2013년, 2014년 및 2015년에 총 방류량은 각각 36,399.4m3 s-1, 22,754.5m3 s-1, 16,764.0m3 s-1 및 16,950.5 m3 s-1로써 평균 방류량은 23,217.1m3 s-1이었다(Fig. 4). 연
간 총 방류량은 강수량 및 유입량과 밀접한 관련성이 있었 다. 그리고 유입량은 첨예한 peak값을 보였으나, 방류량은 수문방류를 제외하고 조절되는 양상이 역력하였다(Fig. 4).
수문조작에 의한 여수로 방류량은 64.6~760.6m3 s-1 범위 로써 평균값은 23.1m3 s-1이었다(Table 2). 저수지의 유출 은 크게 세 부분으로 구분할 수 있다. 저수지의 가장 하류 인 댐에 위치한 수문-여수로와 수력발전 및 각종 용수의 취수에 의한 방류가 이에 해당한다. 수문방류 시기는 2012 년에 연중 8월과 9월에 총 22일로써 제한되었고, 개방기간 은 유입량과 수위 변동에 따라 3일~11일 범위이었다(Fig.
Fig. 4. Seasonal fluctuations of total outflow, hydropower generation discharge and watergate outflow in the lower part of Daecheong Res- ervoir from January 2012 to December 2015. Vertical bar indicates the algae removal period in the Chusori area of the So-ok Stream from June 27 to August 24, 2014.
1000 800 600 300
250
200
150
100
50
0
J M M J S N J M M J S N J M M J S N J M M J S N 2012 2013 2014 2015
Sampling date
500
400
300
200
100
0
1000
800
600
400
200
0
Total outflow discharge(m3 s-1) Hydropower generation(m3 s-1) Watergate outflow(m3 s-1)
Fig. 5. Seasonal variations of impoundment, water level and water storage in Daecheong Reservoir from January 2012 to December 2015.
Vertical bar indicates the algae removal period in the Chusori area of the So-ok Stream from June 27 to August 24, 2014.
1400
1200
1000
800
600
400
J M M J S N J M M J S N J M M J S N J M M J S N 2012 2013 2014 2015
Sampling date
80
75
70
65
60
100
80
60
40
20
0
Impoundment(106 m3) Water level(EL. m) Water storage(%)
4). 수문과 여수로를 통한 평균 방류량은 연간 방류량의 11~29% 범위에 해당하였고, 평균 방류량보다 8~11배 더 많았다. 이때는 태풍(Khanun, Tembin, Sanba)이 연속적으 로 상륙한 기상 영향이 컸고, 저수지의 수체가 가장 크게 유동되는 짧은 시기로 볼 수 있었다(Shin et al., 2016b). 수 력발전 방류량은 0~762.1m3 s-1 범위로써 평균 방류량은 23.1m3 s-1이었다(Fig. 4, Table 2). 발전 방류량의 변동 양 상은 상류나 유입지류로부터 유입되는 유량과 밀접한 관 련성을 보였다(Fig. 3 참고). 유입량이 큰 시기에 발전 방류 량도 많았고, 다른 계절보다도 봄철~가을철 사이에 평균 방류량을 초과하였다(Fig. 4). 발전 방류량은 총 방류량의 23.2% 수준이었고, 거의 매일 방류되었다. 이것은 저수지 하류 하천(금강)의 보 pool에 환경유지용수로써 활용되고 있다.
총 저수량은 2012년, 2013년, 2014년 및 2015년에 각각 338,966.8×106 m3, 289,862.8×106 m3, 284,865.4×106 m3
및 259,692.7×106 m3이었고, 평균 저수량은 293,346.9×
106 m3이었다(Fig. 5, Table 2). 저수율은 범위와 평균값이 각각 35.2~84.8%, 53.9%이었다(Table 2). 이때 저수지 수 위의 변동은 EL. 64.0~77.9m 범위이었고, 평균값은 EL.
69.9m이었다(Table 2). 수위는 강수량에 의한 유입량과 방 류량에 의존적이나 저수지의 특성상 강우기에 저장하고 비 강우기에 배출하는 조절 패턴을 보였다(Shin et al., 2003b).
또한, 몬순장마와 홍수 조절을 고려하여 매년 6월 하순에 최저 수위로 낮추었고, 이후 강우에 의해 7월~9월 동안에 다시 수위를 높이는 경향성이 반복되었다(Fig. 5). 그러나 일기예보의 상황에 따라 2014년과 같이 예외적인 경우도 있었다(K-water, 2007). 방류에 의한 수위 조절은 10월~4 월까지 완만한 하강을 보이다가, 5월~6월 시기에 급격한 기울기의 감소를 보였다. 특히, 이 시기는 봄철에서 여름철 로 이행하는 계절적 특성에 의해 장마 전 온도가 급증하는 때이다(Shin et al., 2016a). 따라서 수심이 최저로 얕아지게
Table 2. Basic statistics of rainfall and hydrological factors associated with water quantity observed in the watershed of Daecheong Reser-
voir from January 2012 to December 2015. The values indicate mean, standard deviation, maximum and minimum, respectively.
Factors/Years Total 2012 2013 2014 2015
Daily rainfall (mm) 2.8±8.8
(103.8/0.1) 8.4±16.8
(103.8/0.1) 6.0±10.4
(70.7/0.1) 6.7±11.9
(75.5/0.1) 4.7±8.1 (52.9/0.1) Inflow (m
3s
-1)
- Total inflow 60.5±132.8
(2,022.7/12.4) 100.7±238.6
(2,022.7/12.4) 53.4±57.2
(805.2/12.0) 52.9±84.9
(799.3/10.9) 35.0±27.9 (377.5/10.2) - Inflow inside the dam basin 49.6±128.9
(1,880.1/0.8) 87.3±230.6
(1,880.1/2.4) 41.9±57.4
(795.1/2.1) 43.0±85.0
(789.5/0.8) 26.0±27.8 (368.2/1.3) - Discharge of the upstream dam 11.0±14.0
(295.9/6.4) 13.5±27.3
(295.9/6.4) 11.5±5.6
(39.6/7.6) 10.0±0.4
(10.7/7.4) 9.0±1.3 (10.2/5.1) Outflow (m
3s
-1)
- Total outflow 63.6±80.2
(993.6/16.8) 99.5±148.9
(993.6/35.6) 62.3±31.1
(142.1/25.7) 45.9±14.5
(80.7/28.5) 46.4±22.5 (97.7/16.8)
- Hydropower generation 45.8±37.4
(229.4/7.9) 64.3±58.7
(229.4/25.1) 50.7±30.2
(130.4/15.2) 33.7±12.8
(63.3/18.6) 34.4±20.9 (84.0/7.9)
- Watergate outflow 5.8±54.8
(762.1/0.0) 67.0±175.9
(762.1/0.0) - - -
- Water withdrawal of Daejeon waterway 5.4±0.3
(6.6/1.7) 5.6±0.4
(6.3/1.7) 5.5±0.2
(6.2/4.7) 5.4±0.3
(6.3/4.1) 5.3±0.3 (6.6/3.9) - Water withdrawal of Cheongju waterway 4.7±0.4
(8.0/0.8) 4.9±0.3
(5.3/2.6) 4.7±0.3
(5.3/2.6) 4.6±0.5
(5.1/0.8) 4.6±0.3 (8.0/2.4) - Water intake for agriculture and environment 1.9±2.4
(18.2/0.0) 1.7±1.9
(6.4/0.0) 1.5±2.0
(7.5/0.0) 2.1±2.6
(18.2/0.0) 2.2±2.7 (8.1/0.0)
Impoundment (×10
6m
3) 803.1±165.1
(1,263.2/525.0) 926.1±168.1
(1,263.2/569.7) 794.1±88.5
(1,036.4/599.7) 780.5±157.8
(1,019.2/525.0) 711.5±155.1 (975.9/542.3)
Water level (EL. m) 69.9±3.2
(77.9/64.0) 72.3±3.1
(77.9/65.1) 69.9±1.7
(74.3/64.0) 69.5±3.1
(74.1/64.0) 68.1±3.2 (73.3/64.4)
Water storage (%) 53.9±11.1
(84.8/35.2) 62.2±11.3
(84.8/38.2) 53.3±5.9
(69.6/40.3) 52.4±10.6
(68.4/35.2) 47.8±10.4
(65.5/36.4)
되면 수온 상승과 함께 저질층 용출의 내부 부하를 유도할 수 있는 가능성이 제기될 수 있었고(Shin and Cho, 2001;
Shin et al., 2003a; Oh et al., 2015), 조류 증식에 요구되는 영양염 요인이 펄스될 수도 있다.
2. 테스트베드 내의 chl-a 농도 및 조류 종조성 현황 소옥천의 A구간에서 측정된 chl-a 농도는 7.6~11.7mg m-3 범위이었고, 평균값은 9.6mgm-3이었다. 반면에, B 구간은 각각 26.7~2,856.0mgm-3, 1,368.4mgm-3이었다 (Table 3). 이때 수중의 탁도는 100NTU를 월등히 초과하 였다. 또한, A와 B구간에서 각각 상류에서 하류로 갈수록 감소하는 양상을 보였는데, 유속 흐름의 변화로 인해 축적, 침강 및 이동하는 과정적 형태로 볼 수 있었다(Thornton et al., 1990). B구간에서 관찰된 식물플랑크톤의 종조성 은 12속 14종이었고, 규조류 3속 3종, 남조류 6속 7종 및 녹조류 3속 4종이었다(Table 4). B1, B3 및 B9에서 총 현 존량은 각각 14.5×10⁶ cellsmL-1, 57.4×10⁵ cellsmL-1 및
40.3×10³ cellsmL-1이었다. 이 중에서 남조류 Microcystis aeruginosa가 B1에서 99.9%(14.5×10⁶ cellsmL-1), B3에 서 99.8%(57.3×10⁵ cellsmL-1)이었다. 반면에, B9에서 M.
aeruginosa는 전혀 관찰되지 않았고, Anabaena circinalis (51.4%, 20.7×10³ cellsmL-1)와 Oscillatoria formosa(45.6
%, 18.4×10³ cellsmL-1)가 비교적 풍부하였다.
소옥천의 추소리 수역은 짧은 구간이지만 다소 차이를 보였고, 남조류 Anabaena와 Oscillatoria가 Microcystis보 다 선행하여 우점한 것으로 볼 수 있었다. 시공간적으로 볼 때, 이들 분류군은 지역적 차이뿐만 아니라 동일한 장소에 서 수층별 분포(예, Microcystis(상층)-Anabaena-Oscilla- toria(저층))를 달리하기도 하였다(Shin et al., 2003a; K- water, 2007). 국내 하천과 저수지의 장소에 따라 차이는 있지만, 녹조가 대발생 가능한 우심 수역을 중심으로 여름 철 장마 직전과 장마 후 1주일 정도 경과되면 어김없이 발 생하는 경향을 보이고 있다(Shin, 1998). 소옥천의 추소리 수역도 2014년 5월~8월 동안에 녹조 발생 양상을 일 단위 로 관찰한 결과 유사한 양상을 보이고 있었다. 일반적으로,
Table 3. Spatial distribution of chlorophyll-a concentration in the So-ok Stream of Daecheong Reservoir from June 25~26, 2014.
Factor/Sampling stations Chusori waters
A1 A2 A3 B1 B3 B9
Chl-a (mg m
-3) 11.7 9.6 7.6 2,856.0 1,225.4 26.7
Table 4. A list of phytoplankton flora and standing crops (cells mL
-1) observed in the So-ok Stream of Daecheong Reservoir from June 25~26, 2014.
Phylum/Sampling stations Chusori waters
B1 B3 B9
Bacillariophyceae Fragilaria crotonensis Melosira varians Navicula spp.
40 r .
r . r
r r Cyanophyceae .
Anabaena circinalis Anabaena flos-aquae Anabaena cylindrica Aphanizomenon flos-aquae Microcystis aeruginosa Oscillatoria formosa Oscillatoria limosa Phormidium tenue
2,990 . . 14,498,000 . 1,780 r .
5,400 . . 5,728,000 r 2,100 980 .
20,700 797 . r . 18,375 . . Chlorophyceae
Pediastrum duplex var. reticulatum Pediastrum simplex var. duodenarium Scenedesmus acutus
Staurastrum gracile
r . r .
. . r .
400 r
. .
r: rare.녹조를 형성하는 원인종은 남조류 Anabaena, Aphanizome- non, Microcystis, Oscillatoria 계열로써 사상체 또는 군체 형이 해당한다(Reynolds, 1987). 또한, 수질환경 조건에 따 라 각 분류군은 서로 다른 분포 및 발달 전략을 가지고 있 다(Reynolds, 1984; Shin, 1998; Wetzel, 2001; Kalff, 2002;
Paerl, 2014).
3. 녹조 시험제거 전후 chl-a 농도 및 조류 종조성 비교 현장조사 직후에 장치를 이용하여 녹조체를 직접 제거 하였다. A구간에서 제거 전과 후에 chl-a 농도(범위)는 각 각 20.8mgm-3 (18.0~24.4mgm-3, n =3), 17.4mgm-3 (14.3~17.4mgm-3, n=3)으로써 제거율은 16.4%이었다.
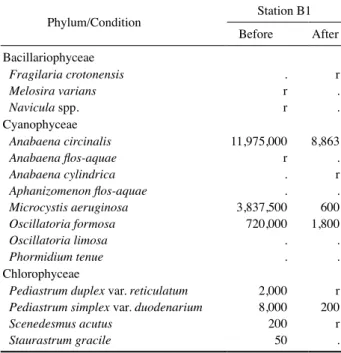
반면에, B구간은 각각 7,592.7mgm-3 (n=2), 17.1mgm-3 (n=2)으로써 제거율은 99.8%이었다(Table 5). 또한, 식물 플랑크톤의 종조성은 10속 13종이었고, 규조류 3속 3종, 남조류 4속 6종 및 녹조류 3속 4종이었다(Table 6). 현존량 은 제거 전에 16.5×10⁶ cellsmL-1이었고, 제거 후에 11.5×
103 cellsmL-1이었다. 분류군별로 보면, 제거 전에 남조류 A. circinalis(72.4%, 12.0×10⁶ cellsmL-1), M. aeruginosa (23.2%, 38.4×10⁵ cellsmL-1) 및 O. formosa(4.4%, 72.0×
104 cellsmL-1)가 대부분을 차지하였다. 제거 후에는 A.
circinalis(77.3%, 8.9×10³ cellsmL-1), O. formosa(15.7%, 1.8×10³ cellsmL-1) 및 M. aeruginosa(5.2%, 0.6×10³ cells mL-1)가 남아 있었다. 남조류와 녹조류의 분류군에 따른 제거율은 각각 >99.0%와 97.5%로써 큰 차이가 없었고, 특히 군체나 사상체 부유조류에서 효과적이었다(Table 6).
조류 생물량이 저농도인 A구간은 낮은 제거율을 보였으 나, 상대적으로 고농도인 B구간은 매우 높았다. 그 차이는 83.4% 정도이었고, B구간은 저수지 성향이 강하여 흐름이 미약한 반면에 A구간은 하천 성향이 어느 정도 유지되고 있어 흐름 유속에 의한 성장과 축적의 저해 요인도 작용하 였을 것(Kennedy et al., 1982; Thornton et al., 1990)으로 추정된다.
2014년 6월 27일부터 >50mgm-3 수준에서 매번 구간 별로 제거하였다. 이것은 테스트베드 구간의 상류로부터 조류경보제 관찰 지점의 하류에 이동 확산되는 것을 제어 하기 위한 목표도 포함하고 있었다. 장치운전 및 녹조 제거
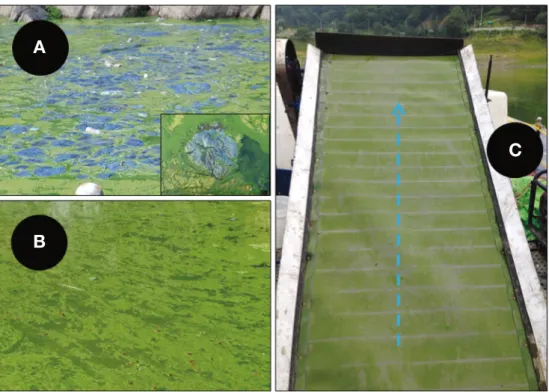
작업은 Shin et al.(2014)에 제시된 방법으로 하였다. 여름 철 녹조현상이 본격화되기 전에 수온의 점진적 증가와 간 헐적인 강우에 의해 하천구간 하상에서 자갈과 점토성 기 질의 표면에 붙어 있던 부착조류(epilithon 또는 epipelon) 가 탈리된 후 부유성 조각 형태(Stevenson et al., 1996)로 써 유하하여 유입되었다. 이것은 장마 전까지 상류 하천 또는 지류로부터 테스트베드 구간에 끊임없이 떠내려왔었 다. 이렇게 하여 B1구간의 부유성 녹조체와 부착성 조류체 가 혼재하게 되었고(Fig. 6A, B), 이것을 실시간 제거하였 을 때 최소한 1~3m3 day-1 범위로 처리되었다(Fig. 6C). 6 월 27일~8월 24일 동안에 제거한 조체의 총량은 33,920 kg이었고, 자연중력으로 탈수시킨 고형물은 8,480kg(25.0
%)이었다. 이것을 시료로 실험 분석한 결과, 총 chl-a 함량 은 2.83kg이었고, Reynods(1984)에 의한 남조류의 세포수 로 환산하면 78.6×10¹⁴ cells에 해당하였다.
Table 5. Comparison of chlorophyll-a concentration at before and after operation of algal removal device in the So-ok Stream of Dae- cheong Reservoir from June 25~26, 2014.
Factor/Condition Station A1~A3 Station B1
Before After Before After
Chl-a (mg m
-3) 20.8 (18.0~24.4) 17.4 (14.3~17.4) 7,592.7 17.1
Table 6. A list of phytoplankton flora and standing crops (cells mL
-1) observed in the So-ok Stream of Daecheong Reser- voir from June 25~26, 2014.
Phylum/Condition Station B1 Before After Bacillariophyceae
Fragilaria crotonensis Melosira varians Navicula spp.
r . r
r . Cyanophyceae .
Anabaena circinalis Anabaena flos-aquae Anabaena cylindrica Aphanizomenon flos-aquae Microcystis aeruginosa Oscillatoria formosa Oscillatoria limosa Phormidium tenue
11,975,000 r . 3,837,500 . 720,000 . .
8,863 r . 600 . 1,800 . . Chlorophyceae
Pediastrum duplex var. reticulatum Pediastrum simplex var. duodenarium Scenedesmus acutus
Staurastrum gracile
2,000 8,000 200 50
200 r
r .
r: rare.4. 조류경보제 관찰 지점에서의 경감기술 적용 효과 비교 2012년~2015년 동안에 환경부 금강유역환경청에서 조 류경보제 관찰 지점으로써 운영한 결과는 Fig. 7과 같다.
또한, 연도별 녹조 제거의 시기적 효과를 비교하기 위하여 본 연구의 시험기간이었던 2014년 6월 27일~8월 24일을 고려하여 2012년~2013년 및 2015년의 4월~6월과 9월~
11월을 I, 7월~8월을 II의 2개로 각각 구분하여 요약한 것
Fig. 6. Photographs showing the massive (A) and dense (B) conditions of algal bloom and harvesting of green-tide removal device (C) ob-
served in the test-bed waters (Chusori area) of the So-ok Stream during June to August, 2014.
A
B
C
Fig. 7. Weekly variations of water temperature, chlorophyll-a concentration and standing crops of blue-green algae determined in the ob- servation site (Chuso) of algae alert system of the So-ok Stream (Daecheong Reservoir) from April 2012 to November 2015. A black bar indicates the algae removal period from June 27 to August 24, 2014. Dashed and dotted lines are 50 mg m
3and 5,000 cells mL
-1, respectively.
400 350 300
Algae removal
100
75
50
25
0 40
35
30
25
20
15
10
5
0
J A J O J A J O J A J O J A J O 2012 2013 2014 2015
Sampling time(days)
106
105
104
103
102 Standing crops(cellsmL-1) Chlorophyll-a(mgm-3)
Water temperature(°C)
은 Table 7과 같다. 수온의 범위와 평균값은 각각 8.0~34.4
℃, 23.3℃이었고, 그 변동성은 무엇보다 계절적인 영향 이 컸다. I과 II 시기에 수온의 범위와 평균값은 각각 8.0~
29.7℃, 21.4℃와 25.3~34.4℃, 30.0℃이었다. 평균값에 의한 수온의 차이는 8.6℃이었다. Chl-a 농도의 범위는 2.1~347.5mgm3이었고, 평균값은 24.9mgm3이었다. I 시 기에 평균 농도(19.1mgm3)는 전체 평균값보다 낮았으나, II는 2014년을 제외하고 모두 20.2~67.9% 범위 정도 높았 다(Fig. 7, Table 7). 남조류 세포수에 의한 현존량의 평균 밀도는 7.7×10³ cellsmL-1이었다. II 시기의 현존량은 모 두 평균값을 초과하였으나, 2014년에만 월등히 낮은 상태 를 나타내었다(Table 7). Chl-a와 현존량에서 녹조 제거 시 험 후 크게 감소하였고, 다른 해에 비해 9월~12월까지 지 속적으로 처리 후 효과가 관찰되었다(Fig. 7). 테스트베드 에서 녹조 제거 시험 목표는 소옥천의 조류경보제 관찰 지 점에서 경보 단계인 25mgm3보다 2배 높고, 대발생 단계 인 100mgm3의 1/2 수준인 50mgm3를 초과하지 않는 것 으로 하였다. 이것을 금강유역환경청이 최근 4년(2012년~
2015년) 동안 운영한 조류경보제의 결과로써 비교하였을 때, 2014년의 녹조 제거 시험기간과 그 이후에만 그 값에 근접되거나 초과하는 경우가 관찰되지 않았다(Fig. 7). 따 라서, 본 연구에서 수행한 녹조 제거 시험 적용은 소옥천 추소리의 테스트베드 구간뿐만 아니라 그 하류에 위치하 고 있는 조류경보제 관찰 지점 수역의 녹조현상 경감에도 다소 기여할 수 있었음을 확인하게 되었다.
적 요
본 연구는 2014년 6월 27일부터 8월 24일까지 대청호의 소옥천(추소리) 하류에서 녹조현상 경감기술을 시험하기 위하여 중점 수행되었다. 그리고 그 효과는 테스트베드 구 간뿐만 아니라 조류경보제 관찰 지점의 주간 모니터링 결 과와 비교 분석하였다. 테스트베드에서 녹조현상은 상류에 서부터 시작하였고, 시간이 경과하면서 수문학적 요인에 의해 하류로 이송 및 확산되었다. 녹조 제거 장치의 시험 적용 동안, 조류를 제거한 총량은 33,920kg이었고, 이것을 자연중력에 의해 탈수시킨 고형물은 8,480kg이었다. 또한, Chlorophyll-a 함량은 2.83kg이었고, 남조류의 세포수로 환산하면 78.6×10¹⁴ cells에 해당하였다. 조류경보제 관찰 지점의 결과와 비교할 때, 대발생 수역에서 사전 집중제거 는 녹조현상 완화의 가능성을 제시할 수 있었다. 녹조현상 을 효과적으로 관리하기 위해서는 시공간적 발생 정보와 실용적 장치기술의 확보가 가장 우선되어야 하겠다. 특히 Table 7.
Y early comparison of major factors in the lower part of the So-ok Stream from 2012 to 2015. Item 2012 ~ 2015 2012 2013 2014 2015 Ⅰ Ⅱ Ⅰ Ⅱ Ⅰ Ⅱ Ⅰ Ⅱ W ater temperature (℃) 23.3 ± 6.3 (34.4/8.0) 21.2 ± 6.0 (29.1/9.8) 30.6 ± 2.2 (34.1/27.4) 21.1 ± 6.0 (28.5/9.8) 30.7 ± 2.1 (34.1/27.4) 22.0 ± 5.6 (29.4/8.0) 29.6 ± 2.9 (34.0/25.3) 20.9 ± 5.7 (29.7/1 1.8) 29.7 ± 2.6 (34.4/25.9) Chl-
a(mg m
-3) 24.9 ± 32.0 (347.5/2.1) 21.8 ± 20.2 (88.5/2.5) 52.3 ± 21.7 (87.1/24.6) 18.6 ± 12.2 (55.1/2.1) 77.6 ± 103.4 (347.5/15.2) 14.5 ± 12.2 (63.8/3.7) 14.9 ± 7.0 (28.4/8.5) 24.4 ± 17.9 (75.9/3.2) 31.2 ± 12.7 (50.2/16.1) Number of
>50 mg m
-3(mean values) 16 2 (78.2) 5 (67.6) 1 (55.1) 4 (138.9) 1 (63.8) 0 (0) 2 (63.9) 1 (50.2) Standing crops (× 10
3cells mL
-1) 7.7 ± 5.5 (1 13.2/0.0) 2.6 ± 4.9 (18.2/0.0) 18.0 ± 7.8 (29.1/8.0) 2.4 ± 3.0 (10.0/0.0) 44.1 ± 35.1 (1 13.2/4.4) 5.4 ± 8.2 (29.0/0.0) 0.9 ± 1.0 (2.7/0.1) 4.7 ± 6.1 (18.5/0.0) 16.0 ± 28.8 (91.3/0.7) Leading flora, when chl-
a peak- D BG D BG D BG D BG Issued state of algae alert system in Daecheong Reservoir W ith issued W ith issued W ithout issued W ith issued
Basic data are obtained from the Environmental Office of Geum River Watershed. D and BG indicate diatom and blue-green algae.하천-저수지 hybrid 구간에서 녹조 제거의 최적 시기는 장 마 이전과 최저 수위에 도달하였을 때로 볼 수 있었다.
REfEREnCES
APHA. 1992. Standard methods for the examination of water and wastewater. 16th edition, American Public Health As- sociation, Washington, D.C. USA.
Geum River Environment Research Center(GRERC). 2012. Oc- currence and Management of Odor Compounds Produced by Algae in the Geum River. NIER No. NIER-RP2012- 314. National Institute of Environmental Research, Ko- rea. 50p.(in Korean)
Hirose, H., M. Akiyama, T. Iriya, K. Imahori, H. Kasaki, S. Ku- mana, H. Kobayashii, E. Takahashi, K. Tsumura, M. Hi- rano and T. Yamagishi. 1977. Illustrations of the Japanese freshwater algae. Uchidarokakuho Publ. Co. Ltd. Tokyo, 927p.
Jensen, N.G. 1984. The pennate diatoms; A translation of Hustedt’s “Die Kieselalgen, 2., Teil” published by Jensen, N.G. Strauss & Cramer GmbH., Germany. 918p.
Jeong, D.H., H. Kim, Y.J. Lee, S. Hong, J. Yoon, H. Choi and H.L. Cho. 2012. A study on selection and measures of the apprehensive areas of soil loss in the So-ok Stream water- shed. Environmental Impact 21: 617-629.(in Korean) Kalff, J. 2002. Limnology: Inland Water Ecosystems. Prentice-
Hall, Inc., New Jersey, USA. 592p.
Kennedy, R.H., K.W. Thornton and R.C. Gunkel. 1982. The establishment of water quality gradients in reservoirs. Ca-
nadian Water Resources Journal 7: 71-87.
Kim, K.H., B.J. Lim, K.A. You, M.H. Park, J.H. Park, B.H. Kim and S.J. Hwang. 2014. Identification and analysis of geo- smin production potential of Anabaena stainisolated from North Han River using genetic methods. Korean Journal
of Ecology and Environment 47: 342-349.
(in Korean) Kim, M.K., J.K. Shin and H.K. Ji. 2005. Probe of algal growthpotential(AGP) by physio-biochemical analysis of mi- croalgae in the stagnant watershed. Algae 20: 127-132.(in Korean)
Korea Ministry of Environment(MOE). 1998. A White-Paper of Environment. Ministry of Environment, Seoul, Korea.(in Korean)
Korea Water Resources Corporation(K-water). 2007. A Study on the Development Mechanisms and Reduction Tech- nology of Water-Bloom in the River-Reservoir System.
Interim Report No. KIWE-WERC-2007-03. Daejeon, Korea. 101p.(in Korean)
Korea Water Resources Corporation(K-water). 2015. Annual Report of Dam Operation Management. Daejeon, Korea.
(in Korean)
Krammer, K. and H. Lange-Beralot. 1986. Bacillariophyceae, 1.
Teil: Naviculaceae. VEB Gustav Fischer Verlag. 876p.
Krammer, K. and H. Lange-Beralot. 1988. Bacillariophyceae, 2.
Teil: Bacillariaceae, Epithemiaceae, Surirellaceae. VEB Gustav Fischer Verlag. 596p.
Krammer, K. and H. Lange-Beralot. 1991a. Bacillariophyceae, 3.
Teil: Centrales, Fragilariaceae, Eunotiaceae. VEB Gustav Fischer Verlag. 576p.
Krammer, K. and H. Lange-Beralot. 1991b. Bacillariophyceae, 4.
Teil: Achnanthaceae, Kritische Erganzungen zu Navicula (Lineolatae) und Gomphonema Gesamtliteraturverzeich- nis Teil 1-4. VEB Gustav Fischer Verlag. 437p.
Lee, K.J., W.M. Heo and B. Kim. 1993. Phosphorus loadings from watershed and fishfarms into Lake Daechung and the phosphorus budget. Journal of Korean Society on Wa-
ter Quality 9: 80-85.
(in Korean)National Rivers Authority(NRA). 1990. Toxic Blue-Green Al- gae. Water Quality Series No. 2, A report by the NRA, London, UK. 125p.
Nusch, E.A. 1980. Comparison of different methods for chloro- phyll and phaeopigment determination. Archiv für Hydro-
biologie-Beiheft Ergebnisse der Limnologie 14: 14-36.
Oh, K.H. and Y.C. Cho. 2015. Evaluation of contamination level of the sediments from Chusori and Chudong areas in Daechung Reservoir. Journal of Korean Society of Envi-
ronmental Engineers 37: 277-284.
(in Korean)Oh, K.H., Y.J. Kim and Y.C. Cho. 2015. Effects of sediments on the growth of algae at Chusori area in Daechung Res- ervoir. Journal of Korean Society on Water Environment
31: 533-542.
(in Korean)Oh, Y.T., J.C. Park, D.S. Kim and J.K. Rhyu. 2004. Pollutant characteristics of nonpoint source runoff in Okcheon Stream. Journal of Korean Society on Water Quality 20:
657-663.(in Korean)
Paerl, H.W. 2014. Mitigating harmful cyanobacterial blooms in a human- and climatically-impacted world. Life 4: 988- 1012.
Park, H., S. Chung and S. Yoon. 2015. Characterizing pollution loading and priority regions in So-Okcheon watershed.
Journal of Industrial Science and Technology Institute 29:
51-55.(in Korean)
Park, S.R., S.B. Oh and H.R. Byun. 2015. Definition and char- acteristics of the water abundant season in Korea. Theo-
retical and Applied Climatology 120: 249-258.
Prescott, G.W. 1982. Algae of the Western Great Lakes Area with an illustrated key to Genera desmids and freshwater diatoms. Otto Koeltz Science Publishers. 977p.
Reynolds, C.S. 1984. The Ecology of Freshwater Phytoplankton.
Cambridge University Press, Cambridge, UK. pp. 30-31.
Reynolds, C.S. 1987. Cyanobacterial water-blooms. Advances
in Botanical Research 13: 67-143.
Reynolds, C.S. and A.E. Walsby. 1975. Water-blooms. Biologi-
cal Reviews 50: 437-481.
Rump, H.H. and H. Krist. 1988. Laboratory manual for the
examination of water, wastewater, and soil. VCH Verlags- gesellschaft, Publisher, New York, USA. 190p.
Shim, M.J., J.Y. Yoon and S.H. Lee. 2015. Water quality proper- ties of tributaries of Daechung Lake, Korea. Korean Jour-
nal of Ecology and Environment 48: 12-25.
(in Korean) Shin, J.K. 1998. Eutrophication and Ecological Characteristicsof Algal Population in the Freshwater Zone of the Nak- tong River, Korea. Ph.D. Science Thesis, Inje University.
Busan, Korea. 202p.
Shin, J.K. and K.J. Cho. 2000. The impact on water quality from blue-green algae Microcystis of natural phytoplankton by algal assay. Journal of the Korean Environmental Science
Society 9: 267-273.
(in Korean)Shin, J.K. and K.J. Cho. 2001. The contents of nitrogen, phos- phorus, silicon nutrients and algal growth potential(AGP) in the sediment of Taechong Reservoir. Korean Journal of
Limnology 34: 106-118.
(in Korean)Shin, J.K., B.G. Kang and S.J. Hwang. 2016a. Limnological study on spring-bloom of a green algae, Eudorina elegans and weirwater pulsed-flows in the midstream(Seungchon weir pool) of the Yeongsan River, Korea. Korean Journal
of Ecology and Environment 49:
(submitted).(in Korean) Shin, J.K., B.G. Kang and S.J. Hwang. 2016b. Water-blooms(Green-tide) dynamics of algae alert system and rainfall- hydrological effects in Daecheong Reservoir, Korea. Ko-
rean Journal of Ecology and Environment 49: 153-175.
(in Korean)Shin, J.K., D.S. Kim, H.K. Lee, S.J. Maeng and S.J. Hwang.
2003a. An evaluation of aquatic environment in the Ok- chon Stream-embayment watershed, Korea. Korean Jour-
nal of Limnology 36: 181-190.
(in Korean)Shin, J.K., S. Lee and J.W. Choi. 2014. A practical new tech- nology on removing algal bloom: K-water GATe water combine. Korean Journal of Ecology and Environment
47: 214-218.
(in Korean)Shin, J.K., S.J. Hwang, C.K. Kang and H.S. Kim. 2003b. Hy- drological and environmental factors: Limnological char- acteristics of the Korea. Korean Journal of Limnology 36:
242-256.(in Korean)
Stevenson, R.J., M.L. Bothwell and R.L. Lowe. 1996. Algal Ecology: Freshwater benthic ecosystems. Academic Press, Inc. California, USA. 753p.
Thornton, K.W., B.L. Kimmel and F.E. Payne. 1990. Reservoir Limnology: Ecological Perspectives. A Wiley-Interscience Publication, John Wiley & Sons, Inc. New York, USA.
256p.
Watanabe, M.F., K.I. Harada and H. Fujiki. 1994. Waterbloom of Blue-green algae and Their Toxins. University of To- kyo Press. Tokyo, Japan. 257p.(in Japanese)
Watanabe, M.F., K.I. Harada, W.W. Carmichael and H. Fujiki.
1996. Toxic Microcystis. CRC Press, Inc. Florida, USA.
262p.
Wetzel, R.G. 2001. Limnology: Lake and River Ecosystems. 3rd Edition. Academic Press, California, USA. 1006p.