Received: June 19, 2018 Revised: September 11, 2018 Accepted: September 28, 2018 Trauma and InJury
Correspondence to Sang Ook Ha, M.D.
Department of Emergency Medicine, Hallym University Sacred Heart Hospital, Hallym University Medical Center, 22 Gwanpyeong-ro 170beon-gil, Donan-gu, Anyang 14068, Korea
Tel: +82-31-380-4158 Fax: +82-31-380-4131 E-mail: [email protected]
Central Venous Catheterization before Versus after Computed Tomography in Hemodynamically unstable Patients with major Blunt Trauma: Clinical Characteristics and factors for decision making
Ji Hun Kim, M.D., Sang Ook Ha, M.D., Young Sun Park, M.D., Jeong Hyeon Yi, M.D., Sun Beom Hur, M.D., Ki Ho Lee, M.D.
Department of Emergency Medicine, Hallym University Sacred Heart Hospital, Hallym University Medical Center, Anyang, Korea
Purpose: When hemodynamically unstable patients with blunt major trauma arrive at
the emergency department (ED), the safety of performing early whole-body computed tomography (WBCT) is concerning. Some clinicians perform central venous catheter- ization (CVC) before WBCT (pre-computed tomography [CT] group) for hemodynam- ic stabilization. However, as no study has reported the factors affecting this decision, we compared clinical characteristics and outcomes of the pre- and post-CT groups and determined factors affecting this decision.
methods: This retrospective study included 70 hemodynamically unstable patients
with chest or/and abdominal blunt injury who underwent WBCT and CVC between March 2013 and November 2017.
results: Univariate analysis revealed that the injury severity score, intubation, pulse
pressure, focused assessment with sonography in trauma positivity score, and pH were different between the pre-CT (34 patients, 48.6%) and post-CT (all, p<0.05) groups.
Multivariate analysis revealed that injury severity score (ISS) and intubation were factors affecting the decision to perform CVC before CT (p=0.003 and p=0.043). Re- garding clinical outcomes, the interval from ED arrival to CT (p=0.011) and definite bleeding control (p=0.038), and hospital and intensive care unit lengths of stay (p=0.018 and p=0.053) were longer in the pre-CT group than in the post-CT group. Although not significant, the pre-CT group had lower survival rates at 24 hours and 28 days than the post-CT group (p=0.168 and p=0.226).
Conclusions: Clinicians have a tendency to perform CVC before CT in patients with
blunt major trauma and high ISS and intubation.
Keywords: Blunt trauma; Computed tomography; Central venous catheterization; In-
jury severity score
INTRODUCTION
Whole body computed tomography (WBCT) is a stan- dard diagnostic tool and a critical component in the early in-hospital assessment of patients with major blunt trauma [1,2]. Several retrospective studies have reported that the performance of WBCT decreased the mortality in patients with major blunt trauma [3-6]. In addition, Furugori et al. [7] emphasized that shortening the interval between emergency department (ED) arrival and WBCT scanning by adjusting the distance to the computed to- mography (CT) room is critical in severe trauma patients, allowing the detection of life-threatening problems and early critical decision making. From this perspective, in the initial management of hemodynamically stable pa- tients with major blunt trauma, establishing a bilateral pe- ripheral vascular access is important in the administration of fluids; hence, WBCT can be performed early and safely.
However, when hemodynamically unstable patients with blunt major trauma arrive at the ED, the safety of per- forming WBCT remains an important concern. There- fore, some clinicians consider performing central venous catheterization (CVC) before WBCT for fluid adminis- tration, blood transfusion, and catecholamine adminis- tration. Because it is clear that performing CVC delays the performance of early WBCT scanning, performing CVC before or after WBCT scanning remains a major challenge in emergency care. However, clinician are only vaguely considering that sever patients have a CVC before WBCT scanning, there is no study reporting on the factors af- fecting this decision. In the present study, we compared the clinical characteristics and outcomes of patients who underwent CVC before CT (pre-CT groups) and those who underwent CVC after CT (post-CT groups) and de- termined the factors affecting the decision.
METHODS
Study design and population
The protocol for this retrospective observational study was approved by the Institutional Review Board of the Hallym University Sacred Heart Hospital, and the re- quirement for informed consent was waived because for-
mal consent is not required for retrospective studies. We reviewed the electronic medical records of the patients with major trauma who were admitted to the ED between March 2013 and November 2017. Patients with an injury severity score of >15, with chest or/and abdominal blunt injury with or without brain or other injuries, with sys- tolic blood pressure (SBP) of <90 mmHg or heart rate of
>120 beats/min within 30 minutes upon ED arrival, who underwent WBCT (brain, chest, abdomen, and spine), and who underwent CVC in the ED were included in the study. Patients aged <18 years, who had an arrest before ED arrival, and who were transferred from another hospi- tal were excluded. In particular, because the role of WBCT in patients with penetrating trauma is not yet established, only those with blunt trauma were included in the present study. Fig. 1 presents a flow chart of the patient selection process. All patients were initially managed in accordance with the 10th advanced trauma life support guidelines.
After performing early resuscitation, the clinician decided to perform a CT scan in patients whose vital signs were within the acceptable range (percutaneous oxygen satura- tion, 90%; heart rate, 120 beats/min; and SBP, 70 mmHg).
Data collection
Data on patients’ baseline characteristics (age and sex) and factors known to influence mortality were collected.
The initial vital signs (SBP, diastolic blood pressure, pulse
pressure, heart rate, and body temperature), initial labora-
tory findings (pH, base excess, lactate, and hemoglobin),
mechanism of injury, clinical scores (Glasgow coma scale
[GCS] score, revised trauma score [RTS], injury severity
score [ISS], and focused assessment with sonography in
trauma [FAST]), clinical practice (intubation, catechol-
amine administration, and type of central venous cathe-
ter), intervals (from ED arrival to CT, insertion of central
catheter, transfusion, and definite bleeding control [em-
bolization or operation]), and clinical outcomes (hospital
and intensive care unit [ICU] lengths of stay [LOS], and
survival rate at 24 hours and 28 days) were recorded. The
RTS assessment was based on three parameters: neurolog-
ical evaluation by the GCS, hemodynamic evaluation by
the SBP, and respiratory rate [8].
Statistical analysis
The normality of data distribution was evaluated using a Kolmogorov-Smirnov test to select the appropriate para- metric and nonparametric statistical methods. Continu- ous variables were reported as median with interquartile range (25-75 percentile) and categorical variables as numbers (%). Continuous variables were analyzed using a Mann-Whitney test, and categorical variables were an- alyzed using a Pearson’s chi-square test or Fisher’s exact test. The independent factors affecting the decision to per- form CVC before CT were evaluated using multivariate backward stepwise logistic regression after adjustment for confounding factors (defined as factors that were signif-
icant in the univariate analysis based on a type I error of 0.05). For all comparisons, the tests were two tailed, and group differences were regarded as significant at p<0.05.
SPSS version 18.0.0 statistical software for Windows (SPSS, Inc., Chicago, IL, USA) was used for all analyses.
RESULTS
Differences in the baseline and clinical characteristics of the pre-CT and post-CT groups
The pre-CT group comprised 34 patients (48.6%), while the post-CT group comprised 36 patients (51.4%). The
Fig. 1. Flow chart of patient selection. CT: computed tomography, ED: emer- gency department.
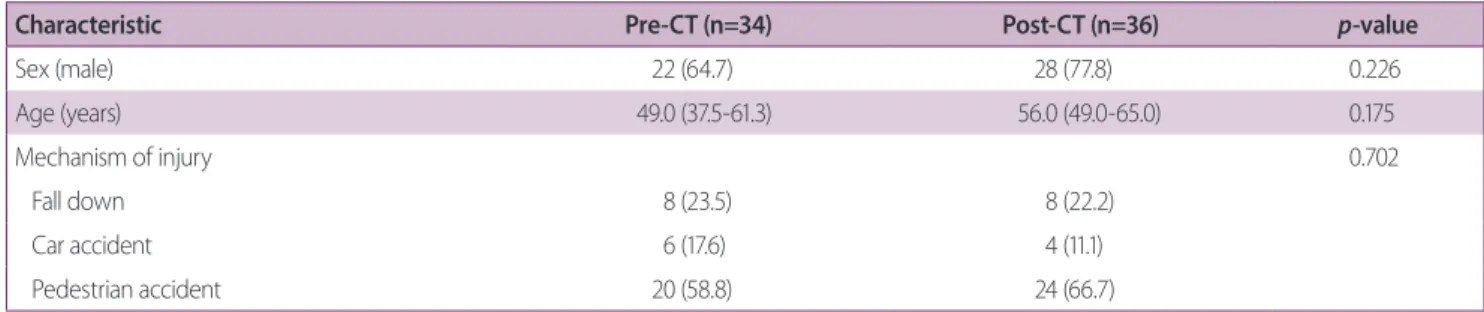
Table 1. Comparison of the baseline characteristics and mechanisms of injury between the pre-CT and post-CT groups
Characteristic Pre-CT (n=34) Post-CT (n=36) p-value
Sex (male) 22 (64.7) 28 (77.8) 0.226
Age (years) 49.0 (37.5-61.3) 56.0 (49.0-65.0) 0.175
Mechanism of injury 0.702
Fall down 8 (23.5) 8 (22.2)
Car accident 6 (17.6) 4 (11.1)
Pedestrian accident 20 (58.8) 24 (66.7)
Values are presented as number (%) or mean (range).
CT: computed tomography.
baseline characteristics and mechanisms of injury of all the patients are summarized in Table 1. No significant difference was observed between the two groups in terms of sex (22 vs. 28 men, p=0.226), age (49.0 vs. 56.0 years,
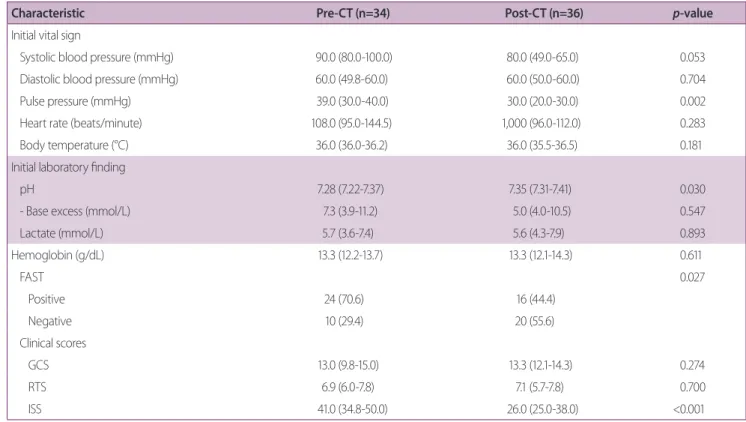
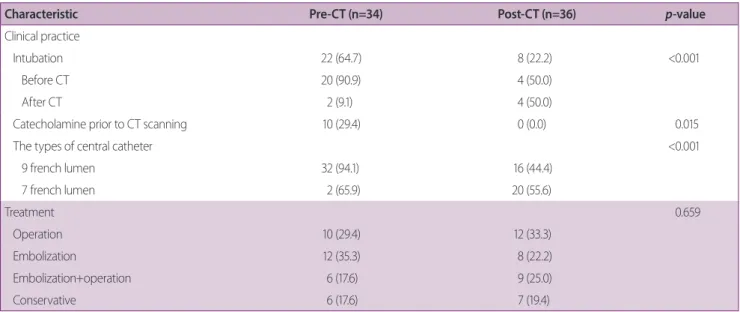
p=0.175), and mechanism of injury (p=0.702). Table2 presents the initial vital signs, laboratory parameters, FAST-positivity, and clinical scores of both groups. The pre-CT group had a higher pulse pressure (39.0 vs. 30.0 mmHg, p=0.002), lower pH (7.28 vs. 7.35, p=0.030), high- er FAST-positivity rates (70.6% vs. 44.4%, p=0.027), and higher ISS (41.0 vs. 26.0, p<0.001) than the post-CT group no significant difference was observed between the two groups (13.0 vs. 13.3, p=0.274 and 6.9 vs. 7.1, p=0.700) in terms of GCS and RTS. The pre-CT group had a higher rate of intubation (64.7% vs. 22.2%, p<0.001), and most patients were intubated before CT (90.9%, Table 3). With regard to the type of central catheter, larger-size (9 french lumen) catheters were more frequently used in the pre- CT group (94.1% vs. 44.4%, p<0.001) than in the post-CT
group. In contrast, the type of treatments did not differ significantly between the groups (p=0.659).
Differences in the clinical outcomes of the pre-CT and post-CT groups
Table 4 shows the time interval data and clinical out- comes of the pre-CT and post-CT groups. The pre-CT group had a longer time interval from ED arrival to CT (46.0 vs. 27.0 minutes, p=0.011) and to definite bleeding control (193.5 vs. 167.5 minutes, p=0.038) than the post- CT group. The time intervals from ED arrival to CVC and transfusion were significantly different between the two groups (26.0 vs. 97.0 minutes, p<0.001 and 79.5 vs. 108.0 minutes, p=0.018). Although not considered significant, the pre-CT group tended to have lower survival rates at 24 hours and 28 days than the post-CT group (76.5%
vs. 88.9%, p=0.168 and 64.7% vs. 77.8%, p=0.226). In terms of hospital and ICU LOS, significant difference was observed between the two groups (25.0 vs. 13.0 days,
Table 2. Comparison of initial vital signs, laboratory findings, and FAST and clinical scores of the pre-CT and post-CT groups
Characteristic Pre-CT (n=34) Post-CT (n=36) p-value
Initial vital sign
Systolic blood pressure (mmHg) 90.0 (80.0-100.0) 80.0 (49.0-65.0) 0.053
Diastolic blood pressure (mmHg) 60.0 (49.8-60.0) 60.0 (50.0-60.0) 0.704
Pulse pressure (mmHg) 39.0 (30.0-40.0) 30.0 (20.0-30.0) 0.002
Heart rate (beats/minute) 108.0 (95.0-144.5) 1,000 (96.0-112.0) 0.283
Body temperature (°C) 36.0 (36.0-36.2) 36.0 (35.5-36.5) 0.181
Initial laboratory finding
pH 7.28 (7.22-7.37) 7.35 (7.31-7.41) 0.030
- Base excess (mmol/L) 7.3 (3.9-11.2) 5.0 (4.0-10.5) 0.547
Lactate (mmol/L) 5.7 (3.6-7.4) 5.6 (4.3-7.9) 0.893
Hemoglobin (g/dL) 13.3 (12.2-13.7) 13.3 (12.1-14.3) 0.611
FAST 0.027
Positive 24 (70.6) 16 (44.4)
Negative 10 (29.4) 20 (55.6)
Clinical scores
GCS 13.0 (9.8-15.0) 13.3 (12.1-14.3) 0.274
RTS 6.9 (6.0-7.8) 7.1 (5.7-7.8) 0.700
ISS 41.0 (34.8-50.0) 26.0 (25.0-38.0) <0.001
Values are presented as number (%) or mean (range).
CT: computed tomography, FAST: focused assessment with sonography in trauma, GCS: Glasgow coma scale, RTS: revised trauma score, ISS: injury severi- ty score.
p=0.018 and 19.0 vs. 4.0 days, p=0.053).
Factors affecting the decision to perform CVC before CT Univariate logistic regression analysis revealed that the ISS, intubation, pulse pressure, FAST-positivity, and pH were significantly different between the pre-CT and post- CT groups (all p<0.05). Subsequent multivariate analysis showed that ISS and intubation were independently asso- ciated with CVC before CT (odds ratio [OR]: 0.912, 95%
confidence interval [CI]: 0.858-0.969, p=0.003 and OR 3.335, 95% CI: 1.039-10.703, p=0.043; Table 5).
DISCUSSION
In the present study, we compared the clinical characteris- tics and outcomes of the pre-CT and post-CT groups, and determined the factors affecting the decision. Clinicians
Table 3. Comparison of the clinical practice and treatment administered between the pre-CT and the post-CT groups
Characteristic Pre-CT (n=34) Post-CT (n=36) p-value
Clinical practice
Intubation 22 (64.7) 8 (22.2) <0.001
Before CT 20 (90.9) 4 (50.0)
After CT 2 (9.1) 4 (50.0)
Catecholamine prior to CT scanning 10 (29.4) 0 (0.0) 0.015
The types of central catheter <0.001
9 french lumen 32 (94.1) 16 (44.4)
7 french lumen 2 (65.9) 20 (55.6)
Treatment 0.659
Operation 10 (29.4) 12 (33.3)
Embolization 12 (35.3) 8 (22.2)
Embolization+operation 6 (17.6) 9 (25.0)
Conservative 6 (17.6) 7 (19.4)
Values are presented as number (%).
CT: computed tomography.
Table 4. Comparison of clinical outcomes between the pre-CT and post-CT groups
Characteristic Pre-CT (n=34) Post-CT (n=36) p-value
Time interval (minutes)
From ED arrival to CT scanning 46.0 (39.8-4.8) 27.0 (19.0-59.0) 0.011
From ED arrival to CVC 26.0 (21.0-52.3) 97.0 (66.0-124.0) <0.001
From ED arrival to transfusion 79.5 (65.8-105.3) 108.0 (72.5-153.8) 0.018
From ED arrival to bleeding control 193.5 (154.0-280.0) 167.5 (139.0-200.3) 0.038
Outcome
Hospital LOS (days) 25.0 (2.8-66.3) 13.0 (11.0-23.0) 0.018
ICU LOS (days) 19.0 (2.8-26.0) 4.0 (2.0-13.0) 0.053
Survival rate at 24 hours 26 (76.5) 32 (88.9) 0.168
Survival rate at 28 days 22 (64.7) 28 (77.8) 0.226
Values are presented as number (%) or mean (range).
CT: computed tomography, ED: emergency department, CVC: central venous catheterization, LOS: length of stay, ICU: intensive care unit.
have a tendency to perform CVC before CT scanning pa- tients who have a blunt major trauma with high ISS and intubation. The pre-CT group had a delayed time interval to CT scanning and definite bleeding control, longer hos- pital and ICU LOS, and a tendency to increase the mor- tality rate compared with the post-CT group.
Comparison between pre-CT group and post-CT group for clinical outcomes
Although there is controversy regarding the survival benefit, the time interval from ED arrival to CT scanning is considered an important factor in trauma patients.
Furugori et al. [7] emphasized that shortening the time to CT by adjusting the distance to the CT room could be critical in severe trauma patients, allowing the detection of life-threatening problems and earlier critical decision making. They showed that the presence of a CT machine in the trauma room reduced the time to CT by 14 min- utes (from 37 minutes to 23 minutes) and 18 minutes (from 40 minutes to 22 minutes) after propensity score matching. The present study also showed the same re- sults. Although there was no significant difference in the survival rates at 24 hours and 28 days between the pre-CT group and the post-CT group (76.5% vs. 88.9%, p=0.168 and 64.7% vs. 77.8%, p=0.226), the timing of performing CVC before and after CT scanning affected the time in- tervals. CVC performed after CT shortened the time from ED arrival to CT completion by 19 minutes and to bleed- ing control by 26 minutes compared to CVC performed before CT. In terms of hospital and ICU LOS, the post- CT group were shortened by 12 days and 15 days, respec- tively, compared with those of the pre-CT group. Results suggested that a shorter LOS was due to the high ISS in
the pre-CT group.
Factors affecting the decision to perform CVC before CT Since no studies have reported on factors affecting the de- cision to perform CVC before CT, we inevitably evaluated the factors known to be associated with mortality (SBP, pulse pressure, pH, base excess, FAST-positivity, ISS, and intubation). In a randomized controlled trial study on blunt trauma patients with hemorrhagic shock, Dutton et al. [9] administered fluids with an SBP target of 70-80 mmHg until surgical control was achieved and showed that despite the presence of a low BP in actively bleeding patients, the mortality rate was unaffected. In addition, Wigginton et al. [10] proposed that controlled hypoten- sion can benefit patients with blunt trauma who are ac- tively bleeding until surgical control. Our center also ap- plied the permissive hypotension strategy, and clinicians were aware of this concept. We suggested that as a result, SBP did not act as a determinant of CVC. Rather, the SBP of the pre-CT group was higher than that of the post-CT group. In clinical practice, FAST-positivity in the initial assessment implies the potential risk of a sudden drop in the blood pressure and may compel the clinician to perform CVC. Interestingly, we found that the pulse pres- sure, known as a risk factor for mortality in patients with sepsis, trauma, and shock [11-13], was also higher in the pre-CT group. The clinical practice to use pH as an im- portant parameter in treating patients with major trauma was also reflected in the present result. We also evaluated the standard anatomic scores (ISS) and physiologic score (RTS) of the pre-CT and post-CT groups. In general, the RTS can be available early in treatment, but an important limitation of the ISS is the difficulty associated with its
Table 5. Univariate and multivariate analyses of factors associated with central line access before CT scanningVariable Univariate analysis Multivariate analysis
OR 95% CI p-value OR 95% CI p-value
ISS 0.897 0.848-0.949 <0.001 0.912 0.858-0.969 0.003
Intubation 6.417 2.235-18.421 0.001 3.335 1.039-10.703 0.043
Pulse pressure 0.904 0.846-0.966 0.003
FAST-positivity 3.000 1.117-8.058 0.029
pHx10 1.597 1.019-2.504 0.041
CT: computed tomography, OR: odds ratio, CI: confidence interval, ISS: injury severity score, FAST: focused assessment with sonography in trauma.
early application. Our results demonstrated that while the RTS did not show a statistical difference between the two groups, the ISS was a factor affecting the decision to perform CVC before CT as revealed in the multivariate analysis. A study of whether clinicians actually use the an- atomic assessment rather than the physiologic assessment in making an early decision may be an interesting subject topic.
Intubation was also among the factors that affected the clinician’s decision. Several pathophysiological studies showed that intubation with positive pressure ventilation reduces venous return and that the medications used for intubation and the maintenance of sedation decrease vascular tone and myocardial depression [14,15]. Green et al. [16] reported that trauma patients requiring intu- bation develop post-intubation hypotension at a rate of 36.3%, which increases their mortality (29.8% vs. 15.9%,
p=0.001). In addition, they observed that post-intubationhypotension development in trauma patients was associ- ated with a prolonged requirement for treatment with va- sopressors. The present study suggested that the intubated patients more frequently experienced post-intubation hy- potension before CT scanning. This physiologic situation forces clinicians to perform CVC before CT scanning.
This study has several limitations. First, the study’s small sample size and single-center design were associated with known risks of bias. Second, the retrospective design may be associated with a selection bias, as we only includ- ed hemodynamically unstable patients who underwent WBCT and CVC in the ED. This severity reflected a high- er mortality than that observed in previous studies.
CONCLUSION
Clinicians have a tendency to perform CVC before CT scanning in patients who have a blunt major trauma with high ISS and intubation.
REFERENCES
1. Sierink JC, Treskes K, Edwards MJ, Beuker BJ, den Hartog D, Hohmann J, et al. Immediate total-body CT scanning versus
conventional imaging and selective CT scanning in patients with severe trauma (REACT-2): a randomised controlled trial.
Lancet 2016;388:673-83.
2. Huber-Wagner S, Lefering R, Qvick LM, Körner M, Kay MV, Pfeifer KJ, et al. Effect of whole-body CT during trauma resus- citation on survival: a retrospective, multicentre study. Lancet 2009;373:1455-61.
3. Hutter M, Woltmann A, Hierholzer C, Gartner C, Buhren V, Stengel D. Association between a single-pass whole-body com- puted tomography policy and survival after blunt major trau- ma: a retrospective cohort study. Scand J Trauma Resusc Emerg Med 2011;19:73.
4. Kimura A, Tanaka N. Whole-body computed tomography is as- sociated with decreased mortality in blunt trauma patients with moderate-to-severe consciousness disturbance: a multicenter, retrospective study. J Trauma Acute Care Surg 2013;75:202-6.
5. Weninger P, Mauritz W, Fridrich P, Spitaler R, Figl M, Kern B, et al. Emergency room management of patients with blunt major trauma: evaluation of the multislice computed tomography protocol exemplified by an urban trauma center. J Trauma 2007;62:584-91.
6. Yeguiayan JM, Yap A, Freysz M, Garrigue D, Jacquot C, Martin C, et al. Impact of whole-body computed tomography on mortal- ity and surgical management of severe blunt trauma. Crit Care 2012;16:R101.
7. Furugori S, Kato M, Abe T, Iwashita M, Morimura N. Treating patients in a trauma room equipped with computed tomogra- phy and patients’ mortality: a non-controlled comparison study.
World J Emerg Surg 2018;13:16.
8. Champion HR, Sacco WJ, Copes WS, Gann DS, Gennarelli TA, Flanagan ME. A revision of the trauma score. J Trauma 1989;29:623-9.
9. Dutton RP, Mackenzie CF, Scalea TM. Hypotensive resuscitation during active hemorrhage: impact on in-hospital mortality. J Trauma 2002;52:1141-6.
10. Wigginton JG, Roppolo LP, Pepe PE. Advances in resuscitative trauma care. Minerva Anestesiol 2011;77:993-1002.
11. Klassen PS, Lowrie EG, Reddan DN, DeLong ER, Coladonato JA, Szczech LA, et al. Association between pulse pressure and mortality in patients undergoing maintenance hemodialysis.
JAMA 2002;287:1548-55.
12. Li S, Wan X, Zhang Y, Dai X, Li Q, Han L, et al. A correlation of pulse pressure and prognosis of refractory septic shock patients.
Zhonghua Nei Ke Za Zhi 2014;53:121-6.
13. Pottecher J, Ageron FX, Fauché C, Chemla D, Noll E, Duranteau J, et al. Prehospital shock index and pulse pressure/heart rate ratio to predict massive transfusion after severe trauma: retro- spective analysis of a large regional trauma database. J Trauma Acute Care Surg 2016;81:713-22.
14. Green RS, Turgeon AF, McIntyre LA, Fox-Robichaud AE, Fer- gusson DA, Doucette S, et al. Postintubation hypotension in intensive care unit patients: a multicenter cohort study. J Crit
Care 2015;30:1055-60.
15. Manthous CA. Avoiding circulatory complications during en- dotracheal intubation and initiation of positive pressure venti- lation. J Emerg Med 2010;38:622-31.
16. Green RS, Butler MB, Erdogan M. Increased mortality in trau- ma patients who develop postintubation hypotension. J Trauma Acute Care Surg 2017;83:569-74.