한국정보통신학회논문지 Vol. 22, No. 7: 978~984, Jul. 2018
동일 데이터를 이용한 구조방정식 툴 간의 비교분석
남수태1·김도관2·진찬용1*
A Comparison Analysis among Structural Equation Modeling (AMOS, LISREL and PLS) Using the Same Data
Soo-tai Nam 1 · Do-goan Kim 2 · Chan-yong Jin 1*
1*
Div. of Information and EC (Institute of Convergence and Creativity), Wonkwang University, Iksan, 54538, Korea
2
College of Liberal Arts (Institute of Convergence and Creativity), Wonkwang University, Iksan 54538, Korea
요 약
구조방정식 모델링은 경로분석 및 확인적 요인분석을 동시에 수행해 주는 통계적 절차를 따르고 있다. 오늘날이 통계적 절차는 사회과학 분야의 연구자에게 필수적인 도구이다. 구조방정식 모델링 분석을 해주는 대표적인 도구로 는 AMOS, LISREL 그리고 PLS가 있다. AMOS는 초보자가 사용할 수 있도록 편리한 그래픽 사용자 인터페이스를 제공해 주고 있다. PLS는 그래픽 사용자 인터페이스뿐만 아니라 정규분포에 대한 제약조건도 없다는 장점을 가지고 있다. 또한 사회과학 분야에서 가장 많이 사용하는 3가지 도구 (applications)를 비교분석 하였다. 구조방정식 모델링 기반 확인적 요인 분석은 IBM AMOS Ver 23, LISREL 8.70 및 SmartPLS 2.0을 사용하였다. 구조방정식 모델링 비교 분석 결과는 LISREL이 다른 분석 도구보다 종속 변수의 설명력이 가장 높음을 확인할 수 있었다. 분석 결과에 의해 제시된 경로계수 값 및 T 값은 3가지 분석 도구 모두 유사한 결과를 보이는 것으로 나타났다. 따라서 이러한 결과를 바탕으로 이론적 실무적 시사점을 제시하였다.
ABSTRACT
Structural equation modeling is pointing to statistical procedures that simultaneously perform path analysis and confirmatory factor analysis. Today, this statistical procedure is an essential tool for researchers in the social sciences.
There are as AMOS, LISREL and PLS representative tools that can perform structural equation modeling analysis. AMOS provides a convenient graphical user interface for beginners to use. PLS has the advantage of not having a constraint on normal distribution as well as a graphical user interface. Therefore, we compared and analyzed the three most commonly used tools (applications) in social sciences. Based on structural equation modeling, confirmatory factor analysis was performed using the IBM AMOS Ver. 23, the LISREL 8.70 and the SmartPLS 2.0. The comparative results show that LISREL has the highest explanatory power of dependent variables than other analytical tools. The path coefficients and T-values presented by the analysis results showed similar results for all three analysis tools. This study suggests practical and theoretical implications based on the results.
키워드
: 에이모스, 리즈렐, 부분 최소 자승법, 경로 분석, 구조방정식 모델링
Keywords
: Analysis of moment structures, Linear structural relations, Partial least squares, Path analysis, Structural equation modeling
Received 19 May 2018, Revised 21 May 2018, Accepted 29 May 2018
* Corresponding Author Chan-yong Jin (E-mail:[email protected], Tel:+82-63-850-6567)
Division of Information and Electronic Commerce (Institute of Convergence and Creativity), Wonkwang University, Iksan, 54538, Korea
Open Access http://doi.org/10.6109/jkiice.2018.22.7.978
pISSN:2234-4772Ⅰ. INTRODUCTION
In social science research, there are many researches applying SEM (structural equation modeling) for empirical analysis. The paper applying structural equation modeling is an effective method for analyzing the causal relationship between latent variables and identifying the causal relationships between latent variables and the results [1]. Today tools for analyzing structural equation modeling include PLS (partial least squares), AMOS (analysis of moment structures), and LISREL (linear structural relations). Recently, research using PLS based on the partial least squares method is increasing.
By the way, the PLS analysis method is relatively uncompromising in terms of sample size and residual distribution compared to AMOS and LISREL, and the evaluation of the theoretical structural model and the evaluation of the measurement model at the same time [2]. In addition, despite the many advantages of structural equation modeling, researchers have difficulty in analyzing research hypotheses and model tests in analytical procedures [3]. Many scholars have suggested various statistical criteria and guidelines that should be accepted for analysis procedures and results in research applying structural equation modeling. Thus, many other researchers have questioned the reliability and validity of the research results [1].
Ⅱ. RESEARCH METHODOLOGY
Using AMOS, it can easily use structural equation modeling to test hypotheses of complex variable relationships and gain new insights from the data. And, LISREL is a proprietary statistical software package used in structural equation modeling for manifest and latent variables. Also, PLS is a statistical method that bears some relation to principal components regression, instead of finding hyper planes of maximum variance between the response and independent variables, it finds
a linear regression model by projecting the predicted variables and the observable variables to a new space.
One of the programs that analyze the structural equation model, AMOS utilizes a different approach from SPSS statistic. SPSS statistic uses exploratory factor analysis and AMOS utilizes confirmatory factor analysis. Confirmatory factor analysis explains the latent variables describing the measured variables, and the parts not be explained is explained by measurement error. And exploratory factor analysis is a traditional factor analysis as a method to find out appropriate potential factors when there is no existing hypothesis or theory about potential factors [4].
On the other hand, in the confirmatory factor analysis, the analysis is performed in a state in which the number of factors (latent variables) and measurement variables constituting factors are already specified. This exploratory factor analysis is a factor analysis conducted by SPSS or SAS program. Therefore, confirmatory factor analysis is similar to the theoretical verification process [5] because it emphasizes the rationale of previous studies or theoretical background. Because of these characteristics, convergent validity, discriminant validity, and reliability analysis are performed after confirmatory factor analysis is completed. In addition, model fit is also identified [4].
Structural equation modeling techniques such as
LISREL and PLS are second generation statistical tools
for high quality statistical analysis of multivariate study
models [6]. Structural equation modeling techniques can
be classified into two types. LISREL is a common
equation analysis based structural equation model and
PLS is a structural equation model based on a principle
component which is a total variance. PLS has several
other features compared to LISREL. The PLS can be
analyzed even if the number of samples is small, and
there is no constraint on the normal distribution of the
sample distribution [7]. In addition, PLS can also build
models for formation indicators. And PLS adopts a
method to minimize errors of internal variables.
Ⅲ. RESULTS AND CONCLUSIONS
The raw data used in this study is an extended technology acceptance model with variables added in the TAM (technology acceptance model). This basic data consider effects of smartphone based multimedia services on continue using intention named a criterion variable. Thus, this raw data collected 150 samples from the questionnaires of residents of Busan Gyeongnam and Jeonbuk area. The model based on this methodology is shown in Figure 1. Potential variables consist of four items each are perceived usefulness, perceived ease of use, and perceived enjoyment. And, moderator variables are constructed with perceived usefulness, perceived enjoyment, and perceived value. In addition, the dependent variable is the variable of continuous use intention. Therefore, it is composed of 5 factors and 20 measurement items.
Fig. 1 Research model
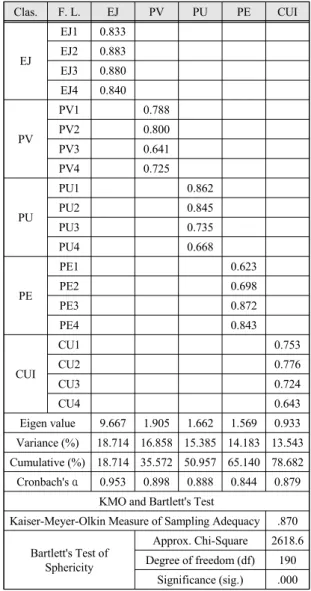
On the other side, the purpose of this study is not to test the hypotheses of the research model, but to make comparative analysis using different statistical methodologies with the same basic data. Therefore, no hypothesis was set. In this study EFA (exploratory factor analysis) and reliability analysis by the varimax method are used to verify the validity of the measurement tools using the basic data based SPSS (statistical package for social science) respectively. The results of exploratory factor analysis and reliability analysis are listed Table 1.
Table. 1 Results of exploratory factor analysis
Clas. F. L. EJ PV PU PE CUI
EJ
EJ1 0.833
EJ2 0.883
EJ3 0.880
EJ4 0.840
PV
PV1 0.788
PV2 0.800
PV3 0.641
PV4 0.725
PU
PU1 0.862
PU2 0.845
PU3 0.735
PU4 0.668
PE
PE1 0.623
PE2 0.698
PE3 0.872
PE4 0.843
CUI
CU1 0.753
CU2 0.776
CU3 0.724
CU4 0.643
Eigen value 9.667 1.905 1.662 1.569 0.933 Variance (%) 18.714 16.858 15.385 14.183 13.543 Cumulative (%) 18.714 35.572 50.957 65.140 78.682 Cronbach's α 0.953 0.898 0.888 0.844 0.879
KMO and Bartlett's Test
Kaiser-Meyer-Olkin Measure of Sampling Adequacy .870
Bartlett's Test of Sphericity
Approx. Chi-Square 2618.6 Degree of freedom (df) 190
Significance (sig.) .000
First, the KMO index ( .870), measures the number of measured variables and the number of data, is higher than the general standard of ( .8), the Bartlett's test of sphericity results showed that there is a correlation between any of the measured variables with p = .000, so this data is suitable for factor analysis. Principal component analysis of factor analysis generally extracts factors with factor loading value of ( .5) or more and eigen value of (1.0) or more. Therefore, we can see that most of the construction concept is not deviated.
Cronbach's α coefficient was used to test the reliability
of the respondent's internal consistency. The reliability test, based on the Cronbach's α coefficients of ( .6) or higher, which is generally used in the social sciences.
The Cronbach's α coefficients of the five conceptual variables constructed through the research model are all ( .8) or more, showing very high reliability, proving that there is no problem in the (CFA) confirmatory factor analysis procedure. The results of confirmatory factor analysis, convergent validity, and discriminant validity analysis using AMOS tools is shown in Table 2. As the result of the confirmatory factor analysis, the path coefficients of the measurement variables constituting the latent variables exceeds ( .7) than a general standard.
Table. 2 Confirmatory factor analysis using AMOS
SRS: Standard lambda squared
The AVE (average variance extracted) which tests the convergent validity was higher than the general standard ( .5). Because CR (construct reliability) is also larger than the general criterion of ( .7), convergent validity was achieved. Indicators for evaluating model goodness of fit are RMR (root mean square residual, RMSEA (root mean square error of approximation), AGFI (adjusted goodness of fit index), CFI (comparative fit index), NFI (normed fit index), IFI (incremental fit index) and NFI (normed fit index), respectively. The model fit of the total measurement model can evaluated good if RMR, RMSEA ≤ ( .10), AGFI ≥ ( .80), and GFI, CFI, IFI, NFI ≥ ( .90), respectively. In this study, the fitness index was analyzed as RMR ( .161), RMSEA ( .123), GFI ( .731), AGFI ( .653), NFI ( .805), CFI ( .855), and IFI ( .856), respectively. Although the model fit is partially unsatisfactory, but the overall fit is interpreted as conforming to the acceptance criteria.
Table. 3 Confirmatory factor analysis using LISREL
Cla. CUI PV PU PE EJ
CUI 1.000
PV 0.790 1.000
PU 0.420 0.530 1.000
PE 0.480 0.610 0.540 1.000
EJ 0.490 0.620 0.480 0.480 1.000 Goodness of Fit Measured Value Cutoff
RMR 0.090 ≤.10
RMSEA 0.120 ≤.10
GFI 0.730 ≥.90
AGFI 0.660 ≥.80
NFI 0.920 ≥.90
CFI 0.940 ≥.90
IFI 0.940 ≥.90
CN 59.50 ≥.200
Clas. Var. Estimate SRS E. Var. CR AVE
PU
PU4 0.671 0.450 0.550
0.889 0.671 PU3 0.748 0.560 0.440
PU2 0.939 0.882 0.118 PU1 0.890 0.792 0.208
Sum 3.248 2.684 1.316
PE
PE4 0.845 0.714 0.286
0.858 0.602 PE3 0.734 0.539 0.461
PE2 0.799 0.638 0.362 PE1 0.720 0.518 0.482
Sum 3.098 2.410 1.590
EJ
EJ4 0.870 0.757 0.243
0.951 0.830 EJ3 0.924 0.854 0.146
EJ2 0.941 0.885 0.115 EJ1 0.907 0.823 0.177
Sum 3.642 3.319 0.681
PV
PV4 0.835 0.697 0.303
0.900 0.693 PV3 0.786 0.618 0.382
PV2 0.897 0.805 0.195 PV1 0.808 0.653 0.347
Sum 3.326 2.772 1.228
CUI
CU4 0.818 0.669 0.331
0.878 0.643 CU3 0.856 0.733 0.267
CU2 0.742 0.551 0.449 CU1 0.786 0.618 0.382
Sum 3.202 2.570 1.430
Goodness of Fit Measured Value Cutoff
RMR 0.161 ≤.10
RMSEA 0.123 ≤.10
GFI 0.731 ≥.90
AGFI 0.653 ≥.80
NFI 0.805 ≥.90
CFI 0.855 ≥.90
IFI 0.856 ≥.90
Next, Based on the same data, the analysis results obtained by using the LISREL tools are shown in Table 3 below. The table shows the correlation between the variables used in the analysis through the structural equation model. In general, when the coefficient of correlation is more than ( .80), it can be considered that there is a multi-collinearity problem. In this study, there is no correlation exceeding ( .80) in the correlation between the variables. Therefore, it seems that there is no problem in multi-collinearity.
In order to verify the fit of the structural equation model in this study, we used GFI, AGFI, RMSEA, RMR, NFI, CFI, IFI, and CN, respectively. In this study, the fitness index was analyzed as RMR ( .090), RMSEA ( .120), GFI ( .730), AGFI ( .660), NFI ( .920), CFI ( .940), and IFI ( .940), respectively. As a result of the analysis, except for adjusted goodness of fit index and comparative fit index, all of the indicators were proved to be in conformity with the acceptance criteria. Based on the results of this analysis the study model has proven to be suitable.
Structural equation modeling techniques can be classified into two types. One is a common factor analysis based structural equation model such as LISREL and the other is a structural equation model based on total distributed principal components such as PLS [8].
Table. 4 Confirmatory factor analysis using PLS
Next, Next, Based on the same data, the analysis results obtained by using the PLS tools are shown in Table 4 below. First, in general the correlation between each measurement variable and the factor is evaluated, If the cross loadings value is more than ( .5), it is estimated convergent validity. Therefore, the cross loadings value of all constructive concepts is over ( .7), so it can be evaluated as having convergent validity.
The discriminant validity analysis should have a low correlation between the measurements obtained when two different concepts are measured. If the square root of the average variance extracted value is larger than the correlation coefficient between the concepts, the evaluated as having a discriminant validity [9]. The reliability evaluation is evaluated to be reliable when the Cronbach's α value and the CR value of the measured variables are generally ( .7) or more and the AVE value is ( .5) or more. The results of the analysis showed that the Cronbach's α value and the composite reliability value of all concepts were ( .8) or more and the average variance extracted value was ( .6) or more. Therefore, all items of the measurement variable can be evaluated as being reliable. The R² value of latent variables can be used to evaluate the fitness. If the R² value is .26 or
"higher", it is classified as above, if it is less than .13- .26, it is classified as "middle" if it is less than .02 - .13, it is classified as "lower". As a result, the perceived usefulness, perceived ease of use, perceived value, and continued use intention were .336, .210, .467, and .491, respectively. As a result, the analysis showed
Clas. Var. O. L. 1 2 3 4 5
CUI (1)
CU1 0.856
0.859
CU2 0.830 CU3 0.892 CU4 0.856
EJ (2)
EJ1 0.930
0.568
0.936
EJ2 0.949 EJ3 0.949 EJ4 0.917
PE (3)
PE1 0.825
0.473 0.458
0.834
PE2 0.873PE3 0.766 PE4 0.866
Clas. Var. O. L. 1 2 3 4 5
PU (4)
PU1 0.851
0.543 0.463 0.522
0.869
PU2 0.892PU3 0.893 PU4 0.838
PV (5)
PV1 0.848
0.701 0.571 0.540 0.543
0.877
PV2 0.923PV3 0.851 PV4 0.885
CR 0.918 0.966 0.901 0.925 0.930 AVE 0.738 0.877 0.695 0.755 0.769 Cronbach's α 0.881 0.953 0.855 0.892 0.900
higher fitness. Here is a summary of confirmatory factor analysis based on structural equation modeling between analysis tools.
Finally, statistical significance can be verified through the t-value provided through path analysis of the structural model. The results of path analysis using AMOS, LISREL and PLS, which is an analysis tool of structural equation modeling, are shown in Table 5 below. As mentioned earlier, in this study hypothesis testing is omitted because it is meaningless. Among the studies in social sciences, it is of utmost concern to identify the effect of independent variables on dependent variables. The results of comparative analysis of three structural equations modeling analysis tools are as follows.
First, the analysis application LISREL and PLS provides the path coefficient, T-value, and R², but AMOS does not present the R² value. The value of R² means the explanatory power of the construct. Therefore, AMOS has the disadvantage that it must be described as T-value instead of R² value. If you are not satisfied, you have to choose another alternative. As a result of using all three analytical tools, we can say that both advantages and disadvantages exist.
Second, looking at the analysis results in detail, it can be confirmed that the indicator has not much difference in size. The comparative results show that LISREL has the highest explanatory power of dependent variables than other analytical tools. The path coefficients and T-values presented by the analysis results showed
similar results for all three analysis tools.
Lastly, the purpose of this study was to compare analyze three representative analytical applications using structured equation modeling using the same data.
Therefore, we have not found any special superiority among the three analysis tools.
REFERENCES
[ 1 ] I. J. Kim, G. Y. Min and H. S. Shim, “The Structural Equation Modeling in MIS: The Perspectives of Lisrel and PLS Applications,” Journal of Information Technology
Services, vol. 10, no. 2, pp. 203-221, Jun. 2011.
[ 2 ] H. Baumgartner, and C. Homburg, “Applications of Structural Equation Modeling in Marketing and Consumer Research: A Review,” International Journal cf Research in
Marketing, vol. 13, no. 2, pp. 139-161, Apr. 1996.
[ 3 ] W. W. Chin, The Partial Least Squares Approach to
Structured Equation Modeling. G. Marcoidids (Ed), New
Jersey, NJ: Erlbaum Associates, 2015.[ 4 ] C. H. Choi and Y. Y. You, “The Study on Comparative Analysis of the Same Data through Regression Analysis Model and Structural Equation Model,” Journal of Digital
Convergence, vol. 14, no. 6, pp. 67-175, Jun. 2016.
[ 5 ] C. D. Stapleton, Basic Concepts and Procedures of
Confirmatory Factor Analysis, Paper Presented at the
Annual Meeting of the Southwest Educational Research Association, Austin, :TX, 1997.[ 6 ] R. P. Bagozzi, and C. Fornell, Theoretical Concepts,
Measurements, and Meaning, In C. Fornell (Ed.), A Second
Generation of Multivariate Analysis: Measurement and Evaluation, New York, NY: Praeger, 1982.Clas. AMOS LISREL PLS
Paths Path Coef. T-value Path Coef. T-value R2 Path Coef. T-value R2
EJ→PE 0.478 5.320 0.480 5.150 0.230 0.458 4.365 0.210
EJ→PU 0.342 3.504 0.280 3.240
0.360 0.283 2.198
0.336
PE→PU 0.276 3.030 0.410 4.230 0.393 3.777
EJ→PV 0.343 3.565 0.370 4.440
0.530
0.337 2.779
0.467
PU→PV 0.197 1.972 0.170 1.960 0.256 1.988
PE→PV 0.354 3.865 0.340 3.600 0.252 2.577
PV→CUI 0.879 8.876 0.790 8.510 0.630 0.701 11.801 0.491
Table. 5 Path comparison analysis among AMOS, LISREL, and PLS
[ 7 ] W. W. Chin, The Partial Least Squares Approach to
Structural Equation Modeling, In G. A. Marcoulides (Ed.),
New Jersey, NJ: Lawrence Erlbaum, 2015.[ 8 ] S. T. Nam and C. Y. Jin, “Factors Influencing on Continuous Usage Intention of Smartphone Based on the TAM (Technology Acceptance Model),” Journal of the Korea
Institute of Information and Communication Engineering,
vol. 21, no. 11, pp. 2076-2082, Nov. 2017.[ 9 ] V. Sujatha, “Auditing of Storage Security on Encryption TORAGE SECURITY ON ENCRYPTION,” Asia-pacific
Journal of Convergent Research Interchange, vol. 3, no. 2,
pp. 1-9, Jun. 2017.남수태(Soo-Tai Nam)
First Author
Lecturer : Wonkwang University
※Fields of Interest : MIS, E-Business, Technology Management, Big-Data, Internet of Things
김도관(Do-Goan Kim)
Co-Author
Professor : Wonkwang University
※Fields of Interest : MIS, E-Biz, Big-Data Analysis
진찬용(Chan-Yong Jin)
Corresponding Author Professor : Wonkwang University
※Fields of Interest : MIS, E-Business, Venture Start-Up, Big-Data