J. Korean Soc. Fish. Technol. 51 (4), 475―483, 2015 http://dx.doi.org/10.3796/KSFT.2015.51.4.475
<Original Article>
Growth and changes in the biochemical composition of Isochrysis galbana under different light–emitting diode conditions
Jae–Hyun BAE1*, Heui–Chun AN2, Heum–Gi PARK3, Jin–Chul PARK4, Jong–Myung PARK1, Kyoung–Hoon LEE5 and Sung–Eic HONG6
1Fisheries Resources and Environment Research Division, East Sea Fisheries Research Institute, Gangneung 210–861, Korea
2Fisheries Engineering Research Division, National Institute of Fisheries Science, Pusan 619–705, Korea
3Department of Marine Bioscience, Gangneung–Wonju National University, Gangneung 210–702, Korea
4East Coastal Life Science Institute Gangneung–Wonju National University, Gangneung 210–702, Korea
5School of Marine Production Management, Chonnam National University, Yeosu 550–749, Korea
6Bada Ecology Research, Gangneung 210–851, Korea
The marine microalgae Isochrysis galbana was cultured under various light–emitting diode (LED) light conditions with different wavelengths to examine changes in growth and in amino acid and fatty acid profiles. The culture conditions for the microalgae were Conway medium, salinity of 33 psu, temperature of 24°C, and a 16/8 h light/dark photoperiod. Six light sources, including 5 units of 180W LED lamps (peak wavelength: blue [LB] 470 nm; green [LG] 525 nm; yellow [LY] 595 nm; red [LR] 636 nm; white [LW] 442 nm) and 1 unit of a 175W metal halide (MH) lamp, were used for the experiment.
The dry cell weights (gL–1) of I. galbana under different light conditions were in the order of LW>LB≥MH>LR>LG>LY.
Levels of essential amino acids were revealed to be significantly higher under LW, LG, and MH than under the other wavelengths (P<0.05). The fatty acid, unsaturated fatty acid, and DHA contents of I. galbana were higher under MH, LW, and LG. In addition, the carotenoid content was higher under MH, LW, and LG than under the other wavelengths (P<0.05).
The fucoxanthin content was highest under MH (0.28%) and lowest under LY (0.2%), and it was 0.26% under LW and LG.
The results indicate that the combined use of LW and LG is effective when using LED lamps for I. galbana cultivation.
Key words: Isochrysis galbana, LED lamp, fatty acid, carotenoid, fucoxanthin
*Corresponding author: [email protected], Tel: 82–33–660–8555, Fax: 82–33–661–8514
Introduction
Investigations into the industrial use of microalgae were initiated in Germany in the 1940s, in order to produce veg- etable fat and oil through mass cultures of Bacillariophyceae. Biotechnology based on microalgae is a rapidly growing field (Cook 1951; Gummert et al. 1953).
Various microalgal components have been used as natural pigments, drug materials, biochemical substances, feed ma-
terials, alternative energy sources, and health supplements (Oh et al. 2003). The efficient use of microalgae requires nutritional evaluation; thus, previous studies have reported on the use of microalgal proteins as health foods or animal feed (Fuentes et al. 2000); microalgal carbohydrates as emulsifiers and stabilizers in food (Brown and Jeffrey 1992); and microalgal fatty acids in relation to arachidonic acid (AA), eicosapentaenoic acid (EPA), and docosahex-
aenoic acid (DHA) in medicines (Belarbi et al. 2000;
Carvalho and Malcata 2000; Shamsudin 1992). Moreover, chlorophylls and carotenoids derived from microalgae have been widely used as ancillary pigments in food, for the pro- tection of materials against oxidation, and as antioxidants in cosmetics; they have also been approved by the US Food and Drug Administration as anti–cancer medicines and for skin disease treatments (Oh et al. 2003).
When microalgae are used as live food for larval breed- ing, they must be nutritionally balanced, and the content of highly unsaturated fatty acids (HUFA) compared to oth- er fatty acids must be particularly high (Langdon and Walcock 1981; Chu and Webb 1984). In addition, the mass culture must be easy to perform, in order to supply the tar- get organism as feed (Lid and Abalde 1992). Thus, because Isochrysis galbana has a high HUFA content, it has been widely used as feed for farmed fish and shellfish (Volkman et al. 1989) and as a health supplement in the food industry due to its high nutritional value (Sun and Wang 2009).
The wavelength of light is an important factor in micro- algal photosynthesis (Sanchez–Saavedra and Voltolina 1994). The optical specificity of monochromatic light sour- ces has been evaluated for productivity enhancement in the mass culture of microalgae supplied for live feed in marine farming (Flaak and Epifanio 1978; Sanchez–Saavedra and Voltolina 1994). Currently, fluorescent light is mainly used for photosynthesis; however, light–emitting diodes (LEDs) have recently been developed to enhance profitability and efficiency. LEDs are long–lasting and have excellent prop- erties of low power dissipation and fast reaction times (Oh et al. 2007). Therefore, LEDs have recently been high- lighted as a next–generation energy–saving light source in the fishing industry (Choi 2008).
The present study showed that LEDs of different wave- lengths can be used to cultivate I. galbana microalgae with different effects on growth, as well as on amino acid, fatty acid, and pigment contents. Thus, the use of LEDs enhan- ces the production of this useful material for the aqua- culture, food, and medical industries by altering its bio- chemical characteristics.
Materials and Methods
Cultivation of microalgae under different LED light sources
I. galbana was obtained from the Korea Marine Microalgae Culture Center (KMMCC) and batch–cultured in a 2–L flask in Conway medium (Walne 1979) at 24°C and 33 psu. When the stagnation period was reached, the microalgae were harvested and used in the experiment.
Six light sources, including five units of 180W LED lamps (WFLL180, Wisepower, Korea; peak wavelengths:
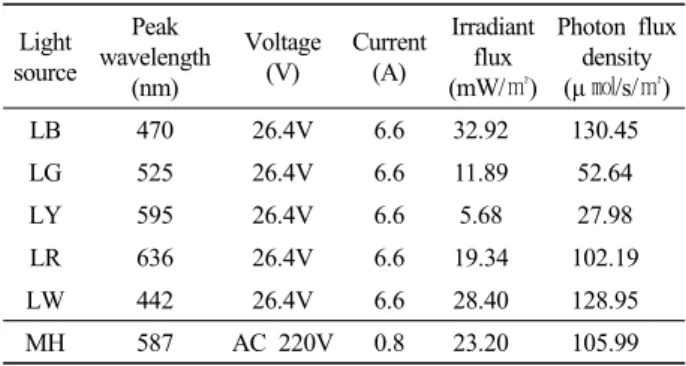
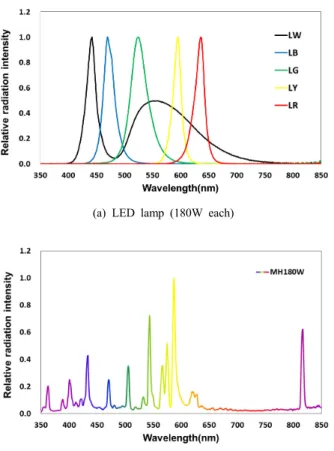
blue [LB] 470 nm; green [LG] 525 nm; yellow [LY] 595 nm; red [LR] 636 nm; white [LW] 442 nm) and 1 unit of a 175W metal halide (MH) lamp (HSL–MH175W, Hwasung, Korea) were used for the experiment (Fig. 1, Table 1).
Table 1. Specification of light sources used in the experiment
Light source
Peak wavelength
(nm)
Voltage (V)
Current (A)
Irradiant flux (mW/㎡)
Photon flux density (μ ㏖/s/㎡)
LB 470 26.4V 6.6 32.92 130.45
LG 525 26.4V 6.6 11.89 52.64
LY 595 26.4V 6.6 5.68 27.98
LR 636 26.4V 6.6 19.34 102.19
LW 442 26.4V 6.6 28.40 128.95
MH 587 AC 220V 0.8 23.20 105.99
* LB, led blue; LG, led green; LY, led yellow; LR, led red; LW, led white; MH, metal halide lamp.
The dry weight (DW), which indicated growth, was measured daily after 50 mL of the culture fluid was filtered using a GF/C filter paper (47 mm, WhatmanTM, UK) and the remaining salt was dissolved in distilled water, then dried for 1 h at 100°C. The DW was calculated according to the following formula:
(1)
where W1 and W2 are the DW (g/L) at t1 and t2, respectively.
(a) LED lamp (180W each)
(b) Metal helide lamp (180W)
Fig. 1. Relative radiation intensity curve of different light sources used in the experiment.
(LB, LED blue; LG, LED green; LY, LED yellow; LR, LED red; LW, LED white)
Biochemical composition analysis
To analyze the amino acids, 10 mg of each freeze–dried sample was placed in a 15–mL glass tube and hydrolyzed for 22 h at 120°C by adding 6N HCl. After the 6 N HCl was completely evaporated, 5 mL of 0.02 N HCl was add- ed, and the amino acids were melted. Then, using a 0.45–μ m filter, the melted amino acids were placed in a 1.8–mL vial, filling as much of the vial as possible, and they were then analyzed using an amino acid analyzer (Hitachi L–
8800, Japan).
Microalgae were harvested and kept at −80°C after cen- trifuging at 7,000 rpm for 15 min (SORVALL ST16R, Thermo, Germany). In the fatty acid analysis, lipids were extracted according to the method of Parrish (1987), and the fatty acids were extracted using BF3–methanol with the fatty acid methylation method of Morrison and Smith
(1964). The extracted fatty acids were analyzed by gas chromatography (HP 6,890plus, Agilent, USA), in which a capillary column (OMEGAWAX 250, SupelcoTM, USA) was used. The carrier gas was nitrogen (30 mL min–1), and the oven temperature was increased by 10°C min–1 from 200°C to 235°C. The injector temperature and detector (FID) temperature were set at 210°C and 250°C, respectively. Each fatty acid peak on gas chromatography was identified using a Supelco 37 Component FAME mix (SupelcoTM, 100 mg Nr at 18919–1AMP, USA) as the ref- erence material.
Carotenoids were analyzed using the method of Lichtenthaler and Wellburn (1983). First, a test piece of I.
galbana was cultivated in each plot, then placed in a 2–mL tube and centrifuged at 3,000 rpm for 15 min (Labogene, GYROZEN Inc., Korea) for desalination. The supernatant was then removed. After resuspension in 2 mL of methanol and mixing by vortexing, the sample was kept cold for 24 h. The supernatant was again centrifuged at 3,000 rpm for 15 min, and the absorbance was measured at 470 nm, 653 nm, and 666 nm with a spectrophotometer (V–550, JASCO, Japan).
Fucoxanthin was prepared based on the method of Zapata et al. (2000). I. galbana cultivated in each plot was filtered through a GF/C filter paper and placed in 95%
methanol, then its pigment was extracted at 4°C for 24 h.
A syringe filter (MFS, 0.2 μm pore size) was then used to remove the GF/C filter pieces present in the extracted materials. The filtered extract was injected into HPLC (Alliance 2695, Agilent, USA), and the pigment was separated. The peaks for each index pigment were de- termined by a comparison with the standard pigment and according to the retention time. The amount of standard pigment was calculated as described by Park and Park (1997), using the coefficient of extinction (Jeffrey et al.
1997).
Statistical analysis
The average values for the amino acid, fatty acid, and pigment contents of the microalgae were compared using a one–way ANOVA test with a significance level of 95%, using SPSS software version 14.0 (SPSS Inc., Chicago, IL, USA), with Duncan’s test for post hoc analysis (1955).
Results
Cultivation of microalgae according to the LED light source
The DW values, i.e. the cell growth, of I. galbana under different LED wavelengths are shown in Fig. 2. MH pro- duced rapid growth up to 0.59 gL–1 by the sixth day of cultivation, and growth gradually decreased after the stag- nation period. LW induced growth to an extent similar to that of MH until the sixth day of cultivation, but then in- duced continuous growth, which was different from that of MH after the seventh day; a maximum value of 0.68 gL–1 was observed on the ninth day of cultivation. LB induced growth to an extent similar to that of LW, but at a rate that was lower and more reliable than that induced by LW.
LR and LG produced DW values of 0.36 gL–1 and 0.34 gL–1, respectively, by the sixth day of cultivation, which increased to 0.47 gL–1 and 0.44 gL–1 by the eighth day and then began to decrease. LY induced the formation of 0.16 gL–1 on the fifth day and 0.18 gL–1 on the ninth day for cultivation. These results showed that cell growth varied according to the light source (P<0.05).
Fig. 2. Dry cell weight of I. galbana cultured for nine days under various light conditions. Data are expressed as mean±SD. LB, LED blue; LG, LED green; LY, LED yellow; LR, LED red; LW, LED white; MH, metal halide lamp.
Amino acid composition
Table 2 shows the amino acid composition of I. galbana according to wavelength of light used. Among the essential amino acids, the amounts of threonine, valine, isoleucine, leucine, phenylalanine, and lysine did not significantly dif-
fer among the different light sources (P>0.05). However, the amount of methionine under LY (5.7 mg mg–1) was lower than that under the other wavelengths, and the over- all level of essential amino acids (3.2 mg mg–1) was thus lower under LY than under LG, LW, and MH (P<0.05) and higher under LW, LG, and MG than under other wave- lengths (P<0.05). HN3 showed a high content of 26.0 mg mg–1 under LG and of 23.5–26.0 mg mg–1 under LR, LW, and MH, but LY resulted in a significantly lower value of 22.4 mg mg–1 (P<0.05).
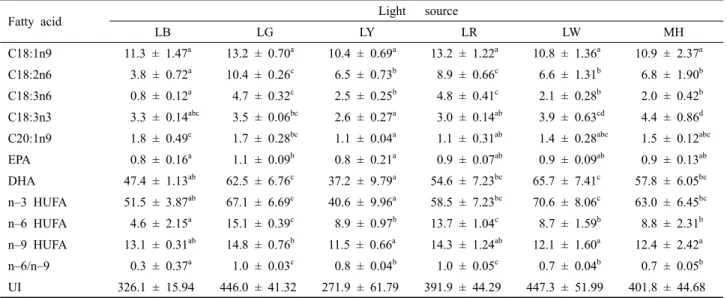
The fatty acid composition of I. galbana grown under different wavelengths is shown in Table 3. Regarding the content of C20:5n3 (EPA) and C22:6n3 (DHA) among un- saturated fatty acids, the EPA content under LG (1.1 mg mg–1) was significantly higher than under other wave- lengths (P<0.05). The DHA content under LW and LG (65.7 mg mg–1 and 62.5 mg mg–1, respectively) was also significantly increased (P<0.05); thus, n–6 HUFA levels were significantly increased under LG and LR (P<0.05).
However, DHA and n–3 HUFA levels under LY were sig- nificantly lower than under other wavelengths.
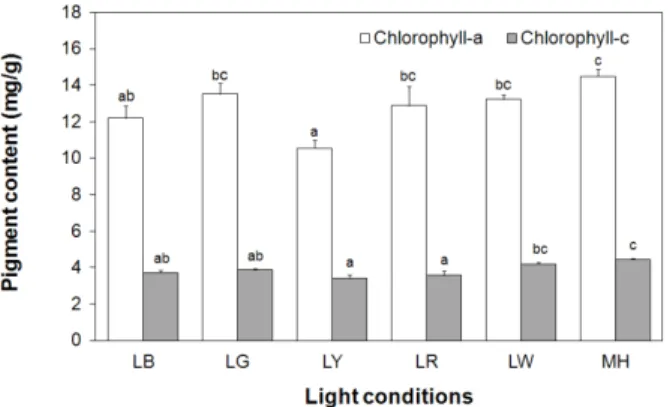
The pigment composition according to wavelength is shown in Figs. 3–5. The content of chlorophyll–a under MH light (14.5 mg g–1) was significantly increased (P<0.05), but that under LW, LG, and LR did not differ significantly. In contrast, LY resulted in the lowest value, 10.5 mg g–1 (P<0.05). In addition, the content of chlor- ophyll–c was highest under MH and LW (4.4 mg g–1 and 4.2 mg g–1, respectively), which represented a significant increase over the content under other wavelengths (P<0.05).
With regard to the changes in carotenoid contents, MH resulted in the highest value at 6.4 mg g–1, whereas LY re- sulted in the lowest value, 4.2 mg g–1, thus representing a significant difference among the wavelengths (P<0.05).
In addition, for fucoxanthin, MH light resulted in the high- est value at 0.28%, but this value was not significantly dif- ferent from those obtained using LW or LG light. LY re- sulted in the lowest value, 0.2%, and the values were thus significantly different from each other under the different wavelengths (P<0.05).
Table 2. Amino acid composition (ug/mg dry matter) of I. galbana under various light conditions
Amino acid Light source
LB LG LY LR LW MH
Aspartic acid 99.2 ± 10.57a 105.1 ± 2.96a 89.5 ± 5.18a 100.7 ± 7.68a 106.3 ± 5.01a 105.0 ± 1.42a Threonine 54.3 ± 6.02a 58.1 ± 1.38a 48.7 ± 2.74a 55.6 ± 4.21a 58.2 ± 2.56a 56.3 ± 0.73a Serine 54.1 ± 5.59a 56.9 ± 1.26a 49.2 ± 2.78a 56.4 ± 5.31a 57.9 ± 3.25a 55.4 ± 0.14a Glutamic acid 122.6 ± 10.45a 124.6 ± 2.87a 111.8 ± 6.22a 121.8 ± 10.17a 130.7 ± 6.97a 128.5 ± 1.95a Glycine 61.1 ± 6.77a 65.0 ± 2.46a 54.6 ± 3.06a 61.8 ± 5.46a 65.4 ± 3.20a 64.4 ± 0.68a Alanine 85.4 ± 10.01a 88.4 ± 1.68a 73.8 ± 3.84a 86.7 ± 7.59a 91.8 ± 4.13a 85.1 ± 1.71a Cysteine 5.0 ± 1.04a 4.4 ± 0.61a 2.6 ± 2.31a 4.0 ± 0.97a 4.7 ± 0.34a 1.7 ± 2.94a Valine 46.3 ± 5.89a 51.7 ± 2.32a 42.3 ± 3.64a 47.5 ± 2.34a 50.6 ± 3.10a 50.6 ± 2.56a Methionine 6.6 ± 1.76ab 10.8 ± 1.78b 5.7 ± 0.30a 9.5 ± 1.25ab 8.7 ± 0.39ab 8.6 ± 0.92ab Isoleucine 34.8 ± 4.60a 39.0 ± 3.25a 31.1 ± 1.73a 35.2 ± 1.63a 37.7 ± 2.21a 38.1 ± 1.95a Leucine 93.8 ± 10.78a 100.2 ± 5.03a 84.5 ± 5.18a 97.4 ± 11.96a 100.8 ± 4.53a 98.5 ± 3.78a Tyrosine 26.6 ± 5.32a 25.7 ± 2.43a 21.8 ± 0.87a 23.9 ± 2.85a 27.0 ± 0.42a 26.4 ± 1.03a Phenylalanine 56.4 ± 6.08a 59.4 ± 2.98a 49.9 ± 2.69a 55.9 ± 5.01a 60.2 ± 2.53a 58.9 ± 2.10a Lysine 59.8 ± 7.06a 63.4 ± 0.76a 53.1 ± 2.44a 60.1 ± 5.35a 63.9 ± 2.42a 60.4 ± 1.81a HN3 23.5 ± 1.86ab 26.0 ± 2.66b 22.4 ± 1.74a 25.8 ± 0.37ab 26.0 ± 3.31ab 23.5 ± 1.32ab Histidine 26.5 ± 1.67a 28.1 ± 0.72a 24.3 ± 1.61a 27.7 ± 1.61a 28.8 ± 2.00a 27.9 ± 1.57a Arginine 63.6 ± 7.66a 68.2 ± 0.69a 57.7 ± 3.31a 66.6 ± 5.32a 68.3 ± 3.58a 65.3 ± 1.35a Proline 62.4 ± 8.06a 66.8 ± 2.79a 55.7 ± 2.53a 64.5 ± 6.78a 67.4 ± 2.92a 64.2 ± 2.00a Hyproxyproline 23.1 ± 0.48a 27.0 ± 1.38a 21.3 ± 2.08a 28.4 ± 2.28a 26.0 ± 1.27a 25.0 ± 0.79a Essential AA(%) 35.2 ± 4.19ab 38.3 ± 1.73b 31.5 ± 1.82a 36.1 ± 3.14ab 38.0 ± 1.65b 37.1 ± 0.98b
*Significantly different (P<0.05) by ANOVA and Duncan's multiple comparison.
*LB, LED blue; LG, LED green; LY, LED yellow; LR, LED red; LW, LED white; MH, metal halide lamp.
Table 3. Fatty acid composition (ug/mg dry matter) of I. galbana under various light conditions*
Fatty acid Light source
LB LG LY LR LW MH
C18:1n9 11.3 ± 1.47a 13.2 ± 0.70a 10.4 ± 0.69a 13.2 ± 1.22a 10.8 ± 1.36a 10.9 ± 2.37a C18:2n6 3.8 ± 0.72a 10.4 ± 0.26c 6.5 ± 0.73b 8.9 ± 0.66c 6.6 ± 1.31b 6.8 ± 1.90b C18:3n6 0.8 ± 0.12a 4.7 ± 0.32c 2.5 ± 0.25b 4.8 ± 0.41c 2.1 ± 0.28b 2.0 ± 0.42b C18:3n3 3.3 ± 0.14abc 3.5 ± 0.06bc 2.6 ± 0.27a 3.0 ± 0.14ab 3.9 ± 0.63cd 4.4 ± 0.86d C20:1n9 1.8 ± 0.49c 1.7 ± 0.28bc 1.1 ± 0.04a 1.1 ± 0.31ab 1.4 ± 0.28abc 1.5 ± 0.12abc EPA 0.8 ± 0.16a 1.1 ± 0.09b 0.8 ± 0.21a 0.9 ± 0.07ab 0.9 ± 0.09ab 0.9 ± 0.13ab DHA 47.4 ± 1.13ab 62.5 ± 6.76c 37.2 ± 9.79a 54.6 ± 7.23bc 65.7 ± 7.41c 57.8 ± 6.05bc n–3 HUFA 51.5 ± 3.87ab 67.1 ± 6.69c 40.6 ± 9.96a 58.5 ± 7.23bc 70.6 ± 8.06c 63.0 ± 6.45bc n–6 HUFA 4.6 ± 2.15a 15.1 ± 0.39c 8.9 ± 0.97b 13.7 ± 1.04c 8.7 ± 1.59b 8.8 ± 2.31b n–9 HUFA 13.1 ± 0.31ab 14.8 ± 0.76b 11.5 ± 0.66a 14.3 ± 1.24ab 12.1 ± 1.60a 12.4 ± 2.42a n–6/n–9 0.3 ± 0.37a 1.0 ± 0.03c 0.8 ± 0.04b 1.0 ± 0.05c 0.7 ± 0.04b 0.7 ± 0.05b UI 326.1 ± 15.94 446.0 ± 41.32 271.9 ± 61.79 391.9 ± 44.29 447.3 ± 51.99 401.8 ± 44.68
*Significantly different (P<0.05) by ANOVA and Duncan's multiple comparison.
*LB, LED blue; LG, LED green; LY, LED yellow; LR, LED red; LW, LED white; MH, metal halide lamp.
Fig. 3. Comparison of the chlorophyll–a and chlorophyll–c content of I. galbana under various light conditions. The letters "a" through "d"
on the bars indicate significant differences as non–order symbols by Duncan’s multiple–range test. Different letters (such as a:b or a:c) between different light conditions indicate significant differences (P<0.05), while an identical superscript (for example, a:ab or b:ab) indicates non–significant differences (P>0.05).
Fig. 4. Comparison of carotenoid content of I. galbana under various light conditions. The letters "a" through "d" on the bars indicate significant differences as non–order symbols by Duncan’s multiple–
range test.
Fig. 5. Comparison of fucoxanthin content of I. galbana under various light conditions. The letters "a" through "d" on the bars indicate significant differences as non–order symbols by Duncan’s multiple–
range test.
Discussion
Growth of microalgae under different LED light sources
Photo–autotrophic microalgae are affected by aspects of light quality, such as wavelength, because they use light as their energy source for cell growth (Wang et al. 2007).
Thus, LEDs can provide microalgae with the most suitable light because the necessary wavelength can be targeted;
furthermore, LED lights have long lives, low power dis- sipation, and fast reaction times (Oh et al. 2007). Thus, the present study was performed to determine the effect of spe- cific wavelengths of LED lamps on the growth of I.
galbana.
Different wavelengths of light had different effects on growth; in particular, the dry weight was highest under LW light. In LW, the colors of three wavelengths are mixed in the RGB combination (red, green, and blue) (Bang and Kim 2012). Similarly, Schofield et al. (1990) showed im- proved growth and photosynthesis of Chaetoceros gracilis when it was cultivated using a white light source, and Chung et al. (1999) reported that the growth rate of Dunaliella bardawil was high in white light. However, in the marine environment, the cyan wavelength typically pre- dominates (Wallen and Geen 1971), and microalgae ex- posed to a blue wavelength thus show a tendency toward increased chlorophyll levels and growth (Jeffrey and Vesk 1997). In contrast, there was no difference in growth rates between the blue wavelength and other wavelengths for some demersal Bacillariophyceae (Correa–Reyes et al.
2001), the dinoflagellate Heterocapsa pygmaea (Nelson and Prezelin 1990), and the Bacillariophyceae Skeletonema costatum (Tremblin et al. 2000). Thus, the effects of LED wavelength are species–specific (Oh et al. 2007).
Wavelengths in the range of 400–700 nm, used for LED light sources in agriculture, are blue, green, and red (Bang and Kim 2012), and the LB and LR light in the present study thus induced increased growth. In addition, in the case of D. bardawil, blue light produced increased stress in the cell, because blue light has a short wavelength sim- ilar to that of ultraviolet rays. Thus, mass production of β–carotene was promoted to protect the cell, and cell growth was reported to be obstructed (Ben et al. 1989). It
has also been reported that white light is very effective for inducing a high growth rate (Chung et al. 1999).
In contrast, LY resulted in the lowest growth rate of I.
galbana, because the yellow wavelength is outside the ab- sorption range of chlorophyll (Oh et al. 2007), resulting in reduced photosynthesis (Blanchard and Montagna 1992).
Changes in amino acid and fatty acid contents The nutritional properties of materials used as protein sources are related to the constituent amino acid composi- tion and contents. Utilization of microalgae as a protein source is more efficient when the content of essential ami- no acids is high (Webb and Chu 1983). In this study, the content of the essential amino acids (threonine, valine, me- thionine, isoleucine, leucine, phenylalanine, and lysine) was high under LW, LG, and MH light (P<0.05). Wallen and Geen (1971) reported that the amino acid content was highest under the green wavelength in C. nana and D. ter- tiolecta cultivated under white, blue, or green wavelengths, because of enhanced stimulation under short wavelengths, such as green and blue light. Similar results were obtained in the present study. In addition, among the amino acids, the content of glutamic acid (10.0%–11.9%) was found to be the highest in Isochrysis sp., Pavlova lutheri, and Nannochloropsis oculata (Brown et al. 1993). Furthermore, Brown (1991) reported that the most prevalent amino acids were glutamic acid (11.2%), aspartic acid (8.6%), leucine (7.7%), and alanine (1.9%).
The fatty acid composition of microalgae used for feed plays an important role in viability and growth. The ratio of EPA to DHA content has been used as an index for nu- tritional evaluation (Watanabe et al. 1983). Yoshioka et al.
(2012) emphasized the importance of fatty acid composi- tion and the effects of the light source on fatty acid content.
The content of EPA was 0.8–1.1 mgmg–1 and was only slightly different among most light sources in this study;
however, the EPA content under LG light was significantly increased (P<0.05). Volkman et al. (1989) observed a low content of EPA in Isochrysis sp. In the present study, the content of DHA under LW and LG light was significantly higher than under other wavelengths (P<0.05). Thus, levels of n–3 HUFA tended to be similar, whereas those of n–6 HUFA and n–9 HUFA were significantly increased under
LG light (P<0.05). Similarly, Das et al. (2011) reported that the EPA content for Nannochloropsis sp. was higher under white light than under blue light.
Change of pigment composition
The pigment content and photosynthetic capability of microalgae are affected by environmental factors, such as the wavelength of light (Rocha et al. 2003, Mougeter al.
2004). In the present study, the carotenoid content was high under MH light and low under LY light, which represented a significant difference among the wavelengths (P<0.05).
Fucoxanthin demonstrated a similar tendency (P<0.05).
Thus, MH light resulted in a higher dry weight, i.e., greater cell growth, than did LW light, probably based on a differ- ence in chlorophyll accumulation. Chlorophyll biosynthesis was higher under MH light than under LW light; a previous study showed that rapid cell growth in Chlorella vulgaris involved a reduction of chlorophyll–a levels resulting from a lack of space for pigment accumulation (Seyfabadi et al.
2011). In addition, biosynthesis and accumulation of β–car- otene was approximately 80%–90%, depending on the light –wavelength conditions, which resulted in decreased growth rates and reduced cell numbers under considerable stress from incident light (Lamers et al. 2010). Fucoxanthin is a type of carotenoid that is easily oxidized and destroyed by optical irradiation, peroxidase, and chemicals, and it has a specific absorption band of 300–500 nm (Mascio et al.
1989). The cell growth and the chlorophyll and carotenoid levels for I. galbana were significantly increased under multiple wavelengths and in the 300–500 nm band.
In the present study, the microalgal growth rate and con- tent of amino acids, fatty acids, and pigments (carotenoids and chlorophyll a and c) varied according to the wave- length of LED light. Thus, wavelengths should be selected according to cultivation purposes; in particular, I. galbana will achieve optimal growth and biochemical composition when LW and LG light are used.
Acknowledgement
This work was supported by a grant from the National Institute of Fisheries Science (R2015046).
References
Bang GW and Kim YH. 2012. LED for plant growth regulators for the study of light on the device. J Kor Soc Digit Poli Manag 10, 267-272.
Belarbi EH, Molina E and Chisti Y. 2000. A process for high yield and scaleable recovery of high purity eicosapentaenoic acid esters from microalgae and fish oil. Proc Biochem 35, 951-969.(doi:10.1016/s0032-9592(00)00126-6)
Ben-Amotz A, Katz A and Avron M. 1989. Mode of Action of the Massively Accumulated ß-carotene of Dunaliella bar- dawil in Protecting the Alga against Damage by Excess Irradiation. Plant Physiol 91, 1040-1043. (doi:10.1104/
pp.91.3.1040)
Blanchard GF and Montagna PA. 1992. Photosynthetic response of natural assemblages of marine benthic microalgae to short-term and long-term variations of incident in Baffin Bay.
J Phycol 28, 7-14. (doi:10.1111/j.0022-3646.1992.00007) Brown MR. 1991. The amino-acid and sugar composition of 16
species of microalgae used in mariculture. J Exp Mar Biol Ecol 145, 75-99. (doi:10.1016/0022-0981(91)90007-j) Brown MR and Jeffrey SW. 1992. Biochmocal composition of mi-
croalgae from the green algal classes Chlorophyceae and Prasinophyceae. 1. Amino acids, sugars and pigments. J Exp Mar Biol Ecol 161, 91-113. (doi:10.1016/0022-0981(92) 90192-d)
Brown MR, Garland CD, Jeffrey SW, Jameson JD and Leroi JM.
1993. The gross and amino acid compositions of batch and semi-continuous cultures of Isochrysis sp. (clone TISO), Pavlovalutheri and Nannochloropsisoculata. J Appl Phycol 5, 285-296. (doi:10.1007/bf02186231)
Carvalho AP and Malcata FX. 2000. Effect of culture media on production of polyunsaturated fatty acids by Pavlovalutheri.
Cryptogamie Algol 21, 59-73. (doi:10.1016/s0181-1568(00) 00101-x)
Choi SJ. 2008. Comparison of Radiation Characteristics and Radiant Quantities per unit Electrical Power between High Luminance Light Emitting Diode and Fishing Lamp Light Source. J Kor Fish Soc 41, 511-517. (doi:10.5657/kfas.
2008.41.6.511)
Chu FE and Webb KL. 1984. Polyunsaturated fatty acids and neu- tral lipids in developing larvae of the oyster, Crassostrea virginica. Lipids 19, 815-820. (doi:10.1007/bf02534509) Chung WJ, Wang M, Choi SG, Kim JK and Jeong BC. 1999. High
Cell Density Cultures of Micro-algal Dunaliella bardawil.
Korean J Biotechnol Bioeng 14, 160-166.
Cook PM. 1951. Chemical engineering problems in large scale cul- ture of algae. J Ind Eng Chem 43, 2385-2389. (doi:10.1021/
ie50502a056)
Correa-Reyes JG, Sanchez-Saavedra MP, Siqueiros-Beltrones DA and Flores-Acevedo N. 2001. Isolation and growth of eight strains of benthic diatoms, cultured under two light conditions. J Shellfish Res 20, 603-610.
Das P, Wang L, Aziz SS and Jeffrey PO. 2011. Enhanced algae growth in both phototrophic and mixotrophic culture under blue light. Bioresource Technol 102, 3883-3887.
(doi:10.1016/j.biortech.2010.11.102)
Duncan DB. 1955. Multiple-range and multiple F-tests. Biometrics 11, 1-42. (doi:10.2307/3001478)
Flaak AR and Epifanio CE. 1978. Dietary protein levels and growth of the oyster Crassostrea virginica. Mar Biol 15, 157-163.
(doi:10.1007/bf00390551)
Fuentes MMR, Fernandez GGA, Perez JAS and Guerrero JLG.
2000. Biomass nutrient profiles of the microalga Porphyridium cruentum. Food Chem 70, 345-353. (doi:10.1016/s0308- 8146(00)00101-1)
Gummert F, Meffert ME and Stratmann H. 1953. Non-sterile large scale culture of chlorella in greenhouse and open air. In Algal culture from Laboratory to Pilot Plant, J.S. Burlew, Ed., Carnegie Institution of Washington Publication, Washington DC, pp 166-176.
Jeffrey SW, Mantoura RFC and Wright SW. 1997. Phytoplankton Pigments in Oceanography. UNESCO Publishing, Paris.
Jeffrey SW and Vesk M. 1997. Effects of blue-green light on photo- synthetic pigments and chloroplast structure in the marine di- atom Stephanopyxis turris. J Phycol 13, 271-279.
(doi:10.1111/j.1529-8817.1977.tb02927.x)
Lamers PP, van de Laak CC, Kaasenbrood PS, Lorier J, Janssen M, De Vos C, Bino RJ and Wijffels RH. 2010. Carotenoid and fatty acid metabolism in light-stressed Dunaliella saline.
Biotechnol Bioeng 106, 638-648. (doi:10.1002/bit.22725) Langdon CJ and Walcock MJ. 1981. The effect of algal and artifi-
cial diets on the growth and fatty acid composition of Crassostrea gigas Spat. J Mar Bio Ass UK 61, 431-448.
(doi:10.1017/s0025315400047056)
Lichtenthaler HK and Wellburn AR. 1983. Determination of total carotenoids and chlorophyll a and b of leaf extract in different solvents. Biochem Soc Trans 11, 591-592. (doi:10.1042/
bst0110591)
Lid AJ and Abalde HC. 1992. High yield mixotrophic culture of the marine microalga Tetraselmis suecica (kylin) Butcher (Prasinophyceae). J Appl Phycol 4, 31-37. (doi:10.1007 /bf00003958)
Mascio P, Kaiser S and Sies H. 1989. Lycopene as the most effi- cient biological carotenoid singlet oxygen quencher. Arch Biochem Biophys 274, 532-538. (doi:10.1016/0003-9861(89) 90467-0)
Morrison WR and Smith LM. 1964. Preparation of fatty acid meth-
ylesters and dimethyl acetata from lipids with boron tri- fluoride-methanol. J Lipid Res 5, 600-608.
Nelson NB and Prezelin BB. 1990. Chromatic light effects and physiological modeling of absorption properties of Heterocapsa pygmaea (=Glenodinium sp.). Mar Ecol Prog Ser 63, 37-46. (doi:10.3354/meps063037)
Oh HM, Choi AR and Mheen TI. 2003. High-Value Materials from Microalgae. J Microbiol Biotechnol 31, 95-102.
Oh SJ, Park DS, Yang HS, Yoon YH and Honjo T. 2007.
Bioremediation on the Benthic Layer in Polluted Inner Bay by Promotion of Microphytobenthos Growth Using Light Emitting Diode (LED). J Kor Soc Mar Environ Eng 10, 93-101.
Park MO and Park JS. 1997. HPLC method for the analysis of chlorophylls and carotenoids from marine phytoplankton. J Kor Soc Oceanogr 32, 46-55.
Parrish CC. 1987. Separation of aquatic lipid classes by Chromarod thin-layer chromatography with measurement by Iatroscan flame ionization detection. Can J Fish Aquat Sci 44, 722-731.
(doi:10.1016/0198-0254(87)95872-9)
Rocha JM, Garcia JE and Henriques MH. 2003. Growth aspects of the marine microalga Nannochloropsis gaditana. Biomol Eng 20, 237-242. (doi:10.1016/s1389-0344(03)00061-3) Sanchez-saavedra MP and Voltolina D. 1994. The Chemical compo-
sition of Chaetoceros sp. (Bacillariophyceae) under different light conditions. Comp Biochem Physiol - Part B: Biochem 107, 39-44. (doi:10.1016/0305-0491(94)90222-4)
Schofield O, Bidigare RR and Prézelin BB. 1990. Spectral photo- synthesis quantum yield and blue-green light enhancement of productivity rates in the diatom Chaetoceros gracile and prymnesiophyte Emiliania huxleyi. Mar Ecol Prog Ser 64, 175-186. (doi:10.3354/meps064175)
Seyfabadi J, Ramezanpour Z and Zahra AK. 2011. Protein, fatty acid, and pigment content of Chlorella vulgaris under differ- ent light regimes. J Appl Phycol 23, 721-726.
(doi:10.1007/s10811-010-9569-8)
Shamsudin L. 1992. Lipid and fatty acid composition of microalgae used in Malaysian aquaculture as live food for the early stage of penaeid larvae. J Appl Phycol 4, 371-378. (doi:10.1007/
bf02185795)
Sun YY and Wang CH. 2009. The Optimal Growth Conditions for the Biomass Production of Isochrysis galbana and the Effects That Phosphorus, Zn2+,CO2, and Light Intensity Have on the Biochemical composition of Isochrysis galbana and the
Activity of Extracellular CA. Biotechnol Bioproc Eng 14, 225-231. (doi:10.1007/s12257-008-0013-8)
Tremblin G, Cannuel R, Mouget JL, Rech M and Robert JM. 2000.
Change in light quality due to a blue-green pigment, mar- iennine, released in oyster-ponds: effect on growth and photo- synthesis in two diatoms, Haslea ostrearia and skeletonema costatum. J Appl Phycol 12, 557-566.
Volkman JK, Jeffrey SW, Nichols PD, Rogers GI and Garland CD.
1989. Fatty acid and lipid composition of 10 species of micro- algae used in mariculture. J Exp Mar Biol Ecol 128, 219-240.
(doi:10.1016/0022-0981(89)90029-4)
Wallen DG and Geen GH. 1971. Light quality in relation to growth, photosynthetic rates and carbon metabolism in two species of marine plankton algae. Mar Biol 10, 34-43. (doi:
10.1007/bf02026764)
Walne PR. 1979. Culture of bivalve molluscs, 50 year's experience at Conwy. The whitefriars Press Ltd London, p 189.
Wang CY, Fu CC and Liu YC. 2007. Effects of using light-emitting diodes on the cultivation of Spirulina platensis. Biochem Eng J 37, 21-25. (doi:10.1016/j.bej.2007.03.004)
Watanabe T, Kitajima C and Jujita S. 1983. Nutrition value of live organisms used in Japan for mass propagation of fish: A review. Aquaculture 34, 115-143. (doi:10.1016/0044-8486 (83) 90296-x)
Webb KL and Chu FE. 1983. Phytoplankton as a food source for bivalve larvae. In Proceedings of the 2nd International Conference, World Mariculture Society, Spcc Publ Louisiana State University, Louisiana, USA, pp 272-291.
Yoshioka M, Yago T, Yoshie-Stark Y, Arakawa H and Morinaga T. 2012. Effect of high frequency of intermittent light on the growth and fatty acid profile of Isochrysis galbana.
Aquaculture 338, 111-117. (doi:10.1016/j.aquaculture.
2012.01.005)
Zapata M, Rodriguez F and Garrido JL. 2000. Separation of chlor- ophylls and carotenoids from marine phytoplankton: a new HPLC method using a reversed phase C8 column and pyr- idine containing mobile phases. Mar Ecol Prog Ser 195, 29-45. (doi:10.3354/meps195029)
2015. 11. 02 Received 2015. 11. 24 Revised 2015. 11. 25 Accepted