• 검색 결과가 없습니다.

Advances in Damage Visualization Algorithm of Ultrasonic Propagation Imaging System

N/A
N/A
Protected

Academic year: 2021

Share "Advances in Damage Visualization Algorithm of Ultrasonic Propagation Imaging System"

Copied!
9
0
0

로드 중.... (전체 텍스트 보기)

전체 글

(1)

ISSN 1225-7842 / eISSN 2287-402X

1. Introduction

Ultrasonic wave has a unique ability to travel for long distances in thin walled structures which makes it an attractive proposition to monitor large area with less number of sensors and actuators. As such there is a huge interest to exploit this wave property for non-destructive evaluation of complex structures.

However, a lack of effective signal proc- essing and imaging algorithms has hindered its usage to full potential. Contact transducers such as piezoelectric transducers, electro-magnetic acoustic transducers(EMAT) and piezoceramic transducers are widely adopted method to generate and sense ultrasonic waves[1-4]. In these methods, signals are generally analyzed by tedious processes such as temporal referencing and baseline comparison with data from last know intact condition of structures. This method is only able to inspect limited area while the resolution and damage sensing capability greatly depends on number and location of transducers.

The user also requires extensive knowledge of

signal processing to properly isolate correct information regarding anomalies from the signals.

An alternate approach to signal analysis is to generate an ultrasonic wavefield image or wave propagating movie which provides detailed information about the severity and location of the damage[5]. This method is a temporal- reference free imaging system which provides an easy and rapid defect inspection system.

In this paper, a scanning laser for ultrasonic wave generation and fixed contact/non-contact transducers such as air-coupled transducer mount- ed on a scanning stage[6] or scanning laser vibrometer[7] as a sensing agent has been used to generate wavefiled image and movie. A scanning laser provides advantages such as wide area scanning ability, low noise due to mechanical decoupled scanning system and protection to specimen from the bonding of the transducers. Coupling non-contact sensors such as air-coupled transducers with scanning laser system as demonstrated in this paper provides a fully non-contact sensing system enabling rapid, coupling free damage assessment system[8,9].

Advances in Damage Visualization Algorithm of Ultrasonic Propagation Imaging System

Jung-Ryul Lee and Nitam Sunuwar (Chonbuk National University) E-mail: [email protected]

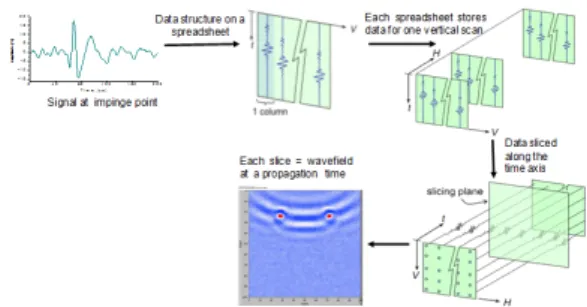
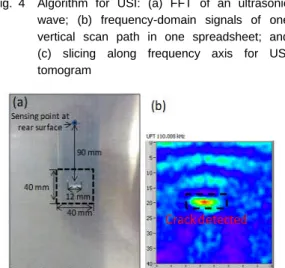
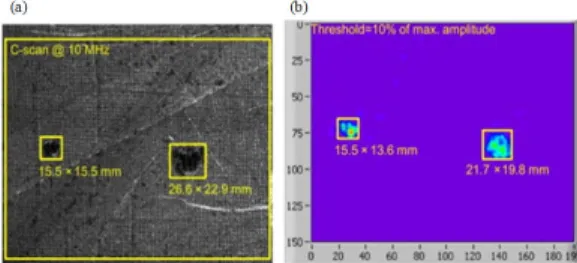
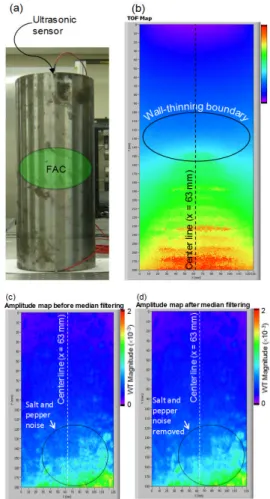
Abstract This paper presents recent advances in damage visualization algorithms of laser generated ultrasonic propagation imaging(UPI) system. An effective damage evaluation method is required to extract correct information from raw data to properly characterize anomalies present in structure. A temporal-reference free imaging system provides easy and rapid defect inspection capability with less computational complexity. In this paper a number of methods such as ultrasonic wave propagation imaging(UWPI), anomalous wave propagation imaging(AWPI), ultrasonic spectral imaging(USI), wavelet ultrasonic propagation imaging(WUPI), variable time window amplitude mapping(VTWAM), time point adjustment(TPA), time of flight and amplitude mapping(ToF&Amp) and ultrasonic wavenumber imaging(UWI) are discussed with instances of successful implementation on various structures.

Keywords: Image Analysis, Structural Health Monitoring(SHM), Defects, Laser Ultrasonic

2013, Korean Society for Nondestructive Testing

(2)

With improvement in the hardware section (introduction of an air-cooling Q-switched diode- pumped solid-state laser with a nanosecond pulsed mode for high-speed scanning(1 kHz), development of laser mirror scanner for high- speed precise control of laser impinge points) of UPI system, progress in damage assessment algorithms have been made to achieve far better processing speed (discussed in third section) according to the algorithms.

The objective of the paper is to system- atically introduce and discuss the development of various damage visualization algorithms.

Successful implementations of these algorithms are also presented with the descriptions.

2. Ultrasonic Wave Generation / Detection System

The schematic diagram of the ultrasonic wave generation/detection is shown in Fig. 1. This setup can be divided into 2 major parts depending on the function: (a) ultrasonic generation system and (b) ultrasonic sensing system.

2.1 Scanning Laser Ultrasonic Generation System

This consists of an air-cooling Q-switched diode-pumped solid-state laser with a nano- second pulsed TEM00 (M2<1.2) mode. The laser has a wavelength of 532 nm, with a laser

beam diameter at the exit port and beam divergence of 0.4 mm and 1.6 mrad respec- tively. Q-switching, sometimes known as giant pulse formation, is a technique by which a laser can be made to produce a pulsed output beam from a continuous beam. Other diode-pumped solid-state laser benefits include high efficiency, compactness, stable low-noise operation, reduced thermal effects in the laser medium, long-life, and the prospect of low cost over the long operational life.

The other important component in this system is a laser mirror scanner(LMS), a cus- tomized device for rapid scanning of the sample.

The scan head was sealed against water and dust, has dimensions of 69 mm × 78.5 mm × 77.9 mm, and weighs only 650g. It was provided with a rapid maneuvering laser impinging point instead of bulky laser head scanning. PC interface boards provide synchro- nous interference-resistant control of the scan systems and lasers in real time, and enabled high-speed scanning.

2.2 Ultrasonic Sensing System

An ultrasonic sensing system consists of contact and non-contact transducers. R-cast PZT contact sensors with different central frequency (mostly 204 and 304 KHz) were used for some of the work described in this paper. An air-coupled transducer (capacitance and piezo- electric) and laser-doppler-vibrometer(LDV) were used as non-contact sensors which in com- bination with laser ultrasonic generation made the system a fully non-contact ultrasonic wave generation/detection system.

The aforementioned two systems in com- bination with damage visualization algorithms (discussed in next section) together is referred to as ultrasonic propagation imaging(UPI) system by this author. This system was controlled by program in LabVIEW platform, where scanning Fig. 1 Experimental setup for contact and non-

contact sensing system

(3)

and data acquisition are simultaneously perform- ed for real-time display of the inspection results.

3. Damage Visualization Algorithm

The analog signals picked up by the sensors are digitized and stored for further processing.

Generally, the data processing techniques can be post-, on-the-fly and real-time processing tech- niques. Post-processing technique is when the data starts being processed after the data is completed collected in the memory. In contrast, on-the-fly processing technique is when the data starts being processed while the data is still being acquired in the data acquisition(DAQ) system. Then, real-time processing technique is defined as the subset of on-the-fly processing technique, where its data processing time responses within strict time constraints. A number of data processing algorithms as seen in Fig. 2 are developed to highlight damage corresponding to different failure mode and manufacturing flaws. Among these, UWPI, USI and AWPI have been developed as real-time

processing technique while the rest are implemented as on-the fly technique except for the latest UWI algorithm.

3.1 Ultrasonic Wave Propagation Imaging (UWPI)

The UWPI is a space-time domain represen- tation of wavefield generated in the scan- area[10]. This algorithm is a simple model yet very effective usually employed as the first damage assessment method. Ultrasonic waves generated at each laser impinging point along one vertical movement were stored on one data spreadsheet according to the data structure in Fig. 3. It was then rearranged to get the time domain information perpendicular to H and V axis as illustrated in Fig. 3 and sliced along the time axis so that each slice of data physically maps the ultrasound magnitude at every laser impinging points of the scanned area. These slices were successively loaded to an intensity graph to generate the ultrasound propagation movie. Every plot of intensity graph also represents one image snapshot from the movie.

The anomalies in the structure are highlighted when the propagating wave is interfered by them which gets scattered or reflected depending upon the damage type, orientation and dimension.

3.2 Ultrasonic Spectral Imaging(USI)

An ultrasonic spectral imaging(USI) algorithm Fig. 2 Multiple damage visualization algorithms

[TPA: time point adjustment USI: ultrasonic spectral imaging, UWI: ultrasonic wavenumber imaging, WRWI:

wave rich wavelength imaging, VTWA: variable time window amplitude, UWPI: ultrasonic wave propagation imaging, WUPI: wavelet ultrasonic propagation imaging, ToF&Amp: time of flight and amplitude mapping]

Fig. 3 Experimental setup for contact and non-

contact sensing system

(4)

is use to visualize the damage and defect in the frequency domain[11]. For the generation of USI, the time domain signal is transformed to the frequency domain using a fast Fourier transform(FFT). An example of this trans- formation is shown in Fig. 4. The data received from each impinge point provides information in time domain. Such data from the impinge points were Fourier transformed and arranged in 3D space-frequency domain, where each slice in frequency domain provides 2D spatial informa- tion at certain frequency. These slices were loaded successively loaded in the intensity graph to generate using a suitable color scheme to generate an ultrasonic frequency tomogram.

When structural damage exists and the frequency of the damage-related wave is same as the frequency of the tomogram, the tomogram will show the spectral amplitude concentrated at the location of the structural damage. Inspecting the tomograms on a frame-by-frame basis could

hence facilitate damage identification, localization and evaluation. This frequency range of the tomogram is also the representation of the damage-related ultrasonic wave frequency range.

This information (frequency range) can also be used as the optimum frequency in the WUPI algorithm (explained further in next paragraph) to improve its performance. An example of USI usage is depicted in Fig. 5, to identify the hidden crack on a 3 mm thick Al plate.

3.3 Wavelet Ultrasonic Propagation Imaging (WUPI)

A wavelet-transformed ultrasonic propagation imaging method is capable of ultrasonic propagation imaging in the frequency domain [12]. An algorithm for WUPI is depicted in Fig.

6. Since this method has strong frequency selectivity, it can visualize the propagation of ultrasonic waves of a specific frequency (which helps to isolate ultrasonic mode of interest and damage-related wave). The frequency selectivity Fig. 4 Algorithm for USI: (a) FFT of an ultrasonic

wave; (b) frequency-domain signals of one vertical scan path in one spreadsheet; and (c) slicing along frequency axis for USI tomogram

Fig. 5 (a) Aluminum test specimen (b) USI image at 110 kHz

Fig. 6 Algorithm for frequency-selectable WUPI: (a) WT of ultrasonic wave; (b) transformed signals of one vertical scan path on one spreadsheet; and (c) slice along time axis for WUPI movie freeze-frames

Fig. 7 (a) GFRP wind turbine blade specimen (b)

Wavelet transformed ultrasonic propagation

images using the contact PZT UPI system

on CFRP wing box

(5)

of the wavelet-transformed ultrasonic propagation imaging is important because ultrasonic wave at different frequency is sensitive to different structural feature and damage types.

This method is also capable of converting a complex time domain multiple wavefield into a simple frequency domain single wavefield. This feature enables easy interpretation of the results, and facilitates the precise evaluation of the location and size of structural damage or flaws.

This algorithm was used to identify debonding damage between spar and skin in glass-fiber- reinforced plastic(GFRP) wind blade in Fig. 7.

3.4 Anomalous Wave Propagation Imaging (AWPI)

This image processing algorithm was based on the observation that two adjacent impinge- ment points realized by the developed high speed and precise beam scanning system generate highly similar waveforms, and that the propagation direction of the incident wave is different from that of the damage-induced anomalous wave. The algorithm suppressed the incident waves and highlighted effectively the anomalous waves such as the scattering wave from the damage boundary and the confining wave within the damage boundary[13,14] as seen in Fig. 8 which was used to identify the impact damages in CFRP wing skin (depicted in Fig. 9(a)). The AWPI retained the advantages of baseline subtraction and at the same time eliminated the necessity of obtaining and maintaining a reliable database of baseline data from the intact structural condition, hence overcoming the disadvantages of conventional temporal referencing. This algorithm provides a simple time domain computation method making it suitable for fully automatic results processing without theoretical knowledge, experimental baseline data and conversion to spectral domain.

This implicit nature of spatial referencing makes

the AWPI method a practical choice for use in onsite inspection.

3.5 Variable Time Window Amplitude Mapping (VTWAM)

VTWAM is an imaging method that can show the peak-to-peak amplitude of the wave within a specific window of wave propagation time using one static image. It was developed based on the results from the AWPI method that the exaggerated anomalous wave always appears after the residual incident wave sweeps over the structural anomaly, and the confining anomalous wave is generated based on the mechanism similar to the standing wave formation and exhibits a longer continuation within the damage. By choosing the time after the propaga- tion of the residual incident waves as the start of the time window, and the end of all wave propagation as the end of the time window, the VTWAM image shows only the peak-to-peak

Fig. 8 Suppression of the incident waves while highlighting the two impact-damaged areas in a curved composite wing skin using the AWPI method. (a) 124.8 and (b) 147.2

Fig. 9 Statistical damage threshold establishment:

(a) immersion C-scan result and (b) optimized

VTWAM with statistical threshold for damage

sizing

(6)

amplitude of the exaggerated anomalous waves, thus effectively enhancing the visibility of the damage area with the anomalous wave. A major advantage of this algorithm over AWPI is that it facilitates a proper size evaluation of the anomalies, and reduces the discrepancy in the size evaluated from different freeze-frames of the AWPI movie. This can be observed in Fig. 9.

3.6 Time Point Adjustment(TPA)

Despite the superior signal repeatability of the ultrasonic propagation system(UPI), there is a slight difference in wave arrival time between two adjacent laser impingement points. Time point adjustment(TPA) algorithm minimizes this difference by wave shifting along the time axis.

During this procedure, it automatically focuses on the matching of the incident wave with dominant amplitudes. However, the anomalous wave becomes more mismatched during this process and is exaggerated thereby indicating the severity and location of the damage. This algorithm is more suitable for crack type defect and is also used during AWPI process. An example of its usage is shown in Fig. 10 to detect crack in an aluminum plate.

3.7 Time of Flight and Amplitude Mapping (ToF&A)

The ToF&A mapping algorithm uses mode identification based on wavelet transform, an automatic threshold setting method based on the statistics of the spatial noise map, and two dimensional(2D) ToF extraction based on the threshold crossing time method[15]. The wavelet- transform(WT) scalogram can show the signal distribution as a function of frequency, time and mode. Thus the ToF measurement can be achieved by extracting the arrival time of the WT magnitude at a selected frequency and mode. An example of this method can be seen

Fig. 10 Crack detected after implementation of TPA mapping

Fig. 11 (a) Stainless steel pipe with wall-thinning

(b) time of flight (TOF) map for wall-thinned

pipe (c) amplitude map before median

filtering (d) amplitude map after median

filtering

(7)

in Fig. 11 to visualize the wall-thinned region in nuclear power pipe(NPPs) piping system. Based on the understanding of the ToF change in the wall-thinned region, and on the mode collapse and attenuation that occurred because of the ultrasonic bottleneck phenomenon, the wall- thinned region was evaluated. However, this conventional threshold crossing technique generally encounters the difficulty in setting a common threshold level in the extraction of the respective time-of-flights(ToFs) and amplitudes from the guided waves obtained at many different points by spatial scanning. Therefore, a statistical threshold determination method through noise map generation was proposed to automatically process numerous guided waves having different propagation distances[16]. The guided waves were wavelet-transformed and the 1D WT magnitudes at time zero were used to generate a 2D noise map. Three theoretical noise distributions(gamma, weibull and expo- nential), were embedded into the algorithm in order to select the one which best fit the experimental noise distribution. The visibility of the ToF and amplitude maps were further enhanced by 1D median filter as shown in Fig.

11(c) and (d).

3.8 Ultrasonic Wavenumber Imaging(UWI)

The UWI algorithm is another damage assessment method based on wavenumber filtered measurements. This algorithm initially utilizes the 3D space-time representation of the UWPI data, where each slice represents a 2D wavefield image. A 2D fast Fourier transform(FFT) is then applied to this spatial information in time domain thereby changing it to a wavenumber domain. A wavenumber filtering is then applied and inverse Fourier transformed(IFFT) to get the measurement back to space domain.

When the wave propagates through some structural inhomogeneity (change in geometry or

material, crack, debonding, etc.), they get reflected or scattered changing the characteristics (wavenumber, wavelength etc) of travelling ultrasonic waves over the anomalies. This change in wavenumber over the damaged region from the surrounding environment is visualized using this algorithm. The result can be further improved by computing a spatial envelope of these wavenumber filtered frames. Thus using this imaging method location, severity and size of the damage can be determined in the scan-area. This algorithm is suitable for area spanning defects and is more sensitive to larger defects. The application of this method is shown in Fig. 12, where milled area damage is clearly visible by wave rich area when filtered around wavenumber 190.

Fig. 12 (a) Aluminum plate with milled area

damage; Wavefield images after filtering in

wavenumbers 130, 150 and 190: (b)

damage region shows discontinuity in

wavefront (c) undisturbed wavefield present

over total scan area (d) wavefield visible

only in damage location

(8)

4. Conclusion

In this paper, development and advancement in damage visualization algorithm using laser generated ultrasonic propagation system is presented. These algorithms provide temporal reference free damage assessment imaging capability thus is easy to operate for any users with no prior theoretical knowledge. The imaging capability also provides detailed information about the severity and location of the damages. These algorithms are successfully implemented on complex metal and composite specimen and can be applied to onsite non destructive evaluation(NDE), structural health monitoring(SHM) and in-process quality control (IPQC) of various structures. Together these algorithms provide an effective inspection capability for defects of any size and orientation.

References

[1] I. Chilibon, "Intelligent piezoceramic sensor for NDT applications," First International Conference on Sensor Device Technologies and Applications (2010) [2] R. Ribichini, F. Cegla, P. B. Nagy and P.

Cawley, "Experimental and numerical evaluation of electromagnetic acoustic transducer performance on steel materials,"

NDT&E International, Vol. 45, pp. 32-38 (2012)

[3] S. Thomas, S. Obayya, D. Pinto and D.

Dulay, W. Balachandran and M. Darwish,

"Time domain analysis of ultrasonic wave propagation using an electromagnetic acoustic transducer," Sensors & Transducers Journal, Vol. 108, No. 9, pp. 102-115 (2009) [4] D. A. Sofge and P. F. Lichtenwalner,

"Local area damage detection in composite structures using piezoelectric transducers,"

Proceedings SPIE Symposium on Smart

Structures and Materials, Vol. 3326 (1998) [5] T. E. Michaels, M. Ruzzene and J. E.

Michaels, "Incident wave removal through frequency wavenumber filtering of full wavefield data," Review of Quantitative Nondestructive Evaluation, Vol .28, pp.

604-611 (2009)

[6] J. O. Strycek and H. P. Loertscher, "High speed large area scanning using air- coupled ultrasound," ROMA 2000 15

th

WCNDT.

[7] F. Breaban, V. Carlescu, D. Olaru, G. H.

Prisacaru and J. Coutte, "Laser scanning vibrometry applied to non-destructive testing of electro-active polymers," U.P.B. Sci. Bull., Vol. 73, No. 2, pp. 1454-2358 (2011) [8] J. R. Lee, N. Sunuwar and C. Y. Park,

"Comparative analysis of laser ultrasonic propagation imaging system with capacitance and piezoelectric air-coupled transducers," Journal of Intelligent Material Systems and Structures. Mar 4, 2013. DOI: 10.1177/1045389X13481253 [9] D. Dhital, J. R. Lee, "A fully non-contact

ultrasonic propagation imaging system for closed surface crack evaluation," Experi- mental Mechanics, Vol. 52, No. 8, pp.

1111-1122 (2012)

[10] C. C. Chia, J. R. Lee and H. J. Shin,

"Hot target inspection using a welded fibre acoustic wave piezoelectric sensor and a laser-ultrasonic mirror scanner,"

Measurement Science and Technology, Vol.

20, No. 12 (2009)

[11] C. C. Chia, J. R. Lee and C. Y. Park,

"Radome health management based on synthesized impact detection, laser ultra- sonic spectral imaging, and wavelet- transformed ultrasonic propagation imaging methods," Composites: Part B, Vol. 43, pp. 2898-2906 (2012)

[12] J. R. Lee, C. C. Chia, H. J. Shin, C. Y.

Park and D. J. Yoon, "Laser ultrasonic

(9)

propagation imaging method in the frequency domain based on wavelet transformation," Optics and Lasers in Engineering, Vol. 49, pp. 167-175 (2011) [13] J. R. Lee, C. C. Chia, H. J. Shin, C. Y.

Park and H. M. Jeong, "Laser ultrasonic anomalous wave propagation imaging method with adjacent wave subtraction:

algorithm," Opt. Laser Technol., Vol. 44, No. 5, pp. 1507-1515 (2011)

[14] C. C. Chia, J. R. Lee, C. Y. Park, H. M.

Jeong, "Laser ultrasonic anomalous wave propagation imaging method with adjacent wave subtraction: Application to actual damages in composite wing," Opt Laser

Technol, Vol. 44, No. 2, pp. 428-440 (2012)

[15] J. R. Lee, S. Y. Chong, H. M. Jeong and C. W. Kong, "A time-of-flight mapping method for laser ultrasound guided in a pipe and its application to wall thinning visualization," NDT&E International, Vol.

44, No. 8, pp. 680-691 (2011)

[16] S. Y. Chong, J. R. Lee and C. Y. Park,

"Statistical threshold determination method through noise map generation for two dimensional amplitude and time-of-flight mapping of guided waves," Journal of Sound and Vibration, Vol. 332, No. 5, pp.

1252-1264 (2013)

수치

Fig. 3 Experimental setup for contact and non- non-contact sensing system
Fig. 6 Algorithm for frequency-selectable WUPI: (a) WT of ultrasonic wave; (b) transformed signals of one vertical scan path on one spreadsheet; and (c) slice along time axis for WUPI movie freeze-frames
Fig. 9 Statistical damage threshold establishment:
Fig. 11 (a) Stainless steel pipe with wall-thinning (b) time of flight (TOF) map for wall-thinned pipe (c) amplitude map before median filtering (d) amplitude map after median filtering
+2

참조

관련 문서