Comparative Study of Linear and Nonlinear Ultrasonic Techniques for Evaluation Thermal Damage of Tube-Like Structures
Weibin Li*, Younho Cho* and Xianqiang Li*
Abstract Ultrasonic guided wave techniques have been widely used for long range nondestructive detection in tube-like structures. The present paper investigates the ultrasonic linear and nonlinear parameters for evaluating the thermal damage in aluminum pipe. Specimens were subjected to thermal loading. Flexible polyvinylidene fluoride (PVDF) comb transducers were used to generate and receive the ultrasonic waves. The second harmonic wave generation technique was used to check the material nonlinearity change after different heat loadings. The conventional linear ultrasonic approach based on attenuation was also used to evaluate the thermal damages in specimens. The results show that the proposed experimental setup is viable to assess the thermal damage in an aluminum pipe. The ultrasonic nonlinear parameter is a promising candidate for the prediction of micro-damages in a tube-like structure.
Keywords: PVDF Transducer, Thermal Damage, Nonlinear Parameter, Attenuation
[Received: November 9, 2012, Revised: December 27, 2012, Accepted: December 31, 2012] *School of Mechanical Engineering, Pusan National University, Busan 609-735, Korea Corresponding Author: [email protected]
2013, Korean Society for Nondestructive Testing
1. Introduction
Tube-like structures have been widely used in the oil, gas, and petro-chemical industry. In these industries, structures are usually subjected to thermal loading frequently. In metallic materials, the micro-structure gradually changes under the effect of the external environment [1].
Thermal loading is an in-service condition for structural components. The general defects caused by thermal loading include creep, corrosion, efflorescence, ect. Therefore, a nondestructive approach to accurately evaluate thermal damage in tube-like structures is essential.
The ultrasonic guided wave technique is one of the most widely used nondestructive evaluation (NDE) methods. It can propagate over considerable distances without point-by-point scanning and the wave propagation interacts throughout the entire thickness of the structure, which means that it can find both surface and internal defects. Low energy consumption and great cost-effectiveness are features of the guided
wave-based damage detection approach [4,5].
Most conventional guided NDE methods that the use of linear ultrasonic characteristics are primarily used to evaluate the properties of the material. The nonlinear ultrasonic technique based on the nonlinear ultrasonic behaviors such as nonlinear resonance, mixed frequency response, sub-harmonic generation, or higher- harmonic generation, has been studied as a promising method to overcome the limitation [2,3].
However, according to the previous work, a number of investigators have applied nonlinear ultrasonic techniques to detect micro-damages in different metallic alloys of plate structure, while there have been only few works reported on nonlinear ultrasonic research on the tube-like structures.
The objective of this paper is to evaluate the
thermal damage by linear and nonlinear
ultrasonic techniques. Measurements of variation
of attenuation, and normalized second harmonic
amplitude wave carried out to check the damage
status in the specimens.
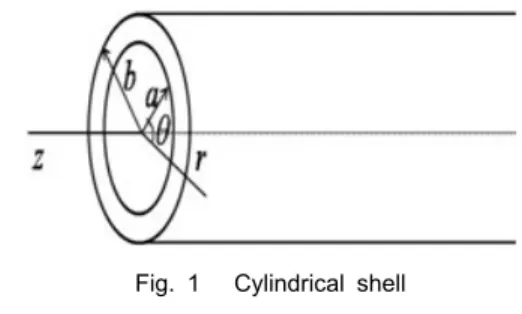
Fig. 1 Cylindrical shell
2. Fundamental Theory
This problem of circumferential wave propagation was studied by Viktorov
(1967)and Qu, Berthelot, and Li (1996). Consider time-harmonic
waves propagating in the
direction in the plane. The axial direction z is perpendicular to the cylinder cross-section and the elastic field does not depend on the coordinate z. The equation of motion can be obtained from the governing Navier wave equations in cylindrical coordinates, as show in Fig. 1.
2.1 Linear Ultrasonic Test
The present paper also considers linear ultrasonic wave techniques used in specimens under different thermal loadings to detect damage to compare the sensitivity of linear and nonlinear acoustic parameters to thermal damage in velocity of the same longitudinal mode.
The amplitude decay is assumed to be mainly affected by attenuation. The attenuation is an important characteristic of guided wave propagation [6,7]. It refers to the reduction in the signal strength after a wave travels some distance. The wave attenuation is defined by an attenuation coefficient. In this work, a con- ventional guided wave pulse-echo setup is used to measure the attenuation factor by comparing the two amplitudes of a given mode captured at the two corresponding traveling distances. The attenuation is denoted by
. It uniquely defines
the decrease of wave amplitude depending on frequency and mode as follows,
(1)
where
and
are the amplitudes of a wave mode signal obtained at the two corresponding propagation distances
and
respectively.
In general, a guided wave propagates as a wave packet containing a number of neighboring frequency components around the center frequency; the speed of the wave packet is called the group velocity. It also defines the velocity of energy carried by the wave packet.
In this paper, the experimental group velocity of a guided wave can be easily verified by comparing the time difference in an oscilloscope between the two different receiver positions over a give span with the theoretically predicted value, which is calculated via numerical differentiation from the phase velocity dispersion curve. The guided wave's group velocity essentially varies with the change of material properties. As a wave travels across a damaged area of reduced stiffness, the group velocity will be affected.
2.2 Nonlinear Ultrasonic Test
The method to detect nonlinearity is to launch an ultrasonic guided wave of a given frequency into the specimen, and receive the signal after a certain propagation distance. Due to the material nonlinearity, after propagation over a certain distance, the fundamental frequency wave will distort and generate higher harmonics [8-11].
For a guided wave, acoustic nonlinearity could be written analogously as
, (2)
Table 1 Various temperatures of heat loading
Material Melting point ( ) Reply temperature ( ) Recrystallization temperature ( )
Recrystallization annealing temperature ( )
Al 660 0~150 150~250 350~420
where
is the wave propagation distance and
is a frequency independent function. In addition, in experimental work, the ratio
, defined as the relative acoustic nonlinear parameter
′, is considered as a measure of acoustic nonlinearity, where
and
are the measured amplitudes of the fundamental and second harmonic waves.
′
∝
, (3)
The relative acoustic nonlinear parameter increase linearly as a function of propagation distance.
The cumulative effect of the second harmonic amplitude is a great advantage for detection in experimental work. It is found that second harmonic amplitude linearly grows with propagation direction, when synchronism and nonzero power flux. If the wave mode chosen satisfies these two conditions, the second harmonic amplitude will be cumulative. Even a series of double frequency wave components will be generated by the driving sources of nonlinearity. In practice, interest is focused on the second harmonic generation with the cumulative effect, since the cumulative second harmonic wave play a dominant role after second harmonics propagating some distance.
The wave attenuation is defined by an attenuation coefficient. In this work, both the attenuation factors of fundamental wave and second harmonic were tested. The value of attenuation coefficients were used to modify the amplitude of fundamental and second harmonic wave amplitude inversely, thus, this method can minimize the influence of material attenuation
on relative nonlinear parameters.
3. Specimen and Experimental Setup
3.1 Experimental Specimen
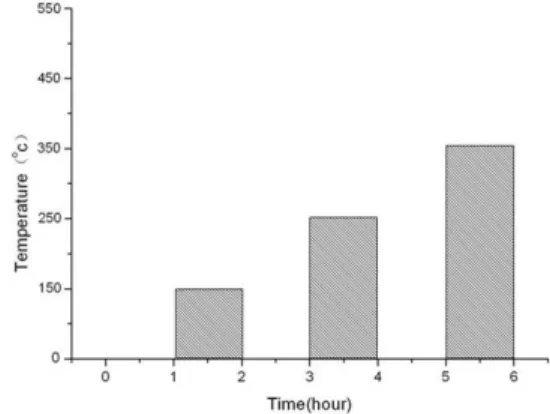
The experiment specimen is the Al-6063 pipe, a complex material with outer diameter 20 mm, inner diameter 14 mm, length 323 mm, and thickness 3 mm (Fig. 2.). Table 1 shows the Aluminum melting point, recrystallization annealing temperature. As shown in Fig. 2, the specimen was loaded for one hour each at 15℃
0℃, 250℃, 350℃.
Fig. 2 Heat loading time and temperature
3.2 Experimental Setup
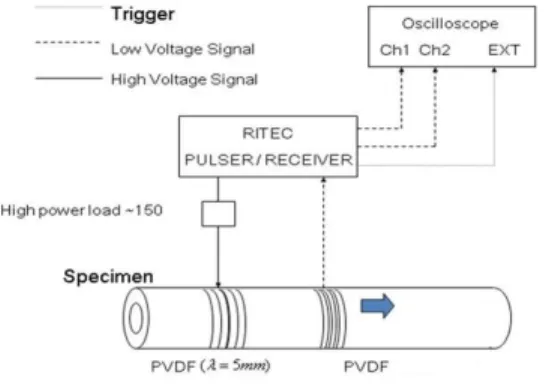
Fig. 3 shows a schematic of the experi-
mental setup. The source signal for guided wave
generation is a high power function generator
(RITEC advanced measurement system RPR-
4000). The generated waveform is a sinusoidal
tone burst with 7 cycles at a central frequency
of 1.68 MHz, The input frequency is tuned at
1.68 MHz, while the central frequency of
(a) Without heat loading (b) With heat loading 150oC
(c) With heat loading 250 oC(d) With heat loading 350 oC Fig. 5 Micro-structural pictures of specimens under
different heat treatments
receiver is 3.36 MHz to obtain the corres- ponding second harmonic frequency components.
Flexible polyvinyl-done fluoride (PVDF) comb transducers, which have specific-width electro fingers to control the generated wave length, are coupled to the pipe specimen using an ultrasonic couplant. Fixed pressure is applied on the PVDF transducers to make the couplant thickness consistent.
Fig. 3 Schematic of experimental setup
Fig. 4 Numerical dispersion curve of longitudinal mode in the specimen
In dispersion curves Fig. 4, the mode pair (L(0,6), L(0,10)) is selected in this work. The mode pair satisfies the phase matching condition; the primary wave mode has the same wave velocity as the secondary mode. The mode pair(L(0,6), L(0,10)) at fd = 5.05 MHz·mm, fd = 10.1 MHz·mm with the equal phase velocity of 8.2 km/s. Therefor the generated fundamental frequency is 1.68 MHz, and wave length is 5 mm.
4. Result and Discussion
4.1 Microstructure
Heat treatment can change the physical and mechanical properties of a material when a material is heated to reply, recrystallization, annealing temperatures. Pictures of microstructural changes of the specimen were obtained by optical microscope as shown in Fig. 5. Variations have been found in a specimen under different heat loading temperatures. However, the micro- structural pictures are insufficient to determine out which heat treated specimen is worse.
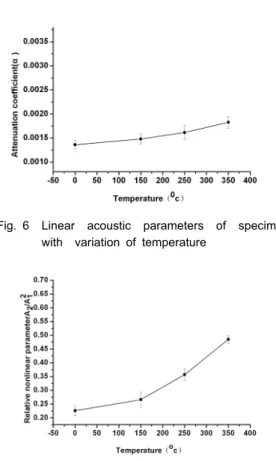
Variations of linear and nonlinear ultrasonic
features are tested in different specimens as
shown in Fig. 6 and 7. Both the linear and
nonlinear acoustic parameters are increase,
Fig. 6 Linear acoustic parameters of specimen with variation of temperature
Fig. 7 Nonlinear acoustic parameters of specimen with variation of temperature