1. INTRODUCTION
Solar power is one of the efficient energy sour- ces that is captured from the sun using solar panels. South Korea is an active investor in solar panel installations, which ranks them in the top ten markets of solar energy in the world[1]. South Korea contributed significantly to 3.1 GW (giga- watt) power in 2019[1]. With the increasing inter- est in solar power[2], it is a challenge to use its
full potential. The power output of solar panels highly depends on environmental situations like weather and air pollution. Due to bad weather or air pollution, it is difficult for solar panels to operate at their full potential. Thus, knowing the power output of solar panels in advance could help cor- rectly set up the solar panels and make sure that these panels operate at their full potential.
In this paper, we argue that the environmental situation is important to consider for producing
Predicting the Power Output of Solar Panels based on Weather and Air Pollution Features
using Machine Learning
Tserenpurev Chuluunsaikhan†, Aziz Nasridinov††, Woo Seok Choi†††, Da Bin Choi††††, Sang Hyun Choi†††††, Young Myoung Kim††††††
ABSTRACT
The power output of solar panels highly depends on environmental situations like weather and air pollution. Due to bad weather or air pollution, it is difficult for solar panels to operate at their full potential.
Knowing the power output of solar panels in advance helps set up the solar panels correctly and work their possible potential. This paper presents an approach to predict the power output of solar panels based on weather and air pollution features using machine learning methods. We create machine learning models with three kinds set of features, such as weather, air pollution, and weather and air pollution. Our datasets are collected from the area of Seoul, South Korea, between 2017 and 2019. The experimental results show that the weather and air pollution features can be efficient factors to predict the power output of solar panels.
Key words: Solar Panel Power, Machine Learning, Solar Panel and Weather, Solar Panel and Air Pollution.
※ Corresponding Author : Sanghyun Choi, Aziz Nasri- dinov, Address: (28644) 1 Chungdae-ro, Seowon-gu, Cheongju, South Korea, TEL : +82-43-261-3742, +82-43- 10-261-3597, FAX : +82-43-10-261-2265, E-mail : chois@
chungbuk.ac.kr, [email protected] Receipt date : Jan. 10, 2021
Approval date : Jan. 28, 2021
†††Dept. of Computer Science, Chungbuk National University (E-mail : [email protected])
†††Dept. of Computer Science, Chungbuk National University (Email: [email protected])
†††Dept. of Bigdata, Chungbuk National University (E-mail : [email protected])
††††††Dept. of Management Information Systems, Chungbuk National University
(E-mail : [email protected])
††††††Dept. of MIS. Dept. of Bigdata, Chungbuk National University (Email: [email protected])
††††††BC Card Co., LTD
(E-mail : [email protected])
※ This research was sponsored by DAEYEON Control
& Instruments Co.,LTD. (2020-2020092374). We would like to thank DAEYEON Control & Instruments Co.,LTD for data collection.
power using solar panels. It is obvious that solar panels can operate at their full potential when the sun shines and there is no partial shading on them.
However, the partial shading might occur due to temporary effects, such as weather (e.g., clouds or rain) and air pollution (e.g., fine dust). This paper presents an approach to predict the power output of solar panels based on weather and air pollution features using machine learning methods. We aim to reveal the best combination of environmental features and machine learning methods. We collect datasets between 2017 and 2019 from Seoul area, South Korea.
This paper builds power output prediction mod- els using the state-of-art machine learning models, such as Linear Regression, K-Nearest Neighbors (kNN), Support Vector Regression (SVR), Multi- Layer Perceptron (MLP), Random Forest Regres- sor (RF), and Gradient Boosting Regressor (GB).
Each model uses three sets of features. The first set includes weather features, such as humidity, sunshine, solar radiation, and clouds. The second set consists of air pollution features, which include Ozone (O), Sulfurous Acid Gas (SO), Nitrogen Dioxide (NO), Carbon Monoxide (CO), Fine Dust (PM), and Fine Particulate Matter (PM).
Finally, the third set is created by choosing top correlated features from the other two sets. We evaluated the models using popular error rate methods, such as Mean Absolute Error (MAE), Coefficient of Determination (R), and Root Mean Squared Error (RMSE). The experimental results show that the weather and air pollution features can be efficient factors to predict the power output of solar panels.
We organized the rest of this paper as follows.
Section 2 includes the brief descriptions of similar studies related to our paper. Section 3 describes the methodology of our paper. Section 4 explains the experimental works. Finally, Section 5 discusses the conclusion and determines future works.
2. RELATED STUDY
As we mentioned in Section 1, environmental situations like weather and air pollution are fea- tures that must be considered when predicting the power output of solar panels [2-9]. For example, several researchers proposed the prediction models to estimate the power output of solar panels using weather features[3-6]. Nageem et al.[3] proposed a multi-input support vector regression (SVR) model to predict the output of so called a grid-con- nected solar panel. The authors used weather fea- tures like humidity, temperature, pressure, and wind speed. The analytical and SVR models were compared in this paper, and the experiment results show that the SVR model had more accuracy than the analytical model. Saberian et al.[4] used artifi- cial neural networks (ANNs) to predict the output power of solar panels based on weather features like temperature and irradiance. The authors used a dataset of five years from 2006 to 2010. The ex- periments show that the proposed model achieves strong performance.
Besides, there are many approaches to predict the output power of solar panels using air pollution features[7-9]. Son et al.[7] studied the effect of particulate matter (PM) on solar power output over South Korea. The authors used the PM andPM
concentrations for the dataset from 2015 to 2017.
The authors mentioned that the PMs commonly reduce solar power output by more than 10%. Their results show that PM's negative impacts on solar panels should be considered in policymaking on target solar power output in South Korea. Bergin et al.[8] calculated the solar energy production re- duction due to dust and particulate air pollution.
The authors merged field measurements and global modeling to evaluate the influence of dust and PM on solar electricity generation. The result indicated that solar panel production was reduced by 17 - 25% due to PM on the surface of solar panels.
3. METHODOLOGY
3.1 Overview
Fig. 1 describes the overall flow of our method- ology. It consists of the following steps: data ac- quisition, feature extraction, model training, and prediction of power output. First, our experimental datasets are created from three different sources that were mentioned in Section 1. After that, we build machine learning models by selecting differ- ent sets of features. Here, we aim to reveal the best combination of features and machine learning methods. All steps are explained in the following subsections.
3.2 Datasets
There are three data sources, where we collect our experimental datasets. The power output data of solar panels are provided by a South Korean re- newable energy power output company called Daeyeon C&I. Further, the weather-related data is collected from South Korea Meteorological (KMA).
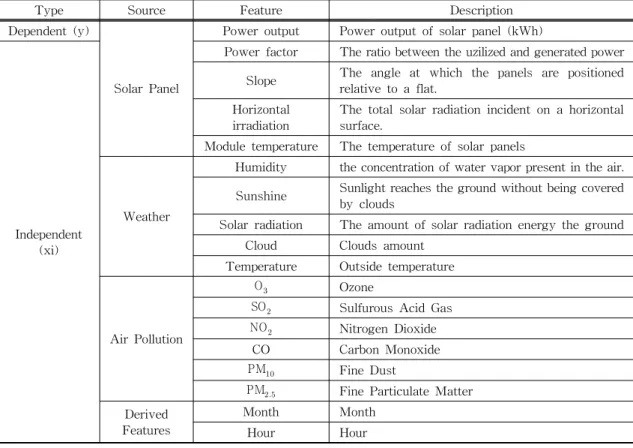
Lastly, we collected air pollution data from the Seoul Metropolitan Government (SMG). All data- sets are generated in the location of Seoul, South Korea. Table 1 shows the feature description of collected data. From the table, we can perceive that
the power output is our target feature. Other fea- tures are inputs to our models, and are divided into four sections like solar panel. weather, air pollution, and derived features. The derived features are generated from the date feature that power output is generated. We combined all datasets based on the date. The dataset contains 14191 observations from 2017 to 2019. We split the dataset by 80% and 20% as train and test, respectively. Our models predict next one hour power output.
3.3 Feature Extraction
After combining the separated datasets, the first step is to obtain the features appropriate to predict power output solar panels. First, we extend each set of features using derived features (month, hour), which are generated from date that the pow- er output is registered. Fig. 2 shows the relation- ship between power output of solar panel, month and hour. From the Fig. 2 (a), we can perceive that the power output of solar panels is produced more in April to June. We can assume that it is the time when there is a plenty of sunlight, and the level rainfall is low. On the contrary, Fig. 2(b) shows the power output of solar panels by hour. From 10 to 13 hours is the rush hour to generate power from solar panels.
Fig. 1. The overall flow of the methodology.
Further, we determine linear relationship be- tween two features using Pearson’s correlation.
The result of correlation between -1 and 1; here -1 represents a negative relation, 1 represents a positive relation. If a result is near to zero, it means there is no relation between features. Fig. 3 shows the correlation between power output and other
features. Based on the result showed in Fig. 3, we created five sets of features. First set is solar panel features, second set is weather features, and third set is air pollution features. Also, fourth set is cre- ated by selecting top correlated features among the previous three sets, and fifth set is created by in- cluding all features. In other words, we essembled Table 1. The feature description of datasets.
Type Source Feature Description
Dependent (y)
Solar Panel
Power output Power output of solar panel (kWh)
Independent (xi)
Power factor The ratio between the uzilized and generated power Slope The angle at which the panels are positioned
relative to a flat.
Horizontal
irradiation The total solar radiation incident on a horizontal surface.
Module temperature The temperature of solar panels
Weather
Humidity the concentration of water vapor present in the air.
Sunshine Sunlight reaches the ground without being covered by clouds
Solar radiation The amount of solar radiation energy the ground Cloud Clouds amount
Temperature Outside temperature
Air Pollution
O Ozone
SO Sulfurous Acid Gas NO Nitrogen Dioxide
CO Carbon Monoxide
PM Fine Dust
PM Fine Particulate Matter Derived
Features
Month Month
Hour Hour
(a) Power outputs of solar panels by month. (b) Power outputs of solar panels by hour.
Fig. 2. Correlation between power output and derived features.
solar panel features (i.e., month, hour, power factor, slope, horizontal irradiation, module temperature), weather features (i.e., month, hour, humidity, sun- shine, solar radiation, clouds, temperature), air pol- lution features (i.e., month, hour, OSONOCOPMPM), top correlated features (i.e., power factor, slope, horizontal irradiation, module temperature, sunshine, solar radiation), and all features.
3.3 Machine Learning Models
This paper builds power output prediction mod- els using state-of-art machine learning models, such as Linear Regression, SVR, MLP, kNN, RF, GB. All models are written in Python and are cre- ated using Scikit-learn library[10]. Linear re- gression is one of the well-known statistical and machine learning algorithms. Linear regression calculates output variable (y) by input variables (x) using least-squares to fit a line to the data points.
SVR is a regression version of Support Vector Machines (SVM), which is like Linear Regression in defining the hyperplane in data points. The dif- ference is that SVR uses a threshold to minimize the error between actual and forecasted values.
MLP is a field of feedforward artificial neural net- works, consists of an input, hidden,
and output layers. The hidden and output layers are neurons that use a nonlinear activation function. kNN regression is a machine learning method that predicts value by averaging the ob- servations in the same neighbor. Choosing an ap- propriate number of neighbors is the main object of the kNN method. Random Forest (RF) is one of popular supervised machine learning algorithms for classification and regression. RF can work well with a dataset that has a large number of features.
In addition, it indicates the importance of variables.
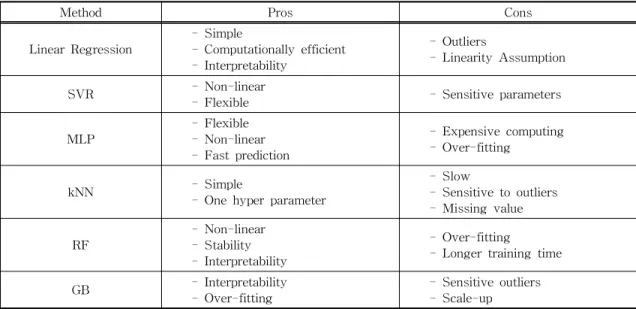
However, RF is not well adapted for categorical data. Gradient Boosting (GB) is a powerful algo- rithm in the area of classification and regression problems. Here, boosting combines multiple simple models into a single complex model. Therefore, GB uses the decision tree as a single model. Table 2 compares the pros and cons of selected machine learning methods.
4. EXPERIMENTAL RESULTS
4.1 Metrics of Evaluation
To evaluate the performance of models, we compared the actual power output of solar panels with the predicted power outputs according to cer- tain error rate methods. Specifically, we use R, RMSE and MAE. RMSE is the standard deviation Fig. 3. Pearson’s correlation between power output and other features.
of the prediction errors. MAE calculates the aver- age of differences between the actual value and predicted value. The lower values indicate better accuracy in the RMSE and MAE. R is also a re- gression score method. Best R score is 1 and it can be negative value, which expresses worser accuracy. We multiply the R score to represent it by percentage. R, RMSE, MAE are given in Equations (1)–(3), respectively. Here, repre- sents the number of samples, represents an ac- tual value, represents a predicted value, repre- sents the mean of actual values.
(1)
RMSE N
i N yi yi (2)
(3)
4.2 Results
To evaluate the performance of models, Finding the correct values of hyperparameters is an im-
portant step to build an efficient model, especially for a parameter sensitive algorithm like SVR. We performed each model with several combinations of hyperparameter values to find out the best option. Table 3 shows the values of the hyper- parameters of each model.
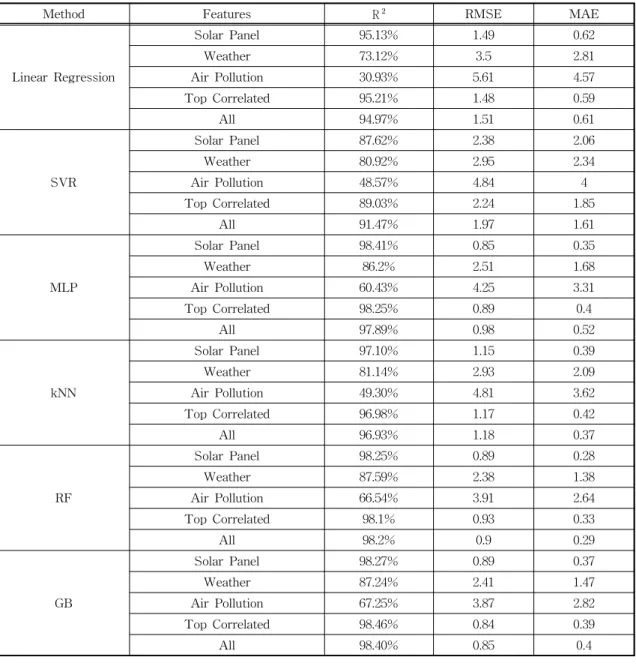
Table 4 describes detailed results of all models and sets of features. From the table, we can see that RF, GB, and MLP shows better accuracy than kNN, SVR, and Linear Regression. Also, solar panel and weather features are more efficient than air pollution features. Solar panel features show best performances with all models because slope Table 2. The pros and cons of machine learning methods.
Method Pros Cons
Linear Regression - Simple
- Computationally efficient - Interpretability
- Outliers
- Linearity Assumption
SVR - Non-linear
- Flexible - Sensitive parameters
MLP - Flexible
- Non-linear - Fast prediction
- Expensive computing - Over-fitting
kNN - Simple
- One hyper parameter
- Slow
- Sensitive to outliers - Missing value
RF - Non-linear
- Stability - Interpretability
- Over-fitting
- Longer training time
GB - Interpretability
- Over-fitting - Sensitive outliers
- Scale-up
Table 3. The parameter settings of machine learning models.
Method Parameter Value
SVR C 200
epsilon 5
MLP epsilon 1e-8
max_iter 500
kNN k 15
RF n_estimators 15
max_depth 10
GB learning_rate 0.1
n_estimators 100
and horizontal irradiations are highly correlated with power output of solar panels. On the contrary, there are no significant differences between weather features and top-correlated features. It means that weather features are appropriate enough to predict the power output of solar panels.
But air pollution features show good accuracy with RF and GB, with around 67% of R^2. RF is the most appropriate model that shows best accuracy
with all sets of features. The best R, RMSE, MAE of RF are 98.25%, 0.89, and 0.28, respectively. The range power output of solar panels is 0 to 25.
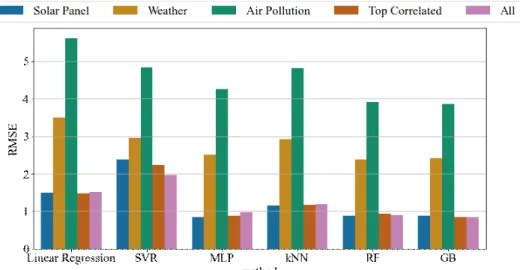
Fig. 4 shows the RMSE of all models with three sets of features to show the accuracy difference of each model. The results of RF, GB, MLP are alike to each other, and kNN, SVR, and Linear Regression results are similar. RF and GB have the best accuracy and there are no big differences be- Table 4. The result of machine learning models.
Method Features R RMSE MAE
Linear Regression
Solar Panel 95.13% 1.49 0.62
Weather 73.12% 3.5 2.81
Air Pollution 30.93% 5.61 4.57
Top Correlated 95.21% 1.48 0.59
All 94.97% 1.51 0.61
SVR
Solar Panel 87.62% 2.38 2.06
Weather 80.92% 2.95 2.34
Air Pollution 48.57% 4.84 4
Top Correlated 89.03% 2.24 1.85
All 91.47% 1.97 1.61
MLP
Solar Panel 98.41% 0.85 0.35
Weather 86.2% 2.51 1.68
Air Pollution 60.43% 4.25 3.31
Top Correlated 98.25% 0.89 0.4
All 97.89% 0.98 0.52
kNN
Solar Panel 97.10% 1.15 0.39
Weather 81.14% 2.93 2.09
Air Pollution 49.30% 4.81 3.62
Top Correlated 96.98% 1.17 0.42
All 96.93% 1.18 0.37
RF
Solar Panel 98.25% 0.89 0.28
Weather 87.59% 2.38 1.38
Air Pollution 66.54% 3.91 2.64
Top Correlated 98.1% 0.93 0.33
All 98.2% 0.9 0.29
GB
Solar Panel 98.27% 0.89 0.37
Weather 87.24% 2.41 1.47
Air Pollution 67.25% 3.87 2.82
Top Correlated 98.46% 0.84 0.39
All 98.40% 0.85 0.4
tween them. The result of RF model is around 0.8%
lower than GB model, 42.6% lower than Linear Regression, 27.9% lower than SVR, 6.6% lower than MLP, and 11.9% lower than kNN models.
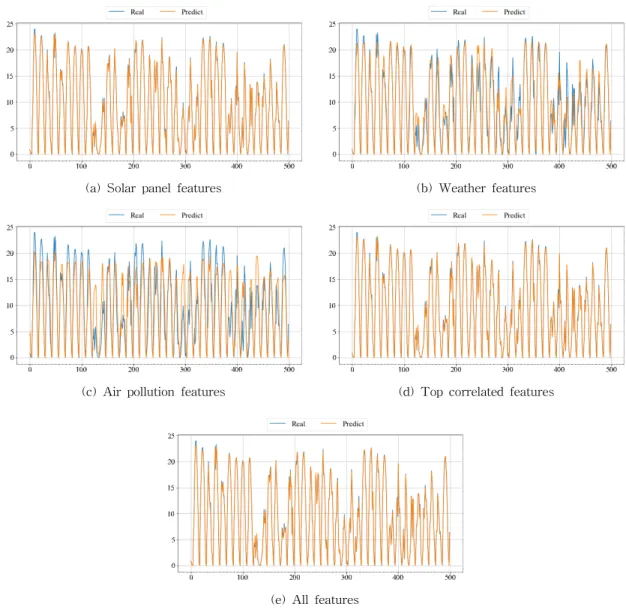
Fig. 5 displays the power output prediction of solar panels with (a) solar panel features, (b) weather features, (c) air pollution features, (d) top correlated features, and (e) all features. The power output prediction of solar panels is the result of the RF model because the RF model has the best accu- racy than other machine learning models. Here, the blue line represents real value, and the yellow line represents predicted value. The figure demon- strates how the predicted values follows the real values. Similar to the above explanations of ex- periments in Table 4 and Fig. 4, the predictions of weather features show similar values to real values than air pollution features.
5. CONCLUSION
This paper have proposed to predict the power output of solar panels based on weather and air pollution features. Here, five sets (i.e., solar panel, weather, air pollution, top correlated, all features) of features have been experimented using six kinds of machine learning methods, such as Linear
Regression, SVR, MLP, kNN, RF, and GB. We demonstrated that solar panel features have ach- ieved best accuracy of around 95% in all models.
Weather and top correlated features have shown shown the similar good results. However, we have also learned that the air pollution features did not show the good results compared to two other experiments. Lastly, we have created the best model in the the form of RF model with around 98% accuracy.
Our paper aims to reveal appropriate features to predict the power output of solar panels. Solar pan- els can gather energy well when the sunlight re- flects on the solar panels without any obstacle.
However, there are many times when the sunlight cannot reflect directly on the solar panels due to environmental situations like weather or air pollu- tion. Thus, the correct placement of solar panels is also depended on these environmental situations.
Also, solar panel users can know the time to clean solar panels based on power output prediction. For example, the prediction system can notify users that the solar panels will produce power less in the future. Because the solar panels can be covered with snow, rain, or air pollution elements. In gen- eral, predicting the power output of solar panels in advance can bring various benefits, including ad- Fig. 4 RMSE of machine learning methods.
justing installation, monitoring operation, and planning the business strategies in the future.
Furthermore, we can add more environmental features like wind, temperature, and others to in- crease the accuracy of models. Also, due to irregu- lar solar panels operation, there can be possibility of outliers in the power output data
points. Thus, we can consider removing out- liers that may help further increase the accuracy of prediction. Finally, deep learning models like LSTM can be applied in the future to increase the
accuracy of power output prediction even further.
REFERENCE
[ 1 ] International Energy Agency, P hotovoltaic Power Systems Program: Snapshot of Global PV Markets 2020, Report IEA-PVPS T1- 37, 2020.
[ 2 ] J. Ko and H. Kim, “Implementing the Smart System for the Safety of the Elderly and the Weak - Focus on Energy Harvest -,”Journal
(a) Solar panel features (b) Weather features
(c) Air pollution features (d) Top correlated features
(e) All features
Fig. 5. The power output of solar panels prediction. The result of RF Model.
of Korea Multimedia Society, Vol. 23, No. 12, pp. 1507-1518, 2020.
[ 3 ] R. Nageem and R. Jayabarathi, “Predicting the Power Output of a Grid-Connected Solar Panel Using Multi-Input Support Vector Regres- sion,” P rocedia Computer Science, Vol. 115, pp. 723-730, 2017.
[ 4 ] A. Saberian, H. Hizam, M.A.M. Radzi, M.Z.A.A.
Kadir and M. Mirzaei, “Modelling and Predic- tion of Photovoltaic Power Output Using Artificial Neural Networks,” International J ournal of P hotoenergy, Vol. 2014, article.
469701, 2014.
[ 5 ] S.G. Kim, J.Y. Jung, and M.K. Sim, “A Two- Step Approach to Solar Power Generation Prediction Based on Weather Data Using Machine Learning,” Sustainability, Vol. 11, article. 1501, 2019.
[ 6 ] N. Sharma, P. Sharma, D. Irwin, and P. Shenoy,
“Predicting Solar Generation from Weather Forecasts Using Machine Learning,” IEEE International Conference on Smart Grid Com- munications (SmartGridComm), Brussels, Bel- gium, 2011.
[ 7 ] J. Son, S. Jeong, H. Park, and C. Park, “The Effect of Particulate Matter on Solar Photo- voltaic Power Generation over the Republic of Korea,”Environmental Research Letters, Vol.
15, No. 8, 2020.
[ 8 ] M.H. Bergin, C. Ghoroi, D. Dixit, J.J. Schauer and D.T. Shindell, “Large Reductions in Solar Energy Production Due to Dust and Particu- late Air Pollution,” Environmental Science &
Technology Letters, Vol. 4, No. 8, pp. 339-344, 2017.
[ 9 ] M. Vakili, S.R. Sabbagh-Yazdi, K. Kalhor, and C. Khosrojerdi, “Using Artificial Neural Networks for Prediction of Global Solar Radiation in Tehran Considering Particulate Matter Air Pollution,”Energy Procedia, Vol.
74, pp. 1205-1212, 2015.
[10] F. Pedregosa, G. Varoquaux, A. Gramfort, V.
Michel, B. Thirion, O. Grisel, M. Blondel, P.
Prettenhofer, R. Weiss, V. Dubourg, M. Perrot and E. Duchesnay, “Scikit-learn: Machine Learning in Python,” J ournal of Machine Learning Research, Vol. 12, pp. 2825-2830, 2011.
Tserenpurev Chuluunsaikhan 2009.09∼2013.06: B.S., Computer Science, Mongolian University of Science and Technology.
2018.09∼2020.08: M.S., Computer Science, CBNU.
2020.09∼Now: Ph.D. student, Computer Science, CBNU.
Research interests: Big Data Processing, Machine Learning.
Woo Seok Choi
2019.02: B.BA, Department of Management Information Systems, CBNU.
2019.03∼Now: M.S. student, Department of Bigdata, CBNU.
Research interests: Data mining
Sang Hyun Choi
1991.02: B.S., Department of Industrial Engineering, Hanyang University.
1193.08: M.S., Department of Industrial Engineering, KAIST..
1998.02: Ph.D., Department of Management Information Engineering, KAIST.
2011.09∼Now: Professor, Department of Management Information Systems, CBNU.
Research interests: Decision support system, data mining.
Aziz Nasridinov 2002.09∼2006.08: B.S., Department of Information Technologies, Tashkent University of Information Technologies.
2007.03∼2009.8: M.Sc., Department of Computer Science, Dongguk University.
2009.09∼2012.08: Ph.D., Department of Computer Science, Dongguk University.
2012.09∼2014.02: Postdoctoral Researcher, Department of Multimedia, Sookmyung Women's University.
2014.03∼2015.07: Assistant professor, Dongguk University.
2015.08∼Now: Associate Professor, CBNU.
Research interests: Databases, Big Data Analytics, Machine Learning
Da Bin Choi
2019.08: B.BA., Department of Management Information Systems, CBNU.
2019.09∼Now: M.S. student, Department of Management Information Systems, CBNU.
Research interests: Data mining
Young Myoung Kim 1987.02: B.S., Department of Industrial Engineering, Sungkyunkwan University.
1989.02: M.S., Department of Industrial Engineering, KAIST 2001.02: Ph.D., Department of Management Engineering, KAIST 1989.03∼2020.01: Managing Director, Energy Platform Business Division, KT Corp.
2020.02∼Now: Advisor, BC Card Co.,LTD Research interests: Technology management, ICT convergence