RESEARCH
Association between changes in economic
activity and catastrophic health expenditure:
findings from the Korea Health Panel Survey,
2014–2016
Hyeon Ji Lee
1,2, Doo Woong Lee
1,2, Dong‑Woo Choi
1,2, Sarah Soyeon Oh
2,3, Junhyun Kwon
1,2and Eun‑Cheol Park
2,4*Abstract
Background: The rate of catastrophic health expenditure (CHE) continues to rise in South Korea. This study exam‑ ined the association between changes in economic activity and CHE experiences in South Korea.
Methods: This study analyzed the Korea Health Panel Survey data using a logistic regression analysis to study the association between changes in economic activity in 2014–2015 and the participants’ CHE experiences in 2015. The study included a total of 12,454 individuals over the age of 19. The subgroup analyses were organized by sex, age, health‑related variables, and household level variables, and the reasons for leaving economic activity.
Results: Those who quit economic activities were more likely to experience CHE than those who continued to engage in economic activities (OR [odds ratio] = 2.10; 95% CI [confidence interval]: 1.31–3.36). The subgroup analysis results, according to health‑related variables, showed that there is a tendency to a higher Charlson comorbidity index, a higher OR, and, in groups that quit their economic activities, people with disabilities were more likely to experience CHE than people without disabilities (OR = 5.63; 95% CI 1.71–18.59, OR = 1.82; 95% CI 1.08–3.08, respectively). Another subgroup analysis found that if the reason for not participating in economic activity was a health‑related issue, the participant was more likely to experience CHE (active → inactive: OR = 2.40; 95% CI 0.61–9.43, inactive → inactive OR = 1.65; 95% CI 1.01–2.68).
Conclusions: Those individuals who became unemployed were more likely to experience CHE, especially if health problems precipitated the job loss. Therefore, efforts are needed to expand coverage for those people who suffer from high medical expenses.
Keywords: Catastrophic payment, Health expenditures, Economic status, Employment, South Korea
© The Author(s) 2020. This article is licensed under a Creative Commons Attribution 4.0 International License, which permits use, sharing, adaptation, distribution and reproduction in any medium or format, as long as you give appropriate credit to the original author(s) and the source, provide a link to the Creative Commons licence, and indicate if changes were made. The images or other third party material in this article are included in the article’s Creative Commons licence, unless indicated otherwise in a credit line to the material. If material is not included in the article’s Creative Commons licence and your intended use is not permitted by statutory regulation or exceeds the permitted use, you will need to obtain permission directly from the copyright holder. To view a copy of this licence, visit http://creat iveco mmons .org/licen ses/by/4.0/. The Creative Commons Public Domain Dedication waiver (http://creat iveco mmons .org/publi cdoma in/ zero/1.0/) applies to the data made available in this article, unless otherwise stated in a credit line to the data.
Background
Healthcare costs are always incurred according to eco-nomic principles. Therefore, patients may have to pay healthcare expenses in accordance with the national
healthcare reimbursement systems and can sometimes suffer from financial stress in addition to their illness, and may experience poverty due to having to pay their medi-cal expenses. The existence of patients substantially suf-fering from medical costs shows the insufficient health coverage of a country.
In 2018, the Organisation for Economic Co-operation and Development’s (OECD) average of the proportion of total healthcare spending financed by the public sector
Open Access
*Correspondence: ECPARK@yuhs.ac
2 Institute of Health Services Research, Yonsei University, 50 Yonsei‑ro, Seodaemun‑gu, Seoul 03722, Republic of Korea
was 73.8%, compared to 59.8% in South Korea, which is second-lowest among the OECD countries (the maxi-mum is 85.5% in Norway, and the minimaxi-mum 51.5% in Mexico) [1]. In the United States, the proportion of total healthcare spending financed by the public sector is the second-highest among the OECD countries at 14.3% [1], but medical bankruptcy is also a significant problem [2,
3]. South Korea is also not immune to the risk of medical bankruptcy. South Korea is a national health insurance system; however, underinsurance problems continue [4–
6]. In addition, South Korea risks increasing the number of people experiencing healthcare expense related dis-tress due to the increasing burden of out-of-pocket pay-ments [1], and the rate of catastrophic health expenditure (CHE) experience continues to rise [7].
Distress from medical costs needs to be considered on a narrower scale as well as on a national level. CHE is different from high-cost medical costs and closely corresponds to the economic capacity of households and individuals [8]. Even when individuals incur high medical costs, those with a sufficient capacity to buffer them can defend themselves against economic difficul-ties. However, individuals who cannot afford to pay will experience difficulties caused by healthcare expenses. In other words, CHE is a concept that considers the vary-ing healthcare expense burdens between individuals of different economic capacities. To define CHE, economic capacity can be defined in various ways, such as total income, total expenditure, and the poverty line. The share of healthcare expenses has also been presented in a vari-ety of ways, from 5 to 40% [9–12].
Numerous previous studies have explored CHE’s causes to prevent their occurrence. According to the results of these studies, demographic, health-related, and socio-economic factors, such as region of residence, income level, and economic activity, were identified as factors correlated with catastrophic health expenses [13–15]. Some studies also considered the variable factors that led to CHE occurrence [16, 17]. These studies looked at the relationship between a change in economic activity and CHE, and reported that economic inactivity was linked to CHE. However, these studies were conducted on select population groups, such as people with disabilities, peo-ple who have chronic diseases, or heads of households. Therefore, this study’s purpose was to examine the asso-ciation between changes in economic activity and CHE experience for the general population.
Methods
Data collection and study participants
This study analyzed data from the 9th to 11th wave (2014–2016) of the Korea Health Panel Survey (KHPS), which has been conducted annually since 2008 [18] by
the Korea Institute for Health and Social Affairs and the National Health Insurance Corporation. The surveyor visits the target household and conducts the interview using Computer Assisted Personal Interviewing meth-ods. They surveyed monthly household consumption expenditures and annual household income based on the previous year according to household ledgers, receipts, or self-reports. Additionally, annual household income was converted to an equalized household income value con-sidering the number of household members. Information on healthcare spending was collected retroactively on a yearly basis using household ledgers, receipts, and insur-ance usage information to prevent omissions or errors in recall due to the length of time between healthcare ser-vice use and the date of the investigation.
In addition, the state of economic activity is surveyed on the last day of the year. The dining out expenses needed to accurately calculate the CHE have been inves-tigated since 2014, and the most recent year when the information was released is 2016. Therefore, the 2014– 2016 KHPS data was used to analyze the experience of CHE in 2015 in accordance with changed economic activities from 2014–2015.
Of the 18,130 participants in 2015, 14,530 remained, with those under 19 years removed. Of these, one per-son was removed from the study population as the CHE could not be calculated, and other participants with-out information on the control variables were removed, bringing the total number to 13,709. Finally, a total of 12,454 participants were analyzed as after eliminating people whose economic activity was unknown in 2014 or 2015.
Catastrophic health expenditure experience
The dependent variable is the experience of CHE in 2015. The World Health Organization proposed methods for calculating CHE and defines CHE as a situation when medical expenses are more than 40% of one’s capac-ity to pay [10]. The method considered a household’s capacity to pay by subtracting essential food expendi-tures or household subsistence spending from the sum of household spending, and households were defined as experiencing CHE when household out-of-pocket pay-ment on medical expenses accounted for over 40% of the household capacity. If healthcare expenses accounted for more than 40% of the amount that could be spent, then the household was classified as the Yes group who experienced CHE. If household expenses were less than the criteria, then the household was classified as the No group that did not experience CHE. The items on house-hold consumption expenditure in the survey questioned the costs spent over the past year, so the 2016 survey used 2015 expenditure values. Healthcare expenses
were defined as expenses for hospitalizations, outpatient services, emergency services, and prescription drugs throughout 2015.
Changes in economic activity
The independent variable is the change in economic activity in 2014–2015. The status of economic activity was classified as yes if they worked for income purpose and; or no if they did not. As survey was conducted at the end of last year, asking whether the individual partici-pated in economic activity or not. The economic activity on December 31, 2014, surveyed in the 2015 survey, and the economic activity on December 31, 2015, surveyed in the 2016 survey, were categorized into the following four categories: active no change, inactive then active, active then inactive, or inactive no change.
Control variables
The control variables included individual and household level variables. The variables at the individual level are sex, age, marital status, education level, medical aid, dis-ability status, Charlson comorbidity index (CCI), unmet medical need, current smoking, and alcohol consumption statuses. The CCI was calculated according to the method defined in a previous study and sorted into three catego-ries: 0, 1, 2 + [19]. The variables at the household level are the region of residence, head of household, household income level, lagged household income level (i.e., house-hold income level in 2014), and lagged dependent vari-able (i.e., CHE experience in 2014). KHPS was surveyed by defining the person who represents the household as a householder, regardless of whether the residence was owned or their income. Based on the survey responses, the head of household was categorized into householder, otherwise non-householder. The household income level and lagged household income level were categorized using equalized income.
Supplementary analysis
A subgroup analysis of the association between depend-ent and independdepend-ent variables was performed accord-ing to sex, age, health-related variables (disability status, CCI, unmet medical needs), and household level vari-ables (region, head of household, household income level, lagged household income level, lagged dependent vari-able) among the covariates. Additionally, to analyze the association between the discontinuation of economic activity by subgroup analysis and the CHE, the inter-view questionnaire includes the question “Why are you economically inactive?”. The answers for reasons for not engaging in economic activities were categorized as fol-lows and considered as economically inactive factors: family-related factors (housekeeping, upbringing, and
care), health-related factors (inability to work, illness or health deterioration, and accidental damage), retirement, other (academic work, job preparation, military service, etc.), and voluntary selection (no will to work or no job search). A sensitivity analysis was also performed by changing the CHE criteria to not only 40%, but also 30%, 20%, and 10% to confirm the results [8, 12].
Statistical analysis
Using the Chi square test, this study examined the differ-ences between groups according to the independent vari-ables. A p value of < 0.05 was considered significant. A logistic regression analysis was performed to investigate the association between changes in economic activity and CHE with calculations expressed as odds ratio (OR) and 95% CI (confidence interval). We checked for multicol-linearity in the statistical model through tolerance, vari-ance inflation factors (VIFs), and collinearity diagnostics. In this model, the tolerance values were all under the 0.1 and VIFs were all less than 2.5, and the results of collin-earity diagnostics were acceptable; therefore, the results indicate no problem with the correlations between the dependent and independent variables [20]. All statistical analyses were performed using SAS statistical software package version 9.4. (SAS Institute Inc., Cary, NC, USA).
Results
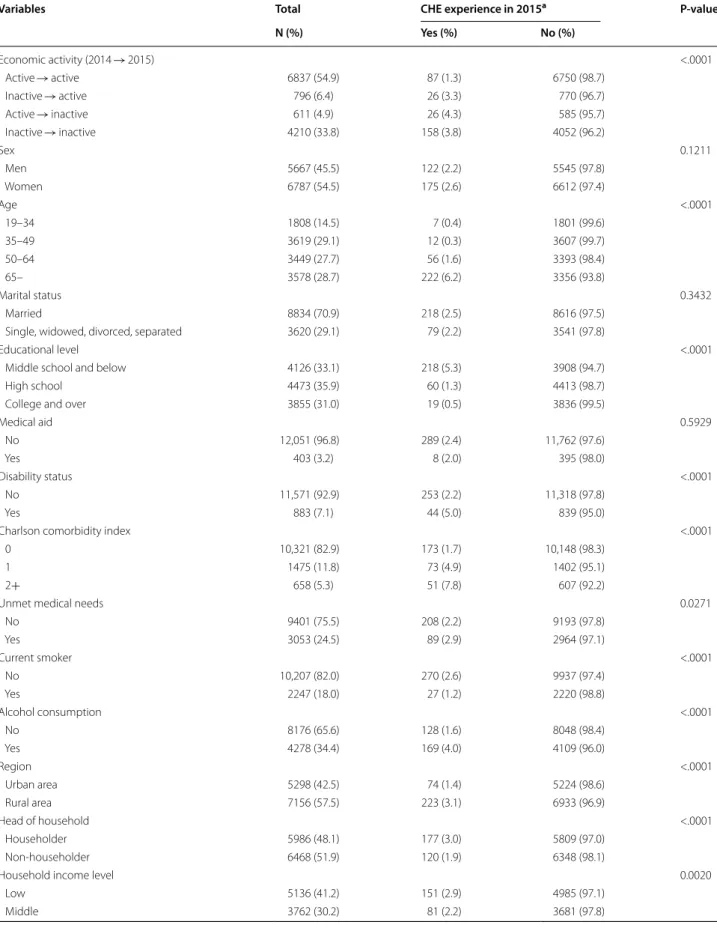
Table 1 shows the general characteristics of the study population. Of the 12,454 participants, 297 (2.4%) expe-rienced CHE, while 12,157 (97.6%) did not experience CHE in 2015. In terms of the change in economic activity, the percentage of participants with CHE was in the order of active then inactive (4.3%), inactive no change (3.8%), inactive then active (3.3%), and active no change (1.3%), and the result was statistically significant (p = <0.0001).
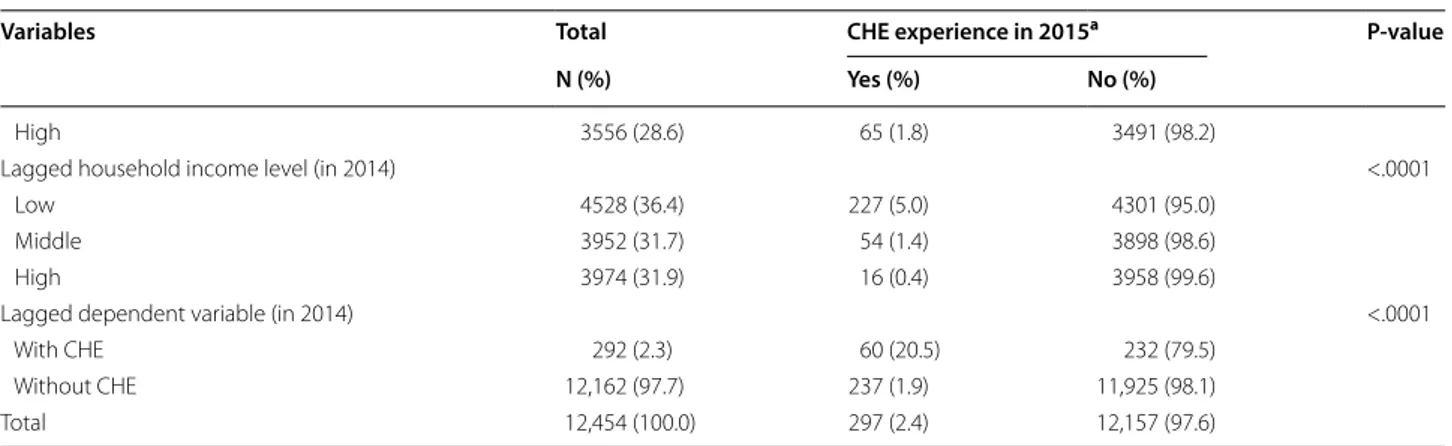
Table 2 shows the association between economic activ-ity changes and CHE experience. In terms of economic activity, the active → inactive group experienced eco-nomic activity that had the highest OR for CHE experi-ence compared to the active → active group (referexperi-ence group), which was statistically significant (OR = 2.10; 95% CI 1.31–3.36). The inactive → active group and the inactive → inactive group had higher ORs than those of the reference group, and they were statistically signifi-cant (OR = 1.83; 95% CI 1.14–2.94, OR = 1.45; 95% CI 1.07–1.97, respectively). In addition, if CHE was expe-rienced in 2014, the OR of experience CHE in 2015 was significantly higher (OR = 4.58; 95% CI 3.27–6.42). A sensitivity analysis of the association between economic activity changes and CHE experience according to differ-ences in the proportion of the medical costs that define CHE showed that even when the criteria were differ-ent, the active → inactive group had the highest OR for
Table 1 General characteristics of the study population
Variables Total CHE experience in 2015a P-value
N (%) Yes (%) No (%) Economic activity (2014 → 2015) <.0001 Active → active 6837 (54.9) 87 (1.3) 6750 (98.7) Inactive → active 796 (6.4) 26 (3.3) 770 (96.7) Active → inactive 611 (4.9) 26 (4.3) 585 (95.7) Inactive → inactive 4210 (33.8) 158 (3.8) 4052 (96.2) Sex 0.1211 Men 5667 (45.5) 122 (2.2) 5545 (97.8) Women 6787 (54.5) 175 (2.6) 6612 (97.4) Age <.0001 19–34 1808 (14.5) 7 (0.4) 1801 (99.6) 35–49 3619 (29.1) 12 (0.3) 3607 (99.7) 50–64 3449 (27.7) 56 (1.6) 3393 (98.4) 65– 3578 (28.7) 222 (6.2) 3356 (93.8) Marital status 0.3432 Married 8834 (70.9) 218 (2.5) 8616 (97.5)
Single, widowed, divorced, separated 3620 (29.1) 79 (2.2) 3541 (97.8)
Educational level <.0001
Middle school and below 4126 (33.1) 218 (5.3) 3908 (94.7)
High school 4473 (35.9) 60 (1.3) 4413 (98.7)
College and over 3855 (31.0) 19 (0.5) 3836 (99.5)
Medical aid 0.5929 No 12,051 (96.8) 289 (2.4) 11,762 (97.6) Yes 403 (3.2) 8 (2.0) 395 (98.0) Disability status <.0001 No 11,571 (92.9) 253 (2.2) 11,318 (97.8) Yes 883 (7.1) 44 (5.0) 839 (95.0)
Charlson comorbidity index <.0001
0 10,321 (82.9) 173 (1.7) 10,148 (98.3)
1 1475 (11.8) 73 (4.9) 1402 (95.1)
2+ 658 (5.3) 51 (7.8) 607 (92.2)
Unmet medical needs 0.0271
No 9401 (75.5) 208 (2.2) 9193 (97.8) Yes 3053 (24.5) 89 (2.9) 2964 (97.1) Current smoker <.0001 No 10,207 (82.0) 270 (2.6) 9937 (97.4) Yes 2247 (18.0) 27 (1.2) 2220 (98.8) Alcohol consumption <.0001 No 8176 (65.6) 128 (1.6) 8048 (98.4) Yes 4278 (34.4) 169 (4.0) 4109 (96.0) Region <.0001 Urban area 5298 (42.5) 74 (1.4) 5224 (98.6) Rural area 7156 (57.5) 223 (3.1) 6933 (96.9) Head of household <.0001 Householder 5986 (48.1) 177 (3.0) 5809 (97.0) Non‑householder 6468 (51.9) 120 (1.9) 6348 (98.1)
Household income level 0.0020
Low 5136 (41.2) 151 (2.9) 4985 (97.1)
CHE experience compared to the reference group, and all results were statistically significant. When 10% and 20% were used as the criteria, the OR of the inactive → inac-tive group was higher than that of the inacinac-tive → acinac-tive group, but when the criteria were 30% and 40%, the opposite trend was shown (Additional file 1: Figure S1).
Table 3 reports the association between the cause of economic inactivity and the CHE experience, and showed that the ORs of other groups were lower than those of the voluntary selection group (reference group), but in health-related factors, the OR is higher in both active → inactive and inactive → inactive groups. How-ever, the results were statistically significant only in inac-tive → inacinac-tive groups (OR = 2.40; 95% CI 0.61–9.43, OR = 1.65; 95% CI 1.01–2.68, respectively).
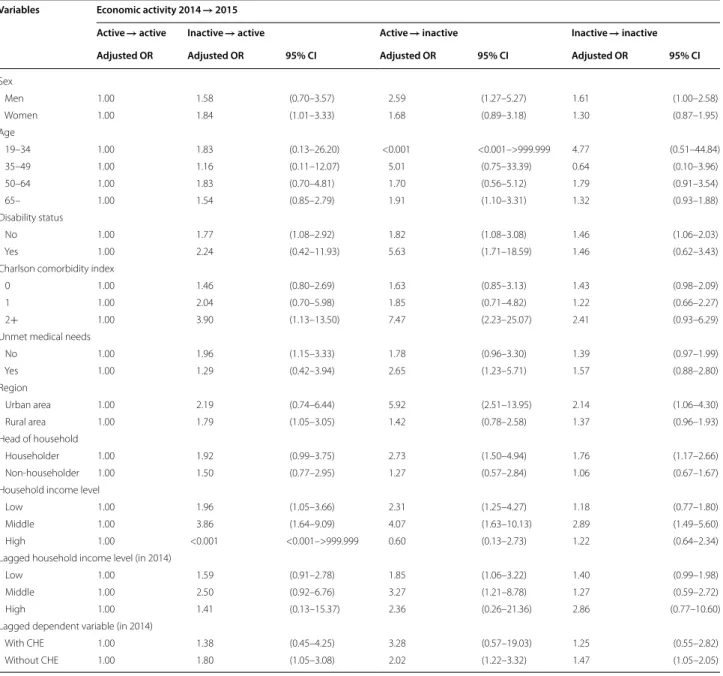
Table 4 shows the results of the subgroup analysis according to the sex, age, health-related, and house-hold-level variables. According to the subgroup analysis by sex, men have the highest OR in the active → inac-tive group and women in the inacinac-tive → acinac-tive group (OR = 2.59; 95% CI 1.27–5.27, OR = 1.84; 95% CI 1.01– 3.33, respectively). In the age subgroup analysis, the OR of the active → inactive group is the highest in the group aged 65 or older (OR = 1.91; 95% CI 1.10–3.31).
Concerning the subgroup by disability status, the OR of the active → inactive group is the highest for people both with and without disabilities (OR = 5.63; 95% CI 1.71– 18.59, OR = 1.82; 95% CI 1.08–3.08, respectively) with the trends for the former being higher than for the latter. There is a tendency that the higher the CCI, the higher the OR. In unmet medical needs, the No group has the highest OR of the inactive → active group, while the Yes group has the highest OR of the active → inactive group (OR = 1.96; 95% CI 1.15–3.33, OR = 2.65; 95% CI 1.23– 5.71, respectively).
In terms of household level, the householder group had a higher OR than the non-householder group. The active → inactive group in the householder group has the highest OR (OR = 2.73; 95% CI 1.50–4.94) and is sta-tistically significant; however, in the non-householder group, the inactive → active group shows the highest OR and is not, statistically not significant. According to the household income level, the middle OR group tended to be higher than the low group, and the active → inactive group in both low and middle groups has the highest OR (OR = 2.31; 95% CI 1.25–4.27, OR = 4.07; 95% CI 1.63– 10.13, respectively). In lagged household income level (in 2014), the active → inactive group in the low and mid-dle group has the highest OR and the inactive → inactive group in the high group has the highest OR. According to the lagged dependent variable, that is, CHE experience in 2014, the OR of the active-inactive group is the highest in the groups with and without CHE.
Discussion
This study examined the association between economic activity changes and the experience of CHE. Accord-ing to the results, when the criteria for CHE was set at 40%, those who discontinue economic activities were more likely to experience CHE than those who continue economic activities. Sensitivity analyses performed by different criteria for defining CHE also showed that the risk that an individual would experience CHE when they quit economic activities tended to be the highest com-pared to other groups. The expansion of previous studies’ results into general population groups provides further evidence that employment status is linked to CHE. These findings are in line with those of previous studies, as one of the factors precipitating CHE is the cessation of economic activities [15–17]. The results here show that
The p-value is the Chi square test result
a CHE Catastrophic health expenditure Table 1 (continued)
Variables Total CHE experience in 2015a P-value
N (%) Yes (%) No (%)
High 3556 (28.6) 65 (1.8) 3491 (98.2)
Lagged household income level (in 2014) <.0001
Low 4528 (36.4) 227 (5.0) 4301 (95.0)
Middle 3952 (31.7) 54 (1.4) 3898 (98.6)
High 3974 (31.9) 16 (0.4) 3958 (99.6)
Lagged dependent variable (in 2014) <.0001
With CHE 292 (2.3) 60 (20.5) 232 (79.5)
Without CHE 12,162 (97.7) 237 (1.9) 11,925 (98.1)
householders are more likely to experience CHE if they lose their jobs.
In addition, according to the sensitivity analysis results, even if the proportion of medical expenses changes in respect to the total household expenses, it is likely that the household will experience CHE if its members cease economic activities. This can be interpreted as unem-ployment being closely related to medical expenses bur-den and increasing the risk of experiencing CHE. That is, the size of the denominator is reduced in the formula for calculating CHE. Regardless of the income size resulting from economic activity, unemployment leads to the loss of disposable income, which is likely to lead to CHE.
A further cause to explore is that if the amount of money spent on health care costs increases, there is an additional reason to experience CHE. In other words, the size of the numerator increases in the formula for evalu-ating CHE. The subgroup analysis of variables related to health status showed that the association between eco-nomic activity and CHE experience tended to be stronger in people with a disability, with unmet medical needs, or with a higher CCI (i.e., people with a health-related problem) than relatively healthy people (non-disabled, without unmet medical needs, or 0 of CCI group). In addition, this study showed that individuals were more likely to experience CHE when the reason for the loss of economic activity was due to health-related factors. These results are in line with previous studies [21, 22]. If economic activity becomes impossible for health reasons, this could be directly related to increased medical costs. Therefore, it is more likely for individuals to experience CHE due to job losses at a time when medical expenses are already high. In view of these results, one can deduce that an individual’s reason for experiencing CHE is that job loss and health problems increase the chance of CHE [23]. This suggests that people who experience CHE are likely to suffer a twofold setback. In other words, as
Table 2 Factors associated with CHE
Variables CHE experience in 2015a
Adjusted OR 95% CI Economic activity (2014 → 2015) Active → active 1.00 – Inactive → active 1.83 (1.14–2.94) Active → inactive 2.10 (1.31–3.36) Inactive → inactive 1.45 (1.07–1.97) Sex Men 1.00 – Women 1.00 (0.67–1.52) Age 19–34 1.00 – 35–49 0.72 (0.27–1.92) 50–64 2.14 (0.88–5.19) 65– 3.89 (1.60–9.47) Marital status Married 1.00 –
Single, widowed, divorced, separated 0.75 (0.52–1.08) Educational level
Middle school and below 2.02 (1.17–3.47)
High school 1.55 (0.91–2.65)
College and over 1.00 –
Medical aid No 1.00 – Yes 0.38 (0.19–0.80) Disability status No 1.00 – Yes 1.14 (0.80–1.62)
Charlson comorbidity index
0 1.00 –
1 1.48 (1.10–1.99)
2+ 1.82 (1.27–2.59)
Unmet medical needs
No 1.00 – Yes 0.85 (0.65–1.11) Current smoker No 1.00 – Yes 0.72 (0.46–1.12) Alcohol consumption No 1.00 – Yes 1.05 (0.81–1.37) Region Urban area 1.00 – Rural area 1.78 (1.35–2.34) Head of household Householder 1.16 (0.78–1.73) Non‑householder 1.00 –
Household income level
Low 0.95 (0.69–1.29)
Middle 1.03 (0.73–1.45)
All control variables were adjusted
a CHE Catastrophic health expenditure Table 2 (continued)
Variables CHE experience in 2015a
Adjusted OR 95% CI
High 1.00 –
Lagged household income level (in 2014)
Low 4.18 (2.42–7.22)
Middle 2.53 (1.43–4.47)
High 1.00 –
Lagged dependent variable (in 2014)
With CHE 4.58 (3.27–6.42)
the denominator shrinks and the numerator grows, the chances of experiencing CHE increase. Additionally, according to the age subgroup analysis, the group who quit economic activities while aged 65 years or older was most likely to experience CHE [24, 25]. Therefore, there is a need to manage medical expenditures in this group because it is likely that their medical expenses will increase rapidly.
The results of the analysis of subgroups by sex and head of household suggest that for women or non-householder individuals, groups experiencing economic difficulties such as CHE try to escape their economic difficulties by changing their states of economic activity [26]. In addi-tion, as the ratio of medical expenses in the CHE calcu-lation increases, the OR of the inactive → active groups increases, so it is also possible that CHE may impact the group’s employment status. Therefore, further research on this phenomenon is necessary.
As such, those who have lost their ability to respond to medical expenses will be very likely to experience CHE. When health reasons, old age, and other medical costs force individuals to cease economic activities, the expense of future medical services carry a significant burden. Therefore, burdensome medical costs can lead to poverty in the long term. In addition, previous studies have demonstrated that economic conditions are a meas-ure of an individual’s health status and quality of life. Sub-jective health status [27] or quality of life [25, 28] were reported to be better in better economic conditions. Eco-nomic conditions are closely related to medical access, and economic difficulties are often a matter of health equity [29]. Thus, economic hardship can lead to poor health, which, in turn, can lead to economic hardship.
Therefore, efforts should be made to prevent poverty and bankruptcy due to medical expenses. In Korea, the gov-ernment enacted the Act on the Support for Catastrophic
Health Expenditure in 2018 and has been implement-ing the Catastrophic Health Expenditure Support Pro-gram since July of the same year [30]. Support for medical expenses can help prevent poverty by eliminating the eco-nomic difficulties caused by medical expenses in case of temporary high medical expenses. However, this policy can only benefit those who meet income and property require-ments. Analyses of household income levels showed that the middle class was more likely to experience CHE than the lower class. People in this blind spot will likely experi-ence even more distressing CHE, and this is similar to the situation in the United States [2, 31].
These findings have some limitations that require atten-tion. This study tried to consider the time perspective, but it may be difficult to ensure causality in the findings reported here. In addition, despite the efforts of investiga-tive agencies and researchers, there may be biases such as response bias and recall bias. The respondent may have been missed if there is a serious illness among those sur-veyed. In addition, some items, such as current smoking status and drinking status, may have a bias because they are self-reported, and healthcare use related survey items may be skewed in data collection because they collect data ret-rospectively [18]. Finally, some analyses results show that the 95% confidence interval is very wide, so it is necessary to pay attention to the results interpretation. However, this study’s strength is that it analyzed the general population with representative national data. It is also meaningful that this study examined the reasons for economic inactivity and examined different criteria for CHE.
Conclusions
In conclusion, this research shows that those who became unemployed were more likely to experience CHE than those who continued to be employed. The
Table 3 Association between the cause of economic inactivity and the CHE experience in 2015a
All control variables were adjusted
a CHE Catastrophic health expenditure
b Not in education, employment, or training as a voluntary choice
Variables Economic activity 2014 → 2015
Active → inactive Inactive → inactive
Adjusted OR 95% CI Adjusted OR 95% CI
Economically inactive factors
Family related factors 0.20 (0.02–2.56) 0.57 (0.29–1.11)
Health related factors 2.40 (0.61–9.43) 1.65 (1.01–2.68)
Retirement 0.47 (0.08–2.75) 0.79 (0.46–1.35)
Other 0.58 (0.10–3.26) 0.40 (0.13–1.22)
CHE experience was especially likely when the cause of job loss was health related. In other words, CHE was likely to be experienced when two things happened at the same time: an increase in the numerator (medical expenses) and a decrease in the denominator (dispos-able income). Therefore, to avoid CHE, the numera-tor should be reduced and the denominanumera-tor should be increased. Efforts are needed to expand coverage for people suffering from high medical expenses.
Supplementary information
Supplementary information accompanies this paper at https ://doi. org/10.1186/s1296 2‑020‑00233 ‑9.
Additional file 1: Figure S1. Sensitivity analysis of association between
changes in economic activity and CHE experience by different criteria for defining CHE. All covariates were adjusted; CHE, catastrophic health expenditure; CHE experience in 2015.
Table 4 Subgroup analysis of the CHE experience in 2015a
All control variables were adjusted
a CHE Catastrophic health expenditure
Variables Economic activity 2014 → 2015
Active → active Inactive → active Active → inactive Inactive → inactive
Adjusted OR Adjusted OR 95% CI Adjusted OR 95% CI Adjusted OR 95% CI
Sex Men 1.00 1.58 (0.70–3.57) 2.59 (1.27–5.27) 1.61 (1.00–2.58) Women 1.00 1.84 (1.01–3.33) 1.68 (0.89–3.18) 1.30 (0.87–1.95) Age 19–34 1.00 1.83 (0.13–26.20) <0.001 <0.001–>999.999 4.77 (0.51–44.84) 35–49 1.00 1.16 (0.11–12.07) 5.01 (0.75–33.39) 0.64 (0.10–3.96) 50–64 1.00 1.83 (0.70–4.81) 1.70 (0.56–5.12) 1.79 (0.91–3.54) 65– 1.00 1.54 (0.85–2.79) 1.91 (1.10–3.31) 1.32 (0.93–1.88) Disability status No 1.00 1.77 (1.08–2.92) 1.82 (1.08–3.08) 1.46 (1.06–2.03) Yes 1.00 2.24 (0.42–11.93) 5.63 (1.71–18.59) 1.46 (0.62–3.43)
Charlson comorbidity index
0 1.00 1.46 (0.80–2.69) 1.63 (0.85–3.13) 1.43 (0.98–2.09)
1 1.00 2.04 (0.70–5.98) 1.85 (0.71–4.82) 1.22 (0.66–2.27)
2+ 1.00 3.90 (1.13–13.50) 7.47 (2.23–25.07) 2.41 (0.93–6.29)
Unmet medical needs
No 1.00 1.96 (1.15–3.33) 1.78 (0.96–3.30) 1.39 (0.97–1.99) Yes 1.00 1.29 (0.42–3.94) 2.65 (1.23–5.71) 1.57 (0.88–2.80) Region Urban area 1.00 2.19 (0.74–6.44) 5.92 (2.51–13.95) 2.14 (1.06–4.30) Rural area 1.00 1.79 (1.05–3.05) 1.42 (0.78–2.58) 1.37 (0.96–1.93) Head of household Householder 1.00 1.92 (0.99–3.75) 2.73 (1.50–4.94) 1.76 (1.17–2.66) Non‑householder 1.00 1.50 (0.77–2.95) 1.27 (0.57–2.84) 1.06 (0.67–1.67)
Household income level
Low 1.00 1.96 (1.05–3.66) 2.31 (1.25–4.27) 1.18 (0.77–1.80)
Middle 1.00 3.86 (1.64–9.09) 4.07 (1.63–10.13) 2.89 (1.49–5.60)
High 1.00 <0.001 <0.001–>999.999 0.60 (0.13–2.73) 1.22 (0.64–2.34)
Lagged household income level (in 2014)
Low 1.00 1.59 (0.91–2.78) 1.85 (1.06–3.22) 1.40 (0.99–1.98)
Middle 1.00 2.50 (0.92–6.76) 3.27 (1.21–8.78) 1.27 (0.59–2.72)
High 1.00 1.41 (0.13–15.37) 2.36 (0.26–21.36) 2.86 (0.77–10.60)
Lagged dependent variable (in 2014)
With CHE 1.00 1.38 (0.45–4.25) 3.28 (0.57–19.03) 1.25 (0.55–2.82)
Acknowledgements
We are grateful to the Korea Institute for Health and Social Affairs and the National Health Insurance Corporation that conducted the Korea Health Panel Survey (KHPS) which is the primary source of this study.
Authors’ contributions
Conceptualization, HJL and JK; Formal analysis, HJL and DWC; Methodology, HJL and DWL; Supervision, ECP; Writing—original draft, HJL; Writing—review & editing, ECP and SSO. All authors read and approved the final manuscript.
Funding
This research did not receive any specific grant from funding agencies in the public, commercial, or not‑for‑profit sectors.
Availability of data and materials
The dataset is available on the Korea Health Panel Survey (KHPS) website, https ://www.khp.re.kr:444/eng/main.do.
Ethics approval and consent to participate
The Korea Health Panel Survey (KHPS) data published openly. Therefore, ethical approval was not required for this study. This study did not require informed consent from the participants, as their information was fully anonymized and unidentified prior to analysis.
Consent for publication
Not applicable.
Competing interests
The authors declare that they have no competing interests.
Author details
1 Department of Public Health, Graduate School, Yonsei University, Seoul, Republic of Korea. 2 Institute of Health Services Research, Yonsei University, 50 Yonsei‑ro, Seodaemun‑gu, Seoul 03722, Republic of Korea. 3 Depart‑ ment of Obstetrics & Gynecology, Ewha Womans University, Seoul, Republic of Korea. 4 Department of Preventive Medicine, Yonsei University College of Medicine, 50 Yonsei‑ro, Seodaemun‑gu, Seoul 03722, Republic of Korea. Received: 22 March 2020 Accepted: 11 September 2020
References
1. OECD: Health expenditure and financing: Health expenditure indicators. OECD Health Statistics (database) 2020.
2. Himmelstein DU, Lawless RM, Thorne D, Foohey P, Woolhandler S. Medical bankruptcy: still common despite the affordable care act. Am J Public Health. 2019;109:431–3.
3. Himmelstein DU, Warren E, Thorne D, Woolhandler S. Illness and injury as contributors to bankruptcy. Health Aff. 2005;24:570.
4. Park JM. Equity of access to primary care among older adults in Incheon, South Korea. Asia Pacific J Public Health. 2012;24:953–60.
5. Kim J, Kim TH, Park EC, Cho WH. Factors influencing unmet need for health care services in Korea. Asia Pacific J Public Health. 2015;27:2555–69.
6. Kim HJ, Jang J, Park EC, Jang SI. Unmet healthcare needs status and trend of Korea in 2017. Health Policy and Management. 2019;29:82.
7. Kim S: Trends in catastrophic household health expenditures and their implications for policy. In Health Welf Forum. 2019: 74‑85.
8. Wyszewianski L: Financially catastrophic and high‑cost cases: defini‑ tions, distinctions, and their implications for policy formulation. Inquiry 1986:382‑394.
9. Xu K, Evans DB, Kawabata K, Zeramdini R, Klavus J, Murray CJ. House‑ hold catastrophic health expenditure: a multicountry analysis. Lancet. 2003;362:111–7.
10. Xu K: Distribution of health payments and catastrophic expenditures methodology. In Distribution of health payments and catastrophic expenditures Methodology. 2005.
11. Waters HR, Anderson GF, Mays J. Measuring financial protection in health in the United States. Health Policy. 2004;69:339–49.
12. Wagstaff A, Doorslaer EV. Catastrophe and impoverishment in paying for health care: with applications to Vietnam 1993–1998. Health Econ. 2003;12:921–33.
13. Sohn S, Shin YJ, Kim CY. Factors influencing household catastrophic health expenditure of the poor. Health Soc Welf Rev. 2010;30:92–110. 14. Li Y, Wu Q, Xu L, Legge D, Hao Y, Gao L, Ning N, Wan G. Factors affecting
catastrophic health expenditure and impoverishment from medical expenses in China: policy implications of universal health insurance. Bull World Health Organ. 2012;90:664–71.
15. Lee JE, Shin HI, Do YK, Yang EJ. Catastrophic health expenditures for households with disabled members: evidence from the Korean health panel. J Korean Med Sci. 2016;31:336–44.
16. Choi JW, Choi JW, Kim JH, Yoo KB, Park EC. Association between chronic disease and catastrophic health expenditure in Korea. BMC Health Ser‑ vices Res. 2015;15:26.
17. Choi JW, Cho KH, Choi Y, Han KT, Kwon JA, Park EC: Changes in economic status of households associated with catastrophic health expenditures for cancer in South Korea. 2014.
18. Korea Institute for Health and Social Affairs. Korea National Health Insur‑ ance Sevice: 2008‑2016 Korea Health Panel User’s Manual. Korea National Health Insurance Sevice: Korea Institute for Health and Social Affairs; 2019.
19. Sung NJ, Choi YJ, Lee JH. Primary care comprehensiveness can reduce emergency department visits and hospitalization in people with hyper‑ tension in South Korea. Int J Env Res Public Health. 2018;15:272. 20. Schreiber‑Gregory D, Jackson H: Multicollinearity: what is it, why should
we care, and how can it be controlled. In Proceedings of the SAS R Global Forum 2017 Conference Paper. 2017.
21. Bartley M, Owen C. Relation between socioeconomic status, employ‑ ment, and health during economic change, 1973–1993. BMJ. 1996;313:445–9.
22. Dobkin C, Finkelstein A, Kluender R, Notowidigdo MJ. Myth and measurement: the case of medical bankruptcies. New England J Med. 2018;378:1076.
23. Schuring M, Burdorf L, Kunst A, Mackenbach J. The effects of ill health on entering and maintaining paid employment: evidence in European coun‑ tries. J Epidemiol Commun Health. 2007;61:597–604.
24. Pokorski R, Berg BW: Retirement Planning: Coping with Higher Health Care Costs. J Financial Service Professionals 2017, 71.
25. Zhang Y, Gao Q: Catastrophic health expenditure and health‑related qual‑ ity of life among older adults in China. Ageing & Society 2019:1‑21. 26. Homaie Rad E, Rashidian A, Arab M, Souri A. The effect of catastrophic
health expenditure on work after retirement. Int J Aging Hum Dev. 2017;84:313–23.
27. Cheng Y, Chi I, Boey K, Ko L, Chou KL. Self‑rated economic condi‑ tion and the health of elderly persons in Hong Kong. Soc Sci Med. 2002;55:1415–24.
28. Kang SH, Ju YJ, Yoon HJ, Lee SA, Kim W, Park EC. The relationship between catastrophic health expenditure and health‑related quality of life. Int J Equity Health. 2018;17:166.
29. Aday LA, Andersen RM: Equity of access to medical care: a conceptual and empirical overview. Medical Care 1981:4‑27.
30. Ministry of Health and Welfare: Act on the support for catastrophic health expenditure. vol. Act No. 15349; 2018.
31. Himmelstein DU, Thorne D, Warren E, Woolhandler S. Medical bank‑ ruptcy in the United States, 2007: results of a national study. Am J Med. 2009;122:741–6.
Publisher’s Note
Springer Nature remains neutral with regard to jurisdictional claims in pub‑ lished maps and institutional affiliations.