저작자표시-비영리-변경금지 2.0 대한민국 이용자는 아래의 조건을 따르는 경우에 한하여 자유롭게 l 이 저작물을 복제, 배포, 전송, 전시, 공연 및 방송할 수 있습니다. 다음과 같은 조건을 따라야 합니다: l 귀하는, 이 저작물의 재이용이나 배포의 경우, 이 저작물에 적용된 이용허락조건 을 명확하게 나타내어야 합니다. l 저작권자로부터 별도의 허가를 받으면 이러한 조건들은 적용되지 않습니다. 저작권법에 따른 이용자의 권리는 위의 내용에 의하여 영향을 받지 않습니다. 이것은 이용허락규약(Legal Code)을 이해하기 쉽게 요약한 것입니다. Disclaimer 저작자표시. 귀하는 원저작자를 표시하여야 합니다. 비영리. 귀하는 이 저작물을 영리 목적으로 이용할 수 없습니다. 변경금지. 귀하는 이 저작물을 개작, 변형 또는 가공할 수 없습니다.
Master
’s Thesis of Economics
Effects of Agricultural Extension
Service and Education
on the Farm Productivity
- Evidence from Mbale District in Uganda -
영농교육과 정규교육이 농업생산성에 미치는 영향
-우간다 음발레 지역을 중심으로-
February, 2017
Graduate School of Agricultural Economics
and Rural Development
Seoul National University
Agricultural Economics Major
i
Abstract
Effects of Agricultural Extension
Service and Education on the
Farm Productivity
- Evidence from Mbale District in Uganda-
Yeyoung Lee
Dept. of Agricultural Economics & Rural Development
The Graduate School
Seoul National University
The majority of households in developing countries derive their livelihood from agricultural activities. Thus, a number of studies have emphasized that adoption of agricultural technologies and boosting agricultural production could be a key strategy option for escaping poverty trap of rural areas. According to previous studies, extension service and education have been revealed to be critical components of rural development by increasing agricultural productivity. However, earlier studies noted that impacts of these components in economy of developing countries, especially African countries, were negative or statistically insignificant.
ii
effects of agricultural extension and formal education on agricultural productivity in the rural area of Uganda located in East Africa. For the data collection, the survey was conducted in Mbale District located in the Eastern area of Uganda. The entire sample consists of 200 farm households which are randomly selected from several villages. However, the sample used in the analysis after exclusion is 181 households because of a few challenges regarding the response rates during the survey. In order to examine the effects of extension on farm productivity, this study used the following dependent variables: quantities of single crop output (maize, bean, and rice), gross farm revenue, and profit variable. Explanatory variables included land, labor, capital variables, and extension and education which are continuous variables.
The estimated results showed that agricultural extension service in Mbale district had a significantly positive impact on bean and rice production, gross farm revenue, and profit except for maize output. On the other hands, formal education in the district mostly had a negative or insignificant effect on each production function.
Overall, this study revealed extension to be a more critical contributor than formal education in terms of agricultural productivity in Mbale district. Back in the early 2000s, the Plan for Modernization of Agriculture (PMA) was created and NAADS
iii
(National Agricultural Advisory Services) was established in Uganda to support the transformation of the agricultural sector. On the face of it, the results of this study are expected to support an argument that the development of extension service can be effective to farm productivity in Mbale district. On the other hand, most estimates showed that formal education’s impact in the district on agricultural activities were not statistically significant. Though the estimated results for the formal education was mostly negative or statistically insignificant, the uncontrolled effect of the education such as farmers’ basic capacity and skills to learn agricultural techniques could have a positive contribution to farm productivity.
Keywords : extension service, education, Uganda, agricultural productivity, engineering, gross revenue, value-added production function
iv
Table of Contents
Chapter 1. Introduction ... 1
1.1 Study Background ... 1
1.2 Extension Service in Uganda ... 5
1.3 Education in Uganda ... 8
1.4 Purpose of Study ... 11
Chapter 2. Literature Review ... 12
2.1 Adoption of Technology and Agriculutral Growth ... 12
2.2 Agricultural Extension and Farm Productivity ... 13
2.3 Education and Farm Productivity ... 17
Chapter 3. Description on Study Area and Data ... 22
3.1 Mbale Context and Data ... 22
3.1.1 Characteristics of Study Area ... 22
3.1.2 Data and Chllenges ... 26
3.2 Dependent Variable ... 28
3.3 Explanatory Vatialble ... 29
3.4 Descriptive Statistics ... 30
Chapter 4. Model and Estimation Method ... 33
4.1 Model Specification ... 33
4.2 Estimation Method ... 36
Chapter 5. Empirical Results ... 39
5.1 The Estimates from Engineering Functions ... 39
5.2 The Estimates from Gross Revenue and Profit Functions .. 42
Chapter 6. Summary and Conclusion ... 44
References ... 49
Appendix ... 54
1
Chapter 1. Introduction
1.1. Study Background
In many parts of developing world, agricultural growth is crucial for poverty reduction since the majority of people derive their livelihood from agricultural activities. Thus, the means of boosting agricultural production is widely acknowledged as the core strategy for escaping poverty trap
(
Otsuka and Larson, 2013).Strategy for escaping the poverty trap in Sub-Saharan Africa (SSA) mainly lies with this approach since 62% of the total population, excluding the population in South Africa, work in the agricultural sector for their livelihoods (Elias et al., 2013). Moreover, most households in SSA are smallholder farmers exposed to poverty. Earlier findings indicate that 30.5 percent of the world’s poor is considered to be the community of poverty in SSA with the highest headcount poverty rate (47.5 percent) (Sumner, 2012). Furthermore, Sumner (2012) notes that Sub-Saharan region accounts for approximately 26 percent of the 1.2 billion people in extreme poverty who live on less than $ 1.25 a day and 83 percent of the population who are extreme poor in SSA dwell in the rural areas. Meanwhile, one of the severe problems rising in this region is that productivity has not significantly
2
increased over the decades, and its output has not kept pace with population growth (Teklewold et al., 2013).
On the face of it, improving agricultural technologies as a means of increasing farm productivity seems a crucial strategy. A number of studies have emphasized that adoption of agricultural technologies could be a key strategy option for boosting agricultural productivity and poverty reduction (Minten and Barrett, 2007; Kassie et al., 2011; Omilola, 2009; Teklewold et al., 2013). Kassie, et al. (2011) measured the casual effect of adoption of technology for improving groundnut varieties on net crop income of households as well as poverty status in Uganda, and found significant results with farm size and educational level. Technology adoption has more impacts on smallholder farmers who owned their lands of less than 2.55 ha and households those who are more educated.
Indeed, awareness of promotion of agricultural technology and its effects on poverty reduction has increased in SSA. In perceiving the problems of low productivity, SSA countries have been trying to adopt various methods such as high yield crop technologies, fertilizers, and irrigation systems (Betz, 2009). However, adopting new technologies in Africa has the challenge to raise productivity directly since farmers in this region have a lack of knowledge in how to apply improved methods (Morris, 2007). In other words, the
3
low adoption rates of technologies caused by lack of information and other difficulties resulted in poor outcomes. Previous studies describe that a knowledge and skill delivery could be an integral part in farmers’ capacity to generate higher growth in agricultural yield (Betz, 2009).
Like a number of countries in Sub-Saharan Africa, agriculture is the important sector for economic growth and poverty reduction in Uganda, a country in East Africa. Indeed, economy in this country remains heavily reliant on agriculture. Over 85 percent of the people and 80 percent of the poor dwell in rural areas and most receive their primary source of income from subsistence agriculture (Kraybill and Kidoido, 2009; UBOS; 2014). Furthermore, the agricultural sector in Uganda accounts for 71.9 percent of employment, and 25.3 percent of Uganda’s GDP according to the UN data. This implies that agricultural development is vital in economic growth in Uganda. Improvement in the agricultural sector generally depends on technologies, access to agricultural information, and better infrastructure and markets.
According to 2016 World Food Program, smallholder farmers in Uganda account for approximately 96 percent of total farmers and 75 percent of total farm produce. Although agricultural sector has taken the most important portion in the economy of Uganda, its
4
outcome is not successful (Pan et al., 2015), and the poverty rate is at 19.5 percent (WFP, 2016). One of the key challenges identified by Morris et al. (2007) is a lack of access to information, markets, and technology for productivity improvement.
In fact, lack of farmers’ access to agricultural information, technologies, and improved inputs leads to the poor productivity (World Bank, 2008). According to Nkonya et al. (2005), agricultural technical information enables the increase in farmers’ capability to adopt innovative technologies and inputs. Agricultural extension service is one of the most common mechanisms of transferring knowledge and skills to farmers as support to apply them to the real world (Anderson and Feder, 2003).
The primary objectives of the agricultural extension service include providing information and educating them how to apply core principals of improved technologies to farm practices (McDowell, 1929; Anderson and Feder, 2004). Moreover, extension activities help farmers form group and work with many institutions with an aim of increasing productivity, and assist them to market their agricultural products (Rivera et al., 2006). Therefore, effective agricultural extension can contribute to improve productivity, increased output, and household income for the economy by bridging the gap between educational discoveries in extension
5
providers and status in individual farmers (Birkhaeuser et. al., 1991).
However, various studies argue that agricultural extension has limited impacts on farm income and in dealing with agricultural productivity in many African countries (Betz, 2009; Gautam, 2000). In the case of Uganda, the reputation of extension was the same with the evaluation of its program in Africa. In the response of ineffective results from extension service, the government of Uganda reformed the design in NAADS (National Agricultural Advisory Services) in 2008, with an aim of transferring effective agricultural extension services to farmers in rural areas (Betz, 2009). Following this shift from ineffective program to effective extension delivery, government and private organization for extension in Uganda have been undergoing a number of reforms.
1.2. Extension Service in Uganda
In Uganda, the first form of agricultural extension was introduced to the country by the colonial government in the late 1800s (Mangheni et al., 2003). After colonization, the government of Uganda implemented a number of agricultural extension approaches (Hakiza et al., 2004). However, its positive progression
6
towards economic growth has not directly benefited most rural people in Uganda according to the report published by NAADS (NAADS, 2001). Faced with various challenges, the government made a new framework called Poverty Eradication Action Plan (PEAP) in 1997 for poverty reduction. Under its structure, the Plan for Modernization of Agriculture (PMA) was created to support the transformation of the agricultural sector. According to the report of NAADS, its main objectives were to increase productivity, empower the farmers to adopt technology for improved farming practices, promote competitive production and marketing, make a diversified agriculture with higher value and higher demand, and to ensure food security (NAADS, 2001).
Following the objectives of the PMA, major reforms of extension service in Uganda were conducted under NAADS, which was established in 2001 for public agricultural extension services aimed at overcoming poor research-extension-farmer linkages, uncoordinated advisory services, low responsiveness to farmers’ actual needs, and lack of financial support. Its fundamental mission is to increase farmers’ access to appropriate information, knowledge, and technology by effective extension for improved agricultural production (NAADS, 2001). Some of the key strategies of NAADS for achieving its objectives are as follows: create options
7
for financing and delivery of the services for different types of farmers, develop private sector to supply more agricultural advices, and so on. According to the NAADS program implementation manual report, keywords of the organization principles are: poor, appropriate technologies, decentralization, improved productivity, increased commercialization, participatory process, sustainable management, and better linkages between research, extension, and farmers (NAADS, 2001).
Various studies noted that deepening decentralization enhances improved coordination of extension with other agencies at lower costs since extension staffs in the district-level government are supported by the central government (Anderson and Crowder, 2000; Anderson and Feder, 2003). The district extension coordinator takes responsibility for extension at the district level, and the county extension coordinator at the county level supervises the field extension workers who work with the farmers (NAADS, 2001).
Summing up the extension service in Uganda, public extension in this country faced many challenges, such as lack of response to farmers’ actual needs and non-participatory approaches. As a response to these constraints, the system has been replaced by a contract privatized system under the NAADS and the government reformed its structure for the agricultural development.
8
1.3. Education in Uganda
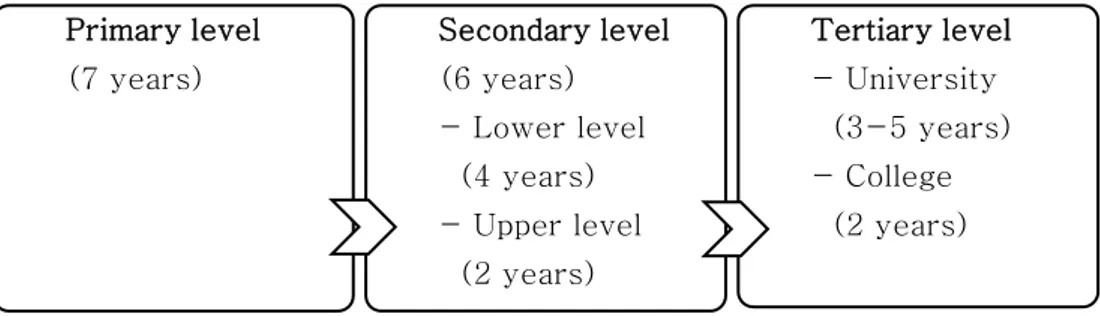
The formal education in Uganda was first initiated by the Christian missionaries in the colonial period around the 1880s. Its system has been modified several times since 1925 under the government. The current system of education in Uganda is composed of four levels: Primary, Secondary, Vocational, and Tertiary Education (UBOS, 2015). As can be seen from figure 1, it has a structure of seven years of primary education, six years of secondary education, which is followed by four years of lower secondary (O level) and two years of upper secondary (A level), and three to five years of vocational or tertiary education. According to UNHCR report, the school year has three terms from February to May, May to August, and September to December (UNHCR, 2014). The current education policy in Uganda mainly aims to provide equitable opportunities for education to all people in Uganda, especially in the primary education sector since it directly influences the poor in the rural areas. One of the key policies of the government is Universal Primary Education (UPE) introduced in 1997. Its objective is to enable every individual to access primary education and complete schooling.
9 Primary level (7 years) Secondary level (6 years) - Lower level (4 years) - Upper level (2 years) Tertiary level - University (3-5 years) - College (2 years)
Figure 1. Formal Education System in Uganda
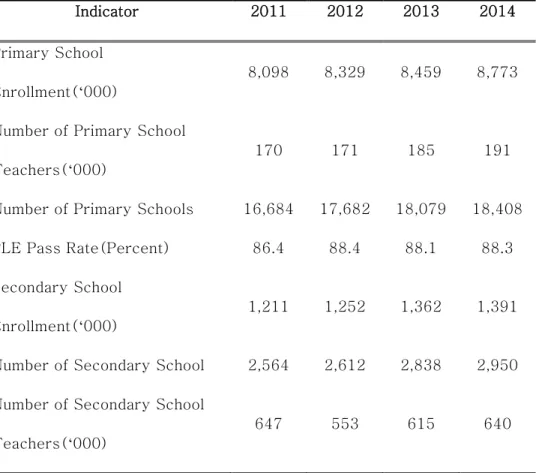
The ultimate goal is to eliminate inequalities and reduce poverty by providing fundamental knowledge and skills to all people in Uganda. Under its fundamental goal, the government and external donors are given support and donate school fees for primary education. This has brought several remarkable changes into the educational sector in Uganda. According to the national report in Uganda (UBOS, 2015), the number of students enrolled in primary school has been gradually growing since 2011 as Table 1 summarized. The primary school enrollment by class increased from about 8.1 million in 2011 to 8.8 million in 2014 and number of school and teachers also increased (UBOS, 2015). Literacy rates for the population in Uganda also increased from 69 percent in 2005/06 to 71 percent in 2012/13 (UBOS, 2015).
10
Table 1. Major Indicators of Education in Uganda, 2011-2014
Indicator 2011 2012 2013 2014
Primary School Enrollment(‘000)
8,098 8,329 8,459 8,773
Number of Primary School Teachers(‘000)
170 171 185 191
Number of Primary Schools 16,684 17,682 18,079 18,408 PLE Pass Rate(Percent) 86.4 88.4 88.1 88.3 Secondary School
Enrollment(‘000)
1,211 1,252 1,362 1,391
Number of Secondary School 2,564 2,612 2,838 2,950 Number of Secondary School
Teachers(‘000)
647 553 615 640
Source: Uganda Bureau of Statistics (UBOS, 2015).
In Uganda, it is required that students pass the Primary Leaving Examination (PLE) to enter into secondary school. The percent of a pass rate also increased from 86 percent in 2011 to 88.3 percent in 2014. According to the report, secondary school enrollment also increased. However, the number of students enrolled is larger in lower secondary school (UBOS, 2015), indicating that fewer students access higher education.
11
1.3. Purpose of Study
Analyzing effects of agricultural extension and education on farm productivity in Africa countries began to be present only a few decades ago. A number of researchers acknowledged that it has the potential to support farmers efficiently to increase more production for a long period of time (Huffman, 1978). This study is a case study examining contribution of extension and formal education in rural areas in Mbale district of Uganda to farmers’ performance. The primary research question about the effects of extension and education in Uganda is if they raise agricultural output and assist farmers to make more revenue and profit. Therefore, three measurements of output were used in this study. The major hypothesis of this study is that extension service and education will have significant and positive effects on quantity of farm production, revenue, and profit in rural area of Mbale district.
The rest of this study has following sections: The second section summarizes literature review of extension service and agricultural growth; the third presents the data and descriptive statistics and demonstrates the methodological framework; the last section summarizes conclusions, highlighting the key results and implications.
12
Chapter 2. Literature Review
2.1. Effects of Agricultural Extension on Farm Productivity
Anderson and Feder (2003) suggested two types of gaps, technology gap and management gap, between actual and potential productivity. They showed that agricultural extension service is one of the most important systems that facilitate the access of farmers, value chain, and market actors to knowledge, and one of the channels to reduce the productivity differential (Anderson and Feder, 2004). A number of studies also found that extension has contributed to increased productivity and farm income (Huffman, 1976; Jamison and Moock, 1984; Birkhaeuser et al., 1991; Owens et al., 2003; Anderson and Feder, 2004). Some of the researches measured the impact of extension service by containing extension variables, such as number of extension visits and total hours of extension worker time on crop yield per hectare (Jamison and Lau, 1982; Jamison and Moock, 1984; Evenson et al., 1998). Jamison and Moock (1984) surveyed the rural households of two districts in Nepal related to three major crops: early paddy, late paddy, and wheat. They showed that the impact on wheat increased 4% by a 10% increase in extension contact significantly. Owens et al. (2003) also measured the impact of extension on the value of crop
13
production per hectare with number of extension contacts in Zimbabwe, and found that the value of crop production boosted approximately 15%, significantly. Evenson et al. (1998) used the data set from 1982 for estimation and its information was on crop production, extension workers, schooling year of farmers, and farm inputs. The results indicated that extension service had a significant impact on four major crops including cotton, manioc, maize and potatoes in Kenya. However, its impact was not significant on minor crops such as sugar, peanuts, and tomatoes. Effects of schooling were positive but insignificant. Study by Patrick and Kehrberg (1973) and Huffman (1976) also presented that extension had a positive effect on farm productivity generally.
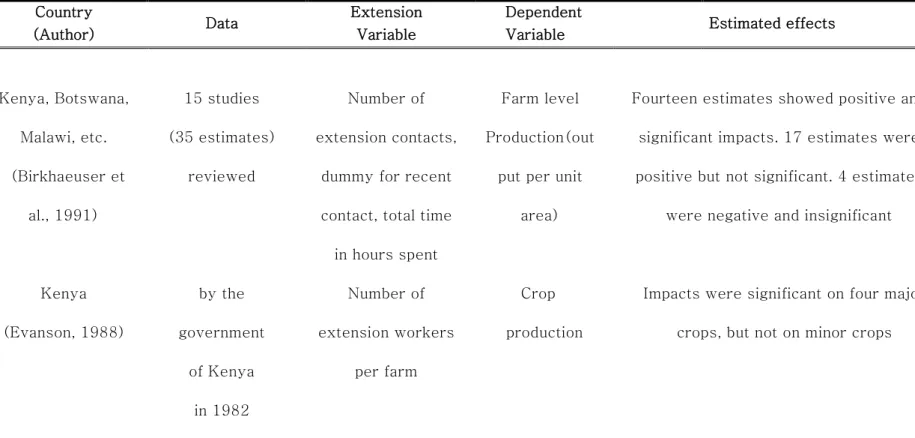
The table 2 and 3 summarize the effect of extension service on farm productivity. Birkhaeuser et al. (1991) analyzed productivity and extension variable from 15 studies and 35 estimates at the farm-specific level in order to determine how extension contacts impact farmers’ performance. The explanatory variables presented by their studies include the number of extension contacts, dummy for recent contact with extension agents, total time in hours spent by the farmers with the agents. Nine of the 15 reviewed studies showed a statistically significant and positive effect of extension service. However, they pointed out
14
that some results seem to have a significant effect by extension service because of the difference in areas or types of crops. Fourteen estimates of the 35 reviewed estimates showed positive and significant impacts. Seventeen estimates showed positive impacts but not significant. The rest of the estimates were negative and insignificant. Following the past studies, agricultural development scholars have generally concluded that the effect of extension services in developing countries has been still weakly functioning.
15
Table 2. Previous Studies about Effect of Extension on Farm Productivity
Country
(Author) Data
Extension Variable
Dependent
Variable Estimated effects
Brazil (Patrick and Kehrberg, 1973)
Data set from 1968 in Eastern region of Brazil Number of direct contacts of farmers with extension agents Crop production (Three production function)
had positive but not statistically significant impact
on value-added production
United States (Huffman, 1976)
Data set from 1964 in Iowa, North Carolina, Oklahoma Agents days allocated Crop Production
The marginal product of extension was positive and
16
Table 3. Previous Studies about Effect of Extension on Farm Productivity in Africa
Country
(Author) Data
Extension Variable
Dependent
Variable Estimated effects
Kenya, Botswana, Malawi, etc. (Birkhaeuser et al., 1991) 15 studies (35 estimates) reviewed Number of extension contacts,
dummy for recent contact, total time
in hours spent
Farm level Production(out
put per unit area)
Fourteen estimates showed positive and significant impacts. 17 estimates were positive but not significant. 4 estimates
were negative and insignificant
Kenya (Evanson, 1988) by the government of Kenya in 1982 Number of extension workers per farm Crop production
Impacts were significant on four major crops, but not on minor crops
17
2.2. Effects of Education on Farm Productivity
In the earlier literatures, education effects on agricultural output include cognitive and non-cognitive effects (Appleton and Balihuta, 1996). Cognitive effect of education enables individuals to get general skills, such as literacy and numeracy. These skills may raise the farmers’ performance by given inputs, that is corresponded to worker effect referred by Welch (1970). Worker effect means that a farmer with more educated level produces more output from a given amount of inputs. In addition, education has non-cognitive effects that may affect people’s practices and capacity. For example, people can adopt modern practices and improved technologies, and even better teamwork that raise the productivity (Appleton and Balihuta, 1996). It is the allocative effect that people equipped with various capacities make a better decision. The effect of education on agricultural productivity has been identified from various studies. Past studies usually estimated production functions, with land, labor, and capital. Typically, the dependent variable is the output of single crop or total farm output. Education variables are commonly measured by the number of years of schooling completed by the household head.
18
estimate the specific effect of education on agricultural productivity. For example, Welch (1970) proposed three production functions: engineering, gross revenue, and value-added production functions to decompose the effect of education on tangible production into three potential effects including worker effect, input allocation effect, and lastly input selection effect. Studies contributed by Welch (1970) presented that productivity is boosted more in a modernized circumstance than in traditional environment (Pudasaini, 1983).
Pudasaini (1983) took an important step to investigate the marginal contribution of education to tangible production, and measured which effect of education is more crucial in modernizing and traditional environments. He investigated the contribution of education to agricultural performance by decomposing effects of education into worker effect, input allocation effect, and input selection effect with three-production function presented by Welch (1970), and found that allocative effect is more important than the worker effect in a region of Nepal. The empirical evidences from other studies also presented that the allocative effect is more important than worker effect and most focuses on the relationship between education and U.S agriculture (Huffman, 1974; Khaldi 1975; Fane 1975). However, Wu (1977) pointed out that these
19
evidences can be different in developing countries.
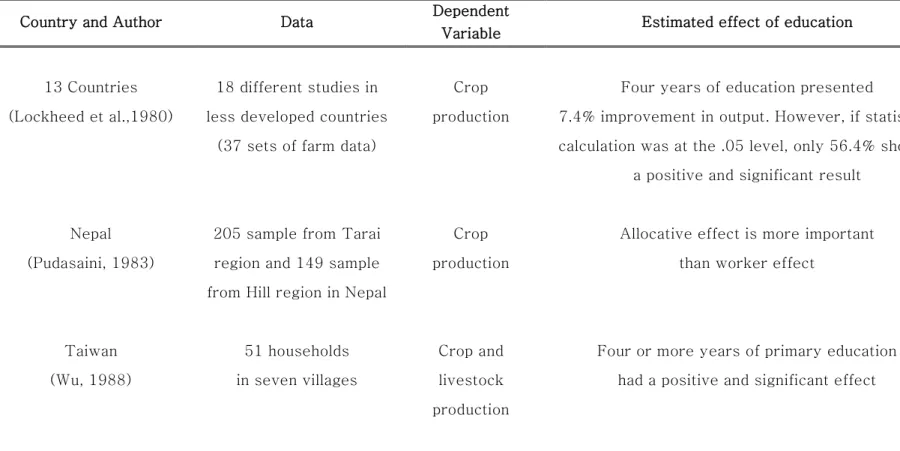
Compared to the series of studies above, only few studies estimated three production functions on agriculture in sub-Saharan Africa countries. Earlier studies which measured the impact of education on farm productivity in Africa are summarized in Table 5. Most estimates showed that they had a positive and significant contribution in many cases in Africa. However, most of the studies showed that only four years of education resulted in the expected outcome on agricultural productivity.
Lockheed et al. (1980) investigated the effect of education on farm productivity in low-income countries from 18 studies, and the results confirmed that on average 4 years of formal education had a positive effect on farm productivity. Nevertheless, 44% of the estimation results showed that the effect of education was either negative or not significantly different from zero if statistical significance is set to .05 level. Seventeen studies of entire studies showed that education had a positive effect in Asia. On the other hand, two of the entire studies estimated in their research were from Africa. One study had a negative effect, and the other showed no significant contribution of education on agricultural productivity, indicating that there is little evidence to support conclusively that education had a positive effect on agricultural productivity in Africa.
20
Table 4. Previous Studies about Effect of Education on Farm Productivity
Country and Author Data Dependent
Variable Estimated effect of education
13 Countries (Lockheed et al.,1980)
18 different studies in less developed countries
(37 sets of farm data)
Crop production
Four years of education presented
7.4% improvement in output. However, if statistical calculation was at the .05 level, only 56.4% showed
a positive and significant result
Nepal (Pudasaini, 1983)
205 sample from Tarai region and 149 sample from Hill region in Nepal
Crop production
Allocative effect is more important than worker effect
Taiwan (Wu, 1988) 51 households in seven villages Crop and livestock production
Four or more years of primary education had a positive and significant effect
21
Table 5. Previous Studies about Effect of Education on Farm Productivity in Africa
Country and Author Data Dependent Variable Estimated effect of education
Tanzania (Collier et al., 1986)
540 households surveyed in 1980
Crop and livestock production
Positive and significant effect in crop production but positive and insignificant in livestock production
Burkina Faso (Ram and Singh, 1988)
Kenya (Binsten, 1984) 51 households in seven villages 1613 farmers surveyed in 1974~1975
Crop and livestock production
Crop production
Four or more years of primary education had a positive and significant effect
1-4 years of schooling had a positive and significant impact. However, further schooling had a positive and
22
Chapter 3. Description of Study Area and Data
3.1. Mbale Context and Data
3.1.1 Characteristics of Study Area
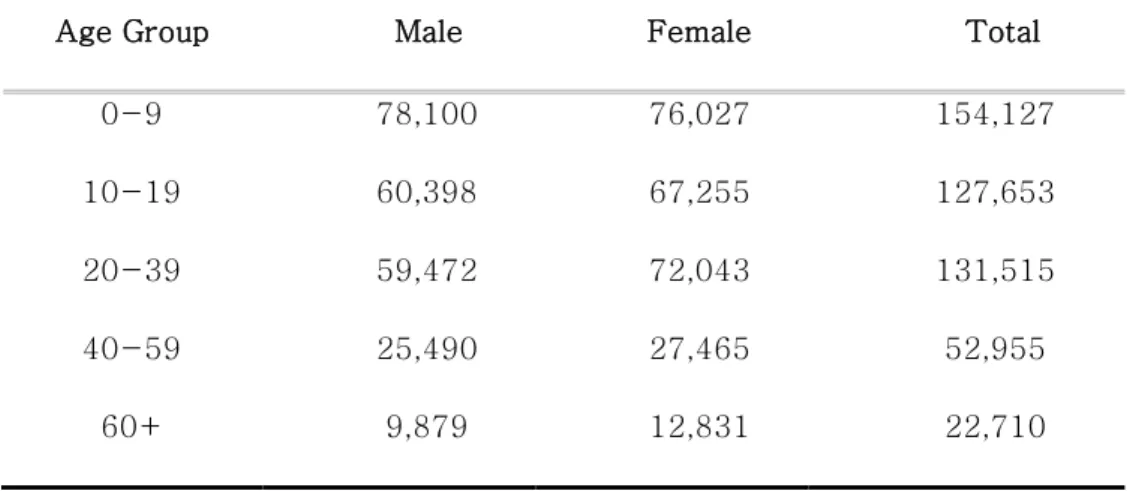
The survey was conducted in Mbale District located in the Eastern area of Uganda. It is currently composed of one county with 11 sub counties and divided into a lowland, an upland, and a mountain area (UBOS, 2014). The annual population growth rate in this region was 2.5 % according to UBOS report in 2012. The total population of Mbale was estimated at 488,960 in 2014 (UBOS, 2014). The distribution of total population by age and sex presents that younger population constitutes a high percentage in the district and more females than males as shown in Table 6 below.
Table 6. Total Population by Age and Sex, Mbale District
Age Group Male Female Total
0-9 78,100 76,027 154,127
10-19 60,398 67,255 127,653
20-39 59,472 72,043 131,515
40-59 25,490 27,465 52,955
23
Source: National Population and Housing Census (UBOS, 2014).
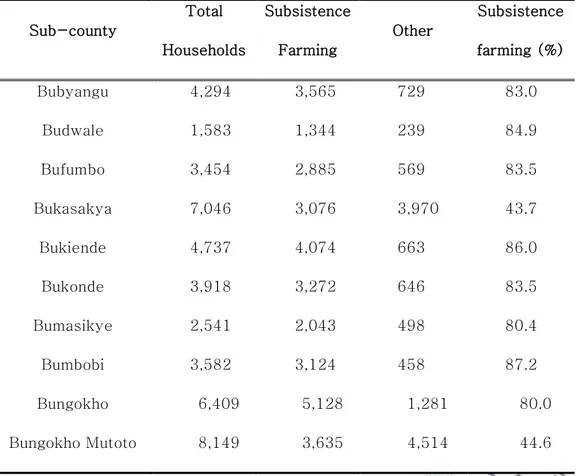
Total number of households and percent of household depend primarily on subsistence agriculture for each sub-county in Mbale district are reported in Table 7. The average percent of household surviving on subsistence farming is about 56 percent in this region. The statistics show how many households survive on farming as small scale farmers.
Table 7. Number of households by main source of livelihood
District 233,339 255,621 488,960 Sub-county Total Households Subsistence Farming Other Subsistence farming (%) Bubyangu 4,294 3,565 729 83.0 Budwale 1,583 1,344 239 84.9 Bufumbo 3,454 2,885 569 83.5 Bukasakya 7,046 3,076 3,970 43.7 Bukiende 4,737 4,074 663 86.0 Bukonde 3,918 3,272 646 83.5 Bumasikye 2,541 2,043 498 80.4 Bumbobi 3,582 3,124 458 87.2 Bungokho 6,409 5,128 1,281 80.0 Bungokho Mutoto 8,149 3,635 4,514 44.6
24
Source: National Population and Housing Census (UBOS, 2014).
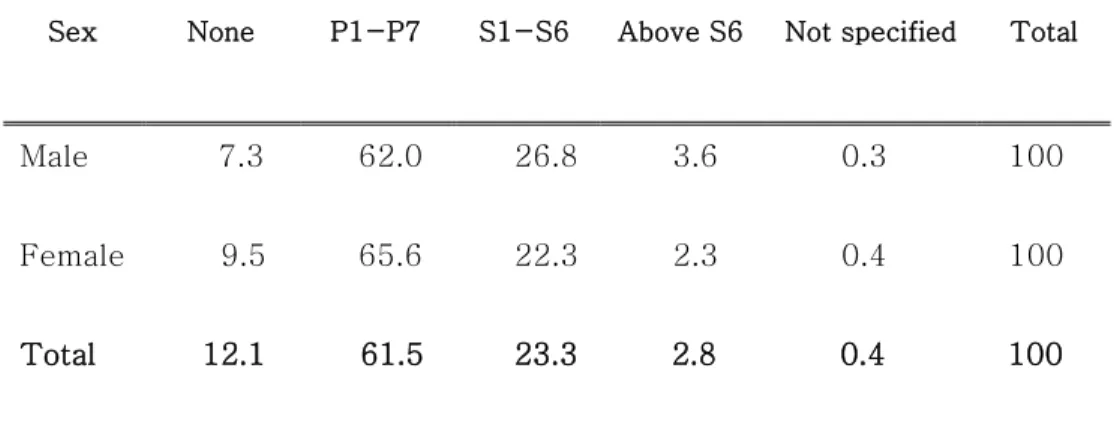
In Mbale, the primary economic activity is agriculture and a number of people dwell in rural areas. The percentage of the working population in the agricultural sector was 78.2 for male and 90.9 for female while percentage of male (7.4 percent) and female (16.7 percent) in urban areas working for agriculture is lower (UBOS, 2012). The other key variable for demonstrating demographic characteristics of the district is household size. The average household size in Mbale is 4.4. The education attainment by age and gender is also a critical characteristic in this study. In
Busano 3,176 2,821 355 88.8 Busiu 5,073 4,320 753 85.2 Busoba 4,393 3,770 623 85.8 Lukhonge 2,084 1,863 221 89.4 Lwasso 1,782 1,437 345 80.6 Nakaloke 4,640 2,665 1,975 57.4 Nakaloke Town Council 5,805 2,034 3,771 35.0 Namanyonyi 6,632 3,713 2,919 56.0 Nyondo 2,546 1,983 563 77.9 Wanale 2,759 2,566 193 93.0 District 108,813 61,277 47,536 56.3
25
Mbale district, less than 10 percent of both male and female are not educated while over 60 percent of the population are educated in primary school. Over 20 percent of the population attained secondary education. However, those who educated above secondary school are less than 5 percent of the population.
Table 8. Education Level by Age and Gender
(unit: schooling year)
Source: Mbale District Local Government Statistical Abstract (UBOS, 2012).
Mbale is traditionally one of the most fertile areas for agricultural activities. The major crops grown in this district include maize, beans, rice, coffee, potatoes, millet, cassava, and so on. According to the report of UBOS (2012), the average percentage of households in the district shows that their major crops are maize and bean. These crops are the most common grown crops in Mbale except Northern Division. In each sub-county, at least 30% of the household grow either maize or beans.
Sex None P1-P7 S1-S6 Above S6 Not specified Total
Male 7.3 62.0 26.8 3.6 0.3 100
Female 9.5 65.6 22.3 2.3 0.4 100
26
3.1.2 Data and Challenges
The data used in this study were obtained from a sample survey of households in Mbale district. The entire sample consists of 200 farm households which are randomly selected from several villages. This survey was conducted only with each head of the households or with the spouse of the head of each household aged 18~65. The researcher explained details of this study and gave farmers enough information about the reason for the study before conducting the survey. Furthermore, the researcher told farmers in advance about any possible risks or discomforts that they might have while participating in this survey and gave them enough time to think about participation. During the whole process, a coordinator working with the researcher translated English to their local language.
Each respondent was asked to report for the 2015 crop seasons on household characteristics, household income and expenditure, land holdings, quantities of crop production, sales, and home consumption, number of livestock owned by household, number of agricultural assets, transport, market participation as well as ask a few questions about extension services. For the crop production, each quantity is reported in kilograms. The gross farm revenue is
27
calculated by multiplying the quantities of farm production of crops multiplied by their unit price. Unit price was estimated by the median price using the data from some of the respondents who recorded on the survey sheet.
There were a few challenges regarding the response rates during the survey. The main rejection was made on households who did not report the necessary information such as the quantities of crop yields, income, and expenditure of the survey. In fact, these respondents were not able to remember the information. In addition, it was difficult to meet households for two reasons: they were working in the fields or visiting somewhere else. Thus, the sample used in the analysis after exclusion is 181 households.
Figure 2. Map of Uganda
28
3.2. Dependent Variables
Three dependent variables are selected in this study to estimate the major effects of agricultural extension that only a few studies have addressed successfully (Pudasaini, 1983). Most studies analyze one or two effects because of the lack of data such as household’s income and expenditure, and cost of inputs. Instead of measuring three effects of extension, a variety of studies use single crop production (Abdel-halim and Rowland 1976; Jamison and Lau, 1978). In order to examine the effects of extension on farm productivity, this study will use the following dependent variables provided in Table 9.
Table 9. Dependent Variables
Variables Explanation
Engineering Crop production
Gross revenue
(Maize, bean, and rice)
Market value of total farm production of crops and livestock
Value-added Gross farm revenue minus the cost of purchased inputs(Expenditures on farm and
29
Engineering function measures the impact on quantities of crop output, for example, kilograms of maize. The gross farm revenue includes the market value of farm crops and livestock. Specifically, gross revenues from crop yields and livestock are calculated by multiplying the quantities of crop yields and number of livestock multiplied by their unit cost. During the interviews of this study, households were asked to give information about the quantities of crop production, sales and home consumption, and unit price for each crop. Profit (Value-added) variable is required of the data of gross farm revenue and the cost of agricultural inputs.
3.3. Explanatory Variables
Three factors of production are considered in this study: land; labor; and capital. Thus, vector X contains six variables: land used in crop yield; man-hours of hired labor employed; man-hours of family labor; Market value of agricultural assets of farmers; schooling years of household head; and a number of extension contacts. Land was measured as cultivable size of land. Labor included two types of labors: men hired to work and household members working on the farm. Capital was measured as the value of agricultural assets and livestock. The studies reviewed on the extension and productivity control for factors that may affect the
30
output by including variables such as schooling and research (Birkhaeuser et al., 1991). In this study, formal schooling-year is included.
Table 10. Explanatory Variables
3.4. Descriptive Statistics
Ninety-six men and eighty-five women were interviewed during the survey aged 18-65. Average income from agricultural activities is 581.1 dollars in 2015, and household income from livestock is 145.7 dollars in 2015 on average. The average size of the household is 4.63, including children and average land size for
Variables Explanation
Land Land used in crop yield
Hired Labor
Average man-hours of hired labor employed during a year
Family Labor Average man-hours of family labor during a year
Capital Market Value of assets for farming plus market value of livestock
Education Schooling years of household head Extension Number of Extension contacts
31
cultivation is 1.58 acres. Man-hours of hired labor is about 416 hours a year. Man-hours of family labor is about 668 hours a year; thus the average-hour of family labor during a year is higher than that of hired labor. The average schooling years of household head is about 9.92 years ranged from 0 to 17. This means that the average number of households in the district graduated from primary school and attended about two years of secondary school education. It is common that the farmers in Uganda have extension service. The number of extension contacts ranged from 1 to 30 and with an average of 4.86 contacts a year. The table 10 reported the descriptive statistics of this study.
32
Table 11. Descriptive Statistics
Variable Description Mean SD
Dependent variable
ln Maize(kg) Log of Maize production(kg) 5.75 2.24
ln Bean(kg) Log of Bean production(kg) 4.49 2.16 ln Rice(kg) Log of Rice production(kg) 2.04 3.04
ln Rev
Log of the gross farm revenue(total earnings of crops
and livestock)
14.14 1.62
ln VA Log of profit(gross farm revenue minus the expenditure of crops
and livestock) 13.96 1.67
Explanatory Variable
Land Size of Land for cultivation (acre) 1.58 1.07
Hired labor Man-hours of hired labor
employed (during a year) 416.20 469.62 Family labor Man-hours of family labor(during
a year) 667.59 451.79
Capital
(US dollar) Market value of farm assets
and livestock 682.04 936.15
Education
Household head’s schooling-year 9.92 4.30
Extension Number of extension contacts 4.58 5.76
33
Chapter 4. Model Specification and Estimation
Method
4.1 Model Specification
According to the standard competitive theory, the perfect information assumption presents that the contribution to a factor is proportional, and marginal contribution to physical product is clear (Welch, 1970). However, for intangible factors such as education, it is difficult to measure the return to production. As a response to this constraint, past studies argued that other factors hold constant when the marginal product of education is estimated and emphasized the two values of education: worker effect and allocative effect. Worker effect is the marginal product of education, which refers to a worker’s capacity to yield more output, given education. Allocative effect is defined as the increased capacity to acquire right information about other inputs and to use them appropriately.
Welch (1970) emphasized the critical role of education as a factor of production. For the engineering function of a single commodity, we have a function of education where 𝑄 is physical output, 𝑋 is other inputs, and 𝐸 is education:
34
The marginal product of education, which indicates worker effect is therefore ∂𝑞
∂𝐸. We also consider gross sales function where 𝑝1 and 𝑝2 are the prices of each commodity, 𝑞1 and 𝑞2. These commodities refer to a function of the input vector 𝑋 and the quantity of 𝑋 used in producing each commodity includes 𝑥1 and 𝑥2.
𝑄 = 𝑝1𝑞1(𝑥1) + 𝑝2𝑞2(𝑥2), (2)
Equation (3) is presented to maximization of sales, 𝑄:
𝜕𝑄 𝜕𝑥1 = 𝑝1 𝜕𝑞1 𝜕𝑥1 − 𝑝2 𝜕𝑞2 𝜕𝑥2 = 0 (3)
Note that a function of education is 𝑥1= 𝑥1(𝐸). Therefore, the marginal product of education,
𝜕𝑄 𝜕𝐸= (𝑝1 𝜕𝑞1 𝜕𝑥1 − 𝑝2 𝜕𝑞2 𝜕𝑥2 )𝑑𝑥1 𝑑𝐸 (4)
is positive if it increases allocative capability.
Lastly, value-added function which combines worker effect and allocative effects is presented as 𝑄 = 𝑝𝑞(𝑋, 𝑍) − 𝑝𝑥𝑋, where physical product 𝑞1 and 𝑞2 are produced, and each is a function of three components: purchased inputs, X given inputs from individual farm, Z, and education 𝐸. The commodity prices can be expressed as 𝑝1
35
and 𝑝2. Equation (5) shows value-added function by education and other given inputs:
𝑄 = 𝑝1𝑞1(𝑥1, 𝑧1, 𝐸1) + 𝑝2𝑞2(𝑥2, 𝑧2, 𝐸2) − 𝑝𝑥𝑋. (5) where 𝑋 = 𝑥1+ 𝑥2 , 𝑍 = 𝑧1+ 𝑧2, 𝐸 = 𝐸1+ 𝐸2, and
1 =
𝑑𝐸1 𝑑𝐸+
𝑑𝐸2 𝑑𝐸,
0 =
𝑑𝑧1 𝑑𝐸+
𝑑𝑧2 𝑑𝐸, and
𝑑𝑋 𝑑𝐸=
𝑑𝑥1 𝑑𝐸+
𝑑𝑥2 𝑑𝐸.
As referred by Welch (1970), if value-added function include the total quantities of education and given inputs, 𝑄 = 𝑓(𝐸, 𝑍), the marginal product of education would be calculated as equation (6).
𝜕𝑄 𝜕𝐸= 𝑃2 𝜕𝑞2 𝜕𝐸2 + (𝑃1 𝜕𝑞1 𝜕𝐸1 − 𝑃2 𝜕𝑞2 𝜕𝐸2 )𝑑𝐸1 𝑑𝐸 + (𝑃1 𝜕𝑞1 𝜕𝑧1 − 𝑃2 𝜕𝑞2 𝜕𝑧2 )𝑑𝑧1 𝑑𝐸 (6) + (𝑃1 𝜕𝑞1 𝜕𝑥1 − 𝑃2 𝜕𝑞2 𝜕𝑥1 )𝑑𝑥1 𝑑𝐸 + (𝑃2 𝜕𝑞2 𝜕𝑥1 − 𝑃𝑥) 𝑑𝐸 𝑑𝐸
The first term in (6) indicates the marginal product of education, the worker effect. As past studies noted earlier, the worker effect in the engineering function is the ability to produce more output with the resources given at hand (Welch, 1970; Pudasaini, 1983). The next three terms refer to the returns from allocating three factors, education, given inputs, and purchased inputs efficiently. The last term shows effect of selecting the appropriate quantity of purchased input, 𝑋.
36
Following the model specifications, engineering production functions include only the worker effect. The gross revenue production functions reveal the worker effect as well as the effect of allocating inputs but exclude the effect of selecting the adequate quantities of inputs. Lastly, the profit or value-added production function includes all the returns. Earlier studies argued that allocative ability of education can be measured explicitly by the use of total derivatives or implicitly through value-added functions. This study attempts to estimate the impact of not only formal education but also non-formal education, extension on farmers’ production, revenue, and profit in Mbale district.
4.2 Estimation Method
In studies of the effect of extension and education on agricultural performance, regression methods typically have implemented to estimate production functions (Phillips, 1994). The Cobb-Douglas below is the most common production function used in most studies.
ln𝑌 = 𝛼0+ ∑ 𝛼𝑖𝑙𝑛𝑋𝑖+ 𝑏𝐸𝐷𝑈 + 𝑢, (7)
37
control variables, 𝐸𝐷𝑈 is educational variable, and 𝑢 is the error term. The 𝑏 indicates coefficient, measuring the effect of extension on farm productivity.
The engineering function for Mbale district, was represented by maize, bean, and rice production functions. These three products were selected since they are the most dominant crops of Mbale, respectively. The specification of the following form is to be estimated for each crop:
𝑙𝑛𝑌 = 𝑙𝑛𝑐 + 𝛽𝐿𝑙𝑛𝐿 + 𝛼𝐻𝐿𝑙𝑛𝐻𝐿 + 𝛽𝐹𝐿𝑙𝑛𝐹𝐿+ 𝛽𝐶𝑙𝑛𝐶 (8) +𝛽𝐸𝐷𝑈𝑙𝑛𝐸𝐷𝑈 + 𝛽𝐸𝑋𝑙𝑛𝐸𝑋 + u,
In this function, 𝑌 is a quintal of maize, bean, and rice production in study area, respectively, 𝐿 is cultivated size of land for each crop, 𝐻𝐿 is man-hours of available hired labor for each crop during a year, 𝐹𝐿 is man-hours of available family labor for each crop during a year, 𝐶 is the market value of agricultural assets including livestock, 𝐸𝐷𝑈 is a continuous variable of household head’s schooling year, and 𝐸𝑋 is number of extension contacts during a recent year. All variables are expressed in logarithmic form.
In addition, gross revenue function is to be estimated in this study. The following form (9) indicates what variables included to
38
estimate the function:
𝑙𝑛𝑌 = 𝑙𝑛𝑐 + 𝛽𝐿𝑙𝑛𝐿+𝛼𝐻𝐿𝑙𝑛𝐻𝐿 + 𝛽𝐹𝐿𝑙𝑛𝐹𝐿+𝛽𝐶𝑙𝑛𝐶 (9) +𝛽𝐸𝐷𝑈𝑙𝑛𝐸𝐷𝑈 + 𝛽𝐸𝑋𝑙𝑛𝐸𝑋 + u,
In gross revenue function, 𝑌 is gross farm revenue including the market value of each crop yields and livestock that each household owns. According to Pudasaini (1983), the gross farm revenue indicates market value of total farm production of crops and livestock, and off-farm earnings. However, this study excludes off-farm earnings.
The value-added function of the following form is to be estimated in this study:
𝑙𝑛𝑌 = 𝑙𝑛𝑐 + 𝛽𝐿𝑙𝑛𝐿 + 𝛽𝐹𝐿𝑙𝑛𝐹𝐿+ 𝛽𝐶𝑙𝑛𝐶 (10) +𝛽𝐸𝐷𝑈𝑙𝑛𝐸𝐷𝑈 + 𝛽𝐸𝑋𝑙𝑛𝐸𝑋 + u,
where 𝑌 in value-added function is gross farm revenue minus the cost of purchased inputs, such as fertilizer and seeds. In this study, gross farm revenue minus farm and livestock expenses indicates dependent variable, 𝑌 . The explanatory variables exclude hired labor variable as it represents the cost of purchased input.
39
Chapter 5. Empirical Results
5.1 The Estimates from Engineering Functions
This study firstly separated effects on farm output into three main single outputs: maize, bean, and rice production that most farmers in Mbale district grow for their home consumption and sales. A few estimates from the engineering functions had significant contributions to the maize production: land, man-hour of family labor during a year, and market value of the agricultural assets including livestock, which is called capital in this study. It indicates that these are important inputs in the maize cultivation. Interestingly, hired labor had significant impact on each single output while family labor only contributed to maize production, indicating that each production mostly depends on hired labor. In addition, capital was a crucial input only in maize production.
Education is reported as positive in maize production. However, its coefficient in both bean and rice production were negative. As table 12 shows, education had no significant impact on each agricultural output. This suggests that household head’s education level may not be crucial in this environment. Meanwhile, extension had significant contributions with positive coefficients on both bean and rice output. The result means that extension may enhance
40
farmer’s capacity to use several technologies required, especially for bean and rice cultivation. The estimated result of engineering production functions implies that extension service itself had no impact on the maize production while its contribution is significant both on bean output and rice cultivation. Since maize is acknowledged as the most dominant crop to consume in the study area, most farmers may already know how to produce as much as they possibly can. However, rice may be different from maize since bean and rice have a higher value in market in Mbale district. Especially, rice is one of the cash crops in this region.
41
Table 12. Estimates from Engineering Production Functions
Note: Number in parentheses are standard errors. ***, **, * designate significance at 1%, 5%, and 10%, respectively Explanatory Variables Engineering (Maize) Engineering (Bean) Engineering (Rice) Constant -0.882** (0.357) -0.522 (0.396) -0.476 (0.040) Land size for cultivation(𝑚2): L 0.731*** (0.043) 0.060*** (0.039) 0.756*** (0.035) Man-hours of hired labor employed(year) : HL_HOUR 0.070** (0.036) 0.088*** (0.032) 0.010*** (0.038) Man-hours of family labor (year): FAM_HOUR 0.043 (0.046) 0.014 (0.468) -0.014 (0.032) Market value of farm asset: C 0.040** (0.017) 0.031 (0.027) 0.003 (0.003) Education (Schooling-year): EDU 0.012 (0.019) -0.012 (0.018) -0.001 (0.004) Number of extension contacts: EX 0.006 (0.010) 0.023* (0.013) 0.007** (0.029) 𝑅2 0.8042 0.7985 0.9912 Number of obs. 181 181 181
42
5.2 The Estimates from Gross Revenue and Profit Functions
First of all, the estimates from gross revenue production functions present that only land and extension variables made a significantly positive contribution on gross farm revenue. It is the general idea that if cultivated land size is larger, more output can be produced, and more products are sold in markets. Agricultural extension seems to be a crucial contributor in this environment as well. If household head attains more extension training during a year, his or her gross farm revenue will be higher in this context. However, household head’s schooling year had no significant impact on gross revenue. It means informal education is more critical than formal education in terms of agricultural productivity in Mbale district.
The results from the profit production approaches indicate that land, education, and extension significantly contributed to household’s profit. In these functions, estimates of hired labor variable was excluded since it indicates the cost of input. Education, on the other hand, has negative coefficient with significant impact on the profit. Overall, education seems to have a weak influence and poor direct impact on agricultural activities. Even though education had no contributions to production and market activities, the
43
estimation result indicates that more trained farmers through extension can enhance their ability to improve technical efficiency and make more profit.
Table 13. Estimates from Gross Revenue and Value-added Functions
Note: Number in parentheses are standard errors. ***, **, * designate significance at 1%, 5%, and 10%, respectively.
Explanatory
Variables Gross Farm Revenue Profit
Constant 4.145*** (1.131) 3.973 (1.205) Land size for cultivation(𝑚2): L 1.028*** (0.140) 0.973*** (0.223) Man-hours of hired labor employed(year) : HL_HOUR 0.080 (0.050) Man-hours of family labor (year): FAM_HOUR 0.046 (0.032) 0.020 (0.337) Market value of farm asset: C 0.029 (0.019) 0.011 (0.085) Education (Schooling-year): EDU 0.008 (0.028) -0.005* (0.003) Number of extension contacts: EX 0.037** (0.017) 0.004*** (0.018) 𝑅2 0.3142 0.3100 Number of obs. 181 169
44
Chapter 6. Summary and Conclusion
The primary objective of this research was to estimate effects of extension in Uganda and see if it raises agricultural productivity with the measurement of output referred by Welch (1970). This study also examined the contribution of education in rural areas in Mbale district of Uganda to farmers’ performance by estimating three production functions: engineering functions, gross revenue functions, and value-added functions.
Extension service is one of critical components of rural development, and has been presented to contribute to the reduction of hunger and poverty by increasing adoption of improved technologies, and capacity of individual farmers. The agricultural technical information delivered by extension enables the farmers to increase capability to adopt new technologies and inputs. In Uganda, agricultural extension has reformed over the time period through a number of implementations in order to increase agricultural performance by empowering farmers to demand them. According to Gautam (2000), impact of agricultural extension on higher return in the economy has been low and evaluated as an ineffective strategy to raise agricultural productivity throughout Africa. In the case of Uganda, the reputation of extension was the same with the
45
evaluation of its program in Africa. Faced with ineffective results from extension service, the government of Uganda reformed the design in NAADS in 2008, with an aim of transferring effective agricultural extension services to farmers in rural areas (Betz, 2009). Following this shift from ineffective program to effective extension delivery, this research found that delivering extension service at least in the study area are significantly effective on output increases, gross farm revenue, and profit.
The estimated results from engineering, gross revenue, and profit production functions showed that agricultural extension service had a significantly positive impact on bean and rice production, gross farm revenue, and profit except for maize output. The results indicate extension is the critical factor of enhancing farmer’s direct productivity to the agricultural output. Furthermore, agricultural extension seems to be the important contributor in generating more income and profit. The result presented is that if household’s head access to extension increases, his or her gross farm revenue and profit increases.
This study also estimated the effects of education in Uganda, using household’s data from the survey. A number of past studies found empirical evidences that education raise agricultural output. Lockheed et al. (1980) noted that crop output increased by 7
46
percent by four years of primary schooling. However, existing evidence on the effect of education on farm performance in Africa was not sufficient. Only few studies estimated the worker effect and allocative effect of the education on agriculture in sub-Saharan Africa countries. In addition, the impact of education on return in Africa was evaluated as an ineffective strategy to raise agricultural productivity, with the insignificant estimates. The results of this study showed that education has limited impacts on farm production and gross farm revenue as various literatures indicated. It only significantly contributed to agricultural profit. Nevertheless, negative coefficient on education did not lend much support for hypothesis of this study. As a result, decomposing effects into worker, input-allocative, and input-selection effects and comparing the marginal effects remained key challenges of the study.
According to the previous literature, each coefficient of education indicates the marginal value product estimated from production functions (Pudasaini, 1983). Following by the method of estimating each effects of education, three worker effects from each engineering functions can be calculated. In addition, input-allocation effect and input-selection effect can be computed from gross revenue functions, Lastly, the total effects were able to be measured from value-added functions. The entire process enables
47
us to acknowledge which effects are the most crucial to each product function. However, estimating three effects of education in the study area remained a difficult task since the results from each production functions except profit production functions presented that education was ineffective on agricultural activities, Instead, extension had a significant impact on each production functions except maize production. Thus, additional research is required in order to explain further effects of educations.
This research conducted the survey in Uganda in 2016 concerning the effect of extension service and education on farm productivity. In the data sets, most of the estimated results of the formal education were found to have a negative and insignificant effect. On the other hand, extension was revealed to be a more critical contributor than formal education in terms of agricultural productivity in Mbale district of Uganda. This positive result that emerges from the findings is that at least extension in the study areas overcomes many challenges such as lack of response to farmers’ needs and non-participatory approaches. Though the estimated results for the formal education was mostly negative or statistically insignificant, the uncontrolled effect of the education such as farmers’ capacity to learn more techniques and various skills could have a positive contribution to farm productivity.
48
Generally, the estimation of the effects of education is a complicated task since there are many factors that affect the agricultural production. In addition, education itself is difficult to measure accurately because the effects of education can be cumulative. The researcher found the ground of the result in the real circumstances in East Africa. The education is likely to face the following constraints: lack of funding to have more capital, insufficient number of teachers, unsatisfactory qualities of classroom, lack of transport, lack of materials to teach. Thus, impact of education on farmer’s livelihood in Mbale district might be able to capture only a few portions of the overall contribution in econometric studies. However, this study contributes to analyzing effects of agricultural extension and education on farm productivity in Africa country and revealing extension to be a more critical contributor than formal education in terms of agricultural productivity in Mbale district.
49
References
ABDEL‐HALIM, A. A., & Rowland, K. M. (1976). Some personality determinantsof the effects of participation: A further investigation. Personnel Psychology, 29(1), 41-55.
Anderson, J., & Van Crowder, L. (2000). The present and future of public sector extension in Africa: contracting out or contracting in?. Public Administrationand Development, 20(5), 373-384.
Anderson, J.R., & Feder, G. (2003). Rural Extension Services. World Bank Policy Research Working Paper 2976. Washington, DC: World Bank.
Anderson, J. R., & Feder, G. (2004). Agricultural extension: Good intentions and hard realities. The World Bank Research Observer, 19(1), 41-60.
Appleton, S., & Balihuta, A. (1996). Education and agricultural productivity: evidence from Uganda. University of Oxford, Centre for the Study of African Economies.
Betz, M. (2009, July). The effectiveness of agricultural extension with respect to farm size: the case of Uganda. In Paper provided by Agricultural and Applied Economics Association in its series 2009 Annual Meeting.
Birkhaeuser, D., Evenson, R. E., & Feder, G. (1991). The economic impact of agricultural extension: A review. Economic development and cultural change, 39(3), 607-650.
Elias, A., Nohmi, M., Yasunobu, K., & Ishida, A. (2013). Effect of Agricultural Extension Program on Smallholders' Farm Productivity: Evidence from Three Peasant Associations in
50
the Highlands of Ethiopia. Journal of Agricultural Science, 5(8), 163.
Evenson, R. E., Pray, C., & Rosegrant, M. W. (1998). Agricultural research and productivity growth in India (Vol. 109). Intl Food Policy Res Inst.
Fane, G. (1975). Education and the managerial efficiency of farmers. The Review of Economics and Statistics, 452-461.
Gautam, M. (2000). Agricultural extension: The Kenya experience: An impact evaluation. World Bank Publications.
Hakiza, J. J., Odogola, R. W., Mugisha, J., Semana, A. R., Nalukwago, J., Okoth, J., & Ekwamu, A. (2004). Challenges and prospects
of disseminating technologies through farmer field schools: Lessons learnt based on experience from Uganda. Uganda Journal of Agricultural Sciences, 9(1, pt. 1), 163-175. Huffman, W. E. (1976). The value of the productive time of farm
wives: Iowa, North Carolina, and Oklahoma. American Journal of Agricultural Economics, 58(5), 836-841.
Huffman, W. E. (1978). Assessing returns to agricultural extension. American Journal of Agricultural Economics, 60(5), 969-975.
Jamison, D. T., & Lau, L. J. (1982). Farmer education and farm efficiency. Published for the World Bank [by] Johns Hopkins University Press.
Jamison, D. T., & Moock, P. R. (1984). Farmer education and farm efficiency in Nepal: The role of schooling, extension services,
and cognitive skills. World Development, 12(1), 67-86. Khaldi, N. (1975). Education and allocative efficiency in US
51
agriculture. American Journal of Agricultural Economics, 57(4), 650-657
Kraybill, D., & Kidoido, M. (2009). Analysis of relative profitability of key Ugandan agricultural enterprises by agricultural production zone. International Food Policy Research Institute (IFPRI).
Lockheed, M. E., Jamison, T., & Lau, L. J. (1980). Farmer education and farm efficiency: A survey. Economic development and cultural change, 29(1), 37-76.
Mangheni, M., Mutimba, J., & Biryabaho, F. (2003, August). Responding to the Shift from Public to Private Contractual Agricultural Extension Service Delivery: Educational Implications of Policy Reforms in Uganda. In 19th Annual AIAEE Conference, Raleigh, North Carolina, 8_12 April. McDowell, M. S. (1929). What the Agricultural Extension Service
Has Done for Agriculture. The Annals of the American Academy of Political and Social Science, 142(1), 250-256. Minten, B., Randrianarisoa, J. C., & Barrett, C. B. (2007).
Productivity in Malagasy rice systems: wealth‐differentiated constraints and priorities. Agricultural Economics, 37(s1), 225-237.
Morris, M. L. (2007). Fertilizer use in African agriculture: Lessons learned and good practice guidelines. World Bank Publications.
National Agricultural Advisory Services (NAADS). (2001). Programme Implementation Manual.
Omilola, B. (2009). Estimating the impact of agricultural technology on poverty reduction in rural Nigeria (Vol. 901). Intl Food Policy Res Inst.