저작자표시-비영리-변경금지 2.0 대한민국 이용자는 아래의 조건을 따르는 경우에 한하여 자유롭게 l 이 저작물을 복제, 배포, 전송, 전시, 공연 및 방송할 수 있습니다. 다음과 같은 조건을 따라야 합니다: l 귀하는, 이 저작물의 재이용이나 배포의 경우, 이 저작물에 적용된 이용허락조건 을 명확하게 나타내어야 합니다. l 저작권자로부터 별도의 허가를 받으면 이러한 조건들은 적용되지 않습니다. 저작권법에 따른 이용자의 권리는 위의 내용에 의하여 영향을 받지 않습니다. 이것은 이용허락규약(Legal Code)을 이해하기 쉽게 요약한 것입니다. Disclaimer 저작자표시. 귀하는 원저작자를 표시하여야 합니다. 비영리. 귀하는 이 저작물을 영리 목적으로 이용할 수 없습니다. 변경금지. 귀하는 이 저작물을 개작, 변형 또는 가공할 수 없습니다.
A THESIS FOR THE DEGREE OF MASTER OF SCIENCE
Predicting Transpiration Rates of Hydroponically-Grown
Paprika Plants via an Artificial Neural Network Using
Environmental and Growth Factors in Greenhouses
환경 및 생육 변수를 이용한 인공신경망 기반
수경재배 파프리카의 증산속도 추정
BY
DU SUNG NAM
FEBRUARY, 2019
MAJOR IN HORTICULTURAL SCIENCE AND
BIOTECHNOLOGY
DEPARTMENT OF PLANT SCIENCE
GRADUATE SCHOOL
COLLEGE OF AGRICULTURE AND LIFE SCIENCES
SEOUL NATIONAL UNIVERSITY
Predicting Transpiration Rates of Hydroponically-Grown
Paprika Plants via an Artificial Neural Network Using
Environmental and Growth Factors in Greenhouses
UNDER THE DIRECTION OF DR. JUNG EEK SON
SUBMITTED TO THE FACULTY OF THE GRADUATE SCHOOL OF SEOUL NATIONAL UNIVERSITY
BY DU SUNG NAM
DEPARTMENT OF PLANT SCIENCE
COLLEGE OF AGRICULTURE AND LIFE SCIENCES SEOUL NATIONAL UNIVERSITY
FEBRUARY, 2019
APPROVED AS A QUALIFIED THSIS OF DU SUNG NAM FOR THE DEGREE OF MASTER OF SCIENCE
BY THE COMMITTEE MEMBERS
CHAIRMAN:
VICE-CHAIRMAN:
MEMBER:
JUNG EEK SON, Ph.D. KI SUN KIM, Ph.D. ㅖ
i
Predicting Transpiration Rates of Hydroponically-Grown
Paprika Plants via an Artificial Neural Network Using
Environmental and Growth Factors in Greenhouses
Du Sung Nam
Department of Plant Science, Graduate School of Seoul National University
ABSTRACT
Environmental and growth factors are important variables that affect the transpiration rate of plants. However, it is not easy to use all these factors for estimating the transpiration rate. Artificial neural networks (ANNs) are useful tools for obtaining meaningful results from complex non-linear data. The objective of this study was to compare the transpiration rate estimated by the Penman-Monteith equation (P-M) and that by an ANN, and finally to analyze the estimation accuracy by the ANN according to data collection period. Paprika (Capsicum annuum L. cv. Scirocco) was cultivated for two cropping periods in a year. Environmental factors such as solar radiation, temperature, relative humidity, CO2 concentration, electrical conductivity, pH, and substrate temperature were collected every minute during cropping periods, and the growth factor, leaf area index (LAI) was measured every 2 weeks. An ANN consisting of an input layer using eight environmental and growth factors, five
ii
hidden layers, and an output layer was constructed for estimating the transpiration rate. As a result, the ANN had higher accuracy than the P-M equation and increased the accuracy by adding root-zone environmental variables to the aerial ones. The R2 value was 0.88 for ANN and 0.73 for P-M when using one-year data of averaged daily values, whereas they were 0.84-0.93 for ANN and 0.79-0.83 for P-M when using seasonal data with the same values. In particular, the ANN using a 10-minute average values showed high accuracy of 0.95-0.96 regardless of collection period and season. In addition, the RMSE values of the ANN trained by the whole period, cropping period, and seasonal data were 0.07-0.10, 0.07-0.09, and 0.07-0.09, respectively. Therefore, it is confirmed that the ANN can accurately estimate the transpiration rate at a specific time with data from the entire cultivation period regardless of season and cropping period. In addition, the estimation accuracy could be improved by adding root-zone environmental factors to aerial ones. This method can be applied for efficient irrigation strategies in soilless cultures.
Additional key words: cropping period, root-zone, season, sweet pepper
iii
CONTENTS
Page
ABSTRACT
i
CONTENTS
iii
LIST OF TABLES
iv
LIST OF FIGURES
V
INTRODUCTION
1
LITERATURE REVIEW
4
MATERIALS AND METHODS
6
RESULTS AND DISCUSSION
17
CONCLUSION
33
LITERATURE CITED
34
iv
LIST OF TABLES
Page
Table 1. Average ranges of the input factors of the artificial neural network.
7
Table 2. Parameters used in the artificial neural network with the Adams optimizing method.
14
Table 3. Number of data points used for the Penman-Monteith equation (P-M) and the artificial neural network (ANN) when estimating the transpiration rate using different average time units and data-collecting periods.
16
Table 4. Comparison of the coefficients of determination (R2) between the Penman-Monteith equation (P-M) and the artificial neural network (ANN) when estimating the transpiration rate (g·d-1) using different data-collecting periods.
v
LIST OF FIGURES
Page
Fig. 1. Daily accumulated incident solar radiation and daily mean temperature in the greenhouse during the growth period from Aug 2017 to Jul 2018.
9
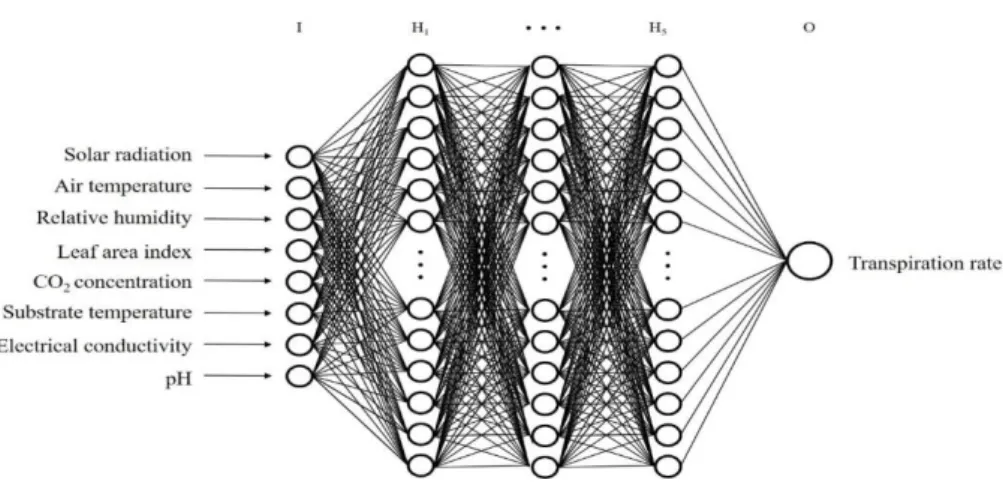
Fig. 2. Structure of an artificial neural network (ANN) including an input layer (I), hidden layers (H1–5), and an output layer (O). Each hidden layer had 512 perceptrons.
13
Fig. 3. Estimation of leaf area index (LAI) of paprika grown in a glasshouse according to days after transplanting (DAT) for two cropping periods.
18
Fig. 4. Validation accuracies of the trained ANN using aerial and aerial with root-zone environmental factors at different time steps.
23
Fig. 5. Comparison of transpiration rates (Tr) measured and estimated by the artificial neural network for the whole year (n=9138).
25
Fig. 6. Comparison of transpiration rates (Tr) measured and estimated by the artificial neural network for different cropping periods of high (A, n=5250) and low (B, n=3887) solar radiation.
vi
Fig. 7. Comparison of transpiration rates (Tr) measured and estimated by the artificial neural network for spring (A, n=2880), summer (B, n=2370), autumn (C, n=2084), and winter (D, n=1804).
27
Fig. 8. Chronological comparisons of transpiration rates (Tr) between those measured and those estimated by the trained ANN using whole-year data for days in spring (A; Apr 07 and LAI=1.5), summer (B; Jun 21 and LAI=3.6), autumn (C; Sep 10 and LAI=1.5), and winter (D; Jan 09 and LAI=3.4).
30
Fig. 9. Chronological comparisons of transpiration rates (Tr) between those measured and those estimated by the trained ANN for the different cropping periods of high and low solar radiations for days in spring (A; Apr 07 and LAI=1.5), summer (B; Jun 21 and LAI=3.6), autumn (C; Sep 10 and LAI=1.5), and winter (D; Jan 09 and LAI=3.4).
31
Fig. 10. Chronological comparisons of transpiration rates (Tr) between those measured and those estimated by the trained ANN using seasonal data for days in spring (A; Apr 07 and LAI=1.5), summer (B; Jun 21 and LAI=3.6), autumn (C; Sep 10 and LAI=1.5), and winter (D; Jan 09 and LAI=3.4).
1
INTRODUCTION
Water plays an important role in the growth and development of a crop from photosynthesis and other metabolic processes (Hsiao and Xu, 2000; Jolliet and Bailey, 1992). Thus, inadequate water management in crop cultivation can have negative effects on yield and quality of crops. For example, excess water can cause a fall or crack in fruits, and a lack of water can reduce the production of crops (Antony and Singadhupe, 2004; Moreno et al., 2003; Sezen et al., 2006). Therefore, precise irrigation control is crucial for improvement of crop productivity, although the response to water stress greatly varies with crop species (Osakabe et al., 2014). In cultivation of paprika, precise irrigation control is needed more than with other crops because the plants are especially sensitive to water stress (Shin et al. 2012; Smittle et al., 1994). Currently, soilless cultures are used to improve productivity and quality, and moisture control of the growth media is important to prevent moisture stress to crops (De Boodt and Verdonck, 1972). Therefore, accurate estimation of water demand of crops is required to improve the accuracy of irrigation control (Shin et al., 2014).
Currently, irrigation is controlled using transpiration amount (Jolliet, 1994; Jolliet and Bailey, 1992; Medrano et al., 2005; Ta et al, 2011). The water demand of plants can be approximated by its transpiration rate because most of the water absorbed by plants is transported to and transpired from the leaves.
2
For estimating transpiration, the Penman-Monteith equation (P-M) with meteorological data of cultivation environments has been used (Baille et al., 1994) and extensively applied from a single leaf to whole canopies of a variety of crops (Jolliet and Bailey, 1992; Boulard and Jemaa, 1993; Hamer, 1996). However, since most of the studies related to the P-M focused on the estimation of transpiration in fields, it is not easy to apply it to estimation of transpiration in restricted spaces, such as greenhouse and soilless culture (Aubinet et al., 1989; Shin et al., 2012).
To solve this problem, an artificial neural network (ANN) can be a useful tool because it has shown meaningful results from complex nonlinear data (Vaidyanathan et al., 2015; Taormina and Chau, 2016; Wang et al., 2016). Nam et al. (2017) obtained higher accuracy in estimating the transpiration rate by using aerial environmental factors and a growth factor compared to the P-M. However, transpiration is affected by not only environmental factors, but also other various factors. Root-zone environments can be regarded as immediate response factors to transpiration rate because electrical conductivity directly affects the root-zone water potential (Shani et al., 2005). Furthermore, transpiration was different according to cropping period under different radiation conditions (Medrano et al., 2005). In regions experiencing the typical four seasons, seasonal climate also affected transpiration pattern throughout the cultivation period (Shin et al., 2011). Therefore, transpiration models that
3
include various factors, such aerial and root-zone environmental factors, growth factors, cropping period, and seasons, are required.
The objective of this study was to compare the transpiration rates of hydroponically-grown paprika estimated by the P-M and an ANN, and finally to analyze the estimation accuracy of the ANN according to data collection period.
4
LITERATURE REVIEW
Artificial Neural Network (ANN)
The artificial neural network (ANN), which has recently been spotlighted, is known as a useful tool for obtaining meaningful results from complex nonlinear data (Vaidyanathan et al., 2015; Taormina and Chau, 2016; Wang et al., 2016). The ANN was first introduced in the 1980s, and at that time it was frequently used until the early 2000s for making simple estimations using small structures. However, requirements of huge amounts of data and computation were regarded as disadvantages for learning complex estimations. Fortunately, since 2009, The ANN has been actively researching again with the emergence of hardware that has a lot of data and superior computational power compared to previous generations. In addition, since ANN can derive reliable estimates from raw data, it has recently been applied to a variety of fields (LeCun et al., 2015). In particular, ANN can obtain reliable values in estimating by using the environmental factors (Nam et al., 2017; Moon et al., 2018; Qing et al., 2018; Dursun et al., 2014; Wang et al., 2017).
Transpiration Model
The Penman-Monteith equation based on a combination of an energy balance and an aerodynamic formula was well known modeling method to estimate the transpiration (Monteith, 1990). The Penman-Monteith equations
5
have been extensively studied from a single leaf to whole canopies for a variety of crops (Stanghellini, 1987; Jolliet and Bailey, 1992; Boulard and Jemaa, 1993; Hamer, 1996) and developed. Likewise, Medrano et al. (2005) divided the low radiation condition and the high radiation condition to get each model parameters for improving accuracy in Penman-Monteith equation. And also compensated Penman-Monteith equation was suggested for considering the guard cell closing under too high radiation conditions (Shin et al., 2014). However, since most of the studies related to the Penman-Monteith equation focus on the estimation of the transpiration in the fields, it is not easy to consider environmental changes in a limited space of the greenhouse (Aubinet et al., 1989).
6
MATERIALS & METHODS
Cultivation Conditions
Experiments were carried out in a Venlo-type greenhouse located at the Seoul National University experimental farm (37.3° N, 127.0° E), and the experimental crop was paprika (Capsicum annuum L. cv. Scirocco). The plants were grown for two cropping periods in one year. The plants were seeded in rockwool cubes in the seedling chamber on Jul 5, 2017 for Cropping period 1 and on Jan 4, 2018 for Cropping period 2. After 30 days, the plants were transplanted to rockwool slabs (Rock wool, Grotop, Grodan, Roermond, Netherlands) on Aug 4, 2017 and Feb 5, 2018, respectively. The plants were grown at a planting density of 4 plants∙m-2 and pruned to maintain two main stems trellised vertically. The greenhouse environments were maintained during the growth period as shown in Table 1. The irrigation system was controlled by the cumulative solar radiation adjusted according to Shin et al. (2014). When the cumulative solar radiation reached 50 J·cm-2, 100 mL of nutrient solution per dripper was irrigated. PBG solution from the Netherlands was used in the open-loop cultivation system.
7
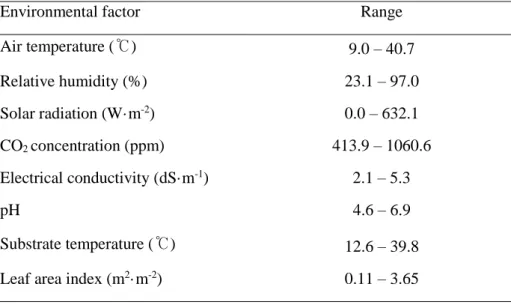
Table 1. Average ranges of the input factors of the artificial neural network.
Environmental factor Range
Air temperature (℃) 9.0 – 40.7 Relative humidity (%) 23.1 – 97.0 Solar radiation (W·m-2) 0.0 – 632.1 CO2 concentration (ppm) 413.9 – 1060.6 Electrical conductivity (dS·m-1) 2.1 – 5.3 pH 4.6 – 6.9 Substrate temperature (℃) 12.6 – 39.8 Leaf area index (m2·m-2) 0.11 – 3.65
8
Collection of Environmental and Growth Data
Aerial and root-zone environmental data were collected by a temperature and humidity sensor (AQ3020, Aosong Electronics, Guangzhou, China), CO2 sensor (SH-300-NDC, SOHA TECH, Seoul, Korea), EC sensor (DCF-1, DIK Electronics, Bucheon, Korea), pH sensor (DPH-1, DIK Electronics, Bucheon, Korea), substrate temperature sensor (HTS-30, Woosung Hitec, Yangsan, Korea), and pyranometer (SP-110-L10, Apogee, Logan, UT, USA). The measured data were collected into a data logger (CR1000, Campbell Scientific, Logan, UT, USA). The EC and pH sensors were installed in the drain pipe. The average cumulative solar radiation per day and mean air temperature in the greenhouse during the growing period are shown in Fig. 1. Leaf area was measured in three plants every two weeks, and the leaf area index (LAI) was modeled using the Boltzman sigmoid equation (Motulsky and Christopoulos, 2003).
9
Fig. 1. Daily accumulated incident solar radiation and daily mean temperature in the greenhouse during the growth period from Aug 2017 to Jul 2018.
10
Measurement and Calculation of Transpiration Rate
The plants on rockwool slab were placed on a rectangular aluminum profile. The profile including plants and two-level trellis supporting lines was weighed by load cells (SWSR-400, Woosung Hitec, Yangsan, Korea) every minute. Underneath the profile, additional load cells were placed to measure irrigation and drainage weights. Then, the transpiration rate was calculated using Eq. 1.
𝑇𝑟 = ∆𝐼𝑟 − ∆𝐷𝑟 − ∆𝑆𝑏
(Eq. 1)where Tr is the transpiration rate, Ir is the weight of irrigation, Dr is the weight of drainage, and Sb is the weight of substrate.
Estimation of transpiration rate by the Penman-Monteith equation
(P-M)
For estimating the transpiration rate of the plants, a modified P-M equation (Monteith, 1990; Shin et al., 2014) using compensated solar radiation (RAD) was used (Eq. 2).
11
where k is the extinction coefficient, LAI is the leaf area index (m2·m-2) estimated by the model equation, VPD is the vapor pressure deficit (kPa), and a and b are parameters. k, a, and b were estimated at different periods: 9.045, 0.002, and 0.205 for spring; 0.150, 0.012, and 0.087 for summer; 4.445, 0.008, and 0.481 for autumn; 0.769, 0.010, and 0.063 for winter; 2.644, 0.004, and 0.111 for Cropping period 1; 4.455, 0.008, and 0.481 for Cropping period 2; and 3.586, 0.008, and 0.235 for the whole year, respectively.
Estimation of Transpiration Rate by the ANN
The structure of the ANN was selected for the experiment (Fig. 2). For input variables of the ANN, air temperature, relative humidity, CO2 concentration, and solar radiation were used as aerial environmental factors; EC, pH, and substrate temperature as root-zone environmental factors; and leaf area index (LAI) as a growth factor (Table 1). The ANN consisted of five hidden layers with 512 perceptrons and one output layer for transpiration rate. The active function f(x) uses the Rectified Linear Unit (ReLU) function, where x corresponds to the input value assigned to each perceptron. The decision coefficients were used to confirm the accuracy of the ANN estimates.
For training of the ANN, the AdamOptimizer was used as a model optimization method (Kingma and Ba, 2014), and the coefficients before learning were set to commonly used values (Table 2). The average values of
12
the environment factors and a growth factor at minimum intervals of 10 min were used by considering the accuracy of sensors and the plant response to environmental factors. A total of 31,033 data points per 10 min of the aerial and root-zone environmental factors and the growth factor were selected. Then, 70% and 30% of selected data were used for training and validation, respectively. The training data allowed generalization of the ANN such that the error was reduced through the function of the hidden layer perceptrons, and the validation data were used to confirm the accuracy of the ANN. The validation data were randomly allocated through a random number generator to avoid concentration in a certain period of time. TensorFlow (v. 1.9.0) was used for the computation (Abadi et al., 2016).
13
Fig. 2. Structure of an artificial neural network (ANN) including an input layer (I), hidden layers (H1–5), and an output layer (O). Each hidden layer had 512 perceptrons.
14
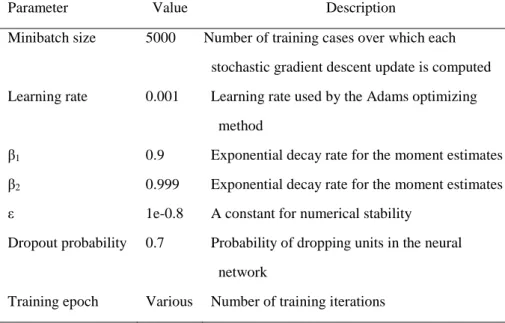
Table 2. Parameters used in the artificial neural network with the Adams optimizing method. Dropout was set at 1.0 in the test to use the entire neural network.
Parameter Value Description
Minibatch size 5000 Number of training cases over which each stochastic gradient descent update is computed Learning rate 0.001 Learning rate used by the Adams optimizing
method
β1 0.9 Exponential decay rate for the moment estimates
β2 0.999 Exponential decay rate for the moment estimates
ε 1e-0.8 A constant for numerical stability
Dropout probability 0.7 Probability of dropping units in the neural network
15
Comparison of transpiration rates between P-M and ANN
The transpiration rate was estimated and compared according to data collection period. The number of data points according to period is shown in Table 3. For estimating the transpiration rate by P-M, daily-averaged data were used. The same data used in P-M were divided into training, validation, and test data for estimating transpiration rate by the ANN. Furthermore, the ANN was used to estimate transpiration rate using 10-min and 24-h averaged data and to compare the estimation accuracy. The data on Apr 7, Jun 21, Sep 10, and Jan 9, which were not selected for training and validation, were used as test data to compare the actual transpiration rate and estimated rate by the ANN. For the test, Apr 7 and Jun 21 with similar light conditions were selected as high radiation conditions, while Sep 10 and Jan 9 with similar light conditions were selected as low radiation conditions. The 576 data points of the 4 days were used to compare the actual transpiration rates and the estimated rates by the ANN using environmental and growth factors.
16
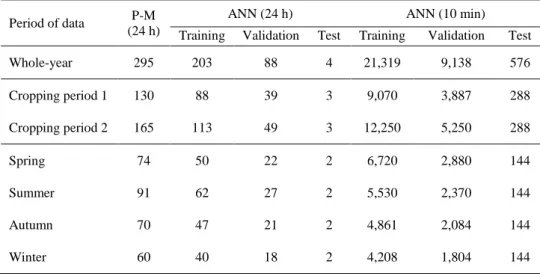
Table 3. Number of data points used for the Penman-Monteith equation (P-M) and the artificial neural network (ANN) when estimating the transpiration rate by different average time units and data-collecting periods. Refer to Fig. 3 for Cropping periods 1 and 2.
Period of data P-M (24 h)
ANN (24 h) ANN (10 min)
Training Validation Test Training Validation Test
Whole-year 295 203 88 4 21,319 9,138 576 Cropping period 1 130 88 39 3 9,070 3,887 288 Cropping period 2 165 113 49 3 12,250 5,250 288 Spring 74 50 22 2 6,720 2,880 144 Summer 91 62 27 2 5,530 2,370 144 Autumn 70 47 21 2 4,861 2,084 144 Winter 60 40 18 2 4,208 1,804 144
17
RESULTS & DISCUSSION
Analysis of plant growth in each cropping period
Cropping period 1 (low radiation conditions) from July 2017 to January 2018 and Cropping period 2 (high radiation conditions) from February 2018 to August 2018 both showed an increase in LAI at the beginning stage and then showed a saturated sigmoid pattern (Fig. 3). In particular, for Cropping period 2, which had relatively high solar radiation, the trend of LAI increase was higher than that in Cropping period 1. In general, solar radiation is known to affect the growth and yield of plants, and high radiation can increase growth indexes, such as leaf area (Demers et al., 1998, Dorais et al., 1991). LAI was modeled according to days after transplanting (DAT) with reference to the Boltzman sigmoid equation (Motulsky and Christopoulos, 2003). Cropping periods 1 and 2 had high coefficients of determination: 0.98 and 0.97, respectively. This is due to decreased light transmission in the canopy and subsequent decreased growth rate. In addition, the nutritional competition relationship between leaves and fruits according to growth stage led to a sigmoidal pattern in growth of leaves (Papadopoulos and Pararajasingham, 1997). Therefore, different environmental conditions during the growth period affected the LAI and growth pattern of the plant and, subsequently, transpiration rates.
18
Fig. 3. Estimation of leaf area index (LAI) of paprika grown in a glasshouse according to days after transplanting (DAT) during two cropping periods. The symbols and solid line represent the fitted and measured LAI, respectively.
19
Comparison of transpiration rate at different periods between P-M and
ANN
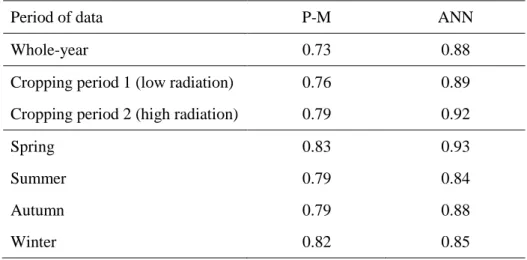
As a result of estimating transpiration rates using daily average temperature, solar radiation, relative humidity, and LAI, the accuracy of P-M was increased by using specific seasonal data rather than using whole-year data. However, overall accuracy was lower than for the ANN (Table 4). In particular, since P-M is based on an energy-balance equation (Baille et al., 1994), it is not easy to reflect the growth characteristics of different cropping periods in a single equation. In general, the transpiration rate of plants at high radiation was higher than that at low radiation (Medrano et al., 2005). Therefore, the accuracy of P-M reflecting characteristics of each cropping period tended to be higher than that of P-M using whole-year data.
Transpiration rates of crops are highly affected by environmental conditions; particularly in regions with four distinct seasons, seasonal transpiration rates are different, and transpiration rate increases at high solar radiation (Kim et al., 2011; Saez et al., 2012). However, at very high solar radiation, stomata close, which reduces the transpiration rate (Shin et al., 2014; del Amor et al., 2010; González-Dugo et al., 2007; Kuiper, 1961). The accuracy of the ANN was higher with R2 = 0.88 than that of P-M with R2 = 0.79. In particular, the accuracy was slightly higher when using whole-year and cropping period data than seasonal data because the number of data points used
20
for training was insufficient compared to those of cropping period and whole-year data. This is due to the nature of the ANN (Wang et al., 2016); as the data increase and as the structure of the ANN grows, more complex relationships can be elucidated. Therefore, the transpiration rate can be estimated more accurately when using the ANN in soilless cultures where various environmental factors are included.
21
Table 4. Comparison of the coefficients of determination (R2) between the Penman-Monteith equation (P-M) and the artificial neural network (ANN) when estimating the transpiration rate (g·d-1) by different data-collecting periods. Refer to Fig. 3 for Cropping periods 1 and 2.
Period of data P-M ANN
Whole-year 0.73 0.88
Cropping period 1 (low radiation) 0.76 0.89 Cropping period 2 (high radiation) 0.79 0.92
Spring 0.83 0.93
Summer 0.79 0.84
Autumn 0.79 0.88
22
Construction of the Optimal Structure of the ANN
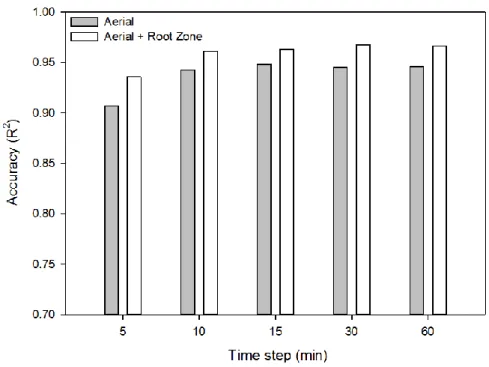
The ANN model considering both aerial and root-zone environmental factors was more accurate than that considering only aerial environmental factors (Fig. 4). Additionally, the accuracy of the ANN tended to increase until 10 minutes (time step of the input data); after that, there was no significant difference. Transpiration rate is known to be affected by not only aerial environmental factors, but also root-zone environmental factors. In particular, in a limited space, such as a substrate, salt accumulation and substrate temperature can affect the transpiration rate. As substrate EC increases, transpiration decreases (Shani et al., 2005). Likewise, because the stomatal response to other environmental factors affects the transpiration rate, increasing substrate temperature can increase water uptake to the saturation point (Cox and Boersma, 1967). However, in the absence of water stress, moisture content did not significantly affect the transpiration rate (Ta et al., 2012). Also similar results were observed in prediction accuracy (Moon et al., 2017).In addition, ANNs can estimate more complex relationships as the structure grows (Wang et al., 2016). Therefore, in this study, the ANN with both aerial and root-zone environmental factors more accurately estimated the transpiration rate of plants grown in soilless cultures. Additionally, as the average time of input data decreases, the number of data points that can be used for training increases, which is helpful to predict and control irrigation based on short time periods.
23
Fig. 4. Validation accuracies of the trained ANN using aerial and aerial with root-zone environmental factors at different time steps.
24
Validation of Transpiration Rates Estimated by the ANN Using Period
Data
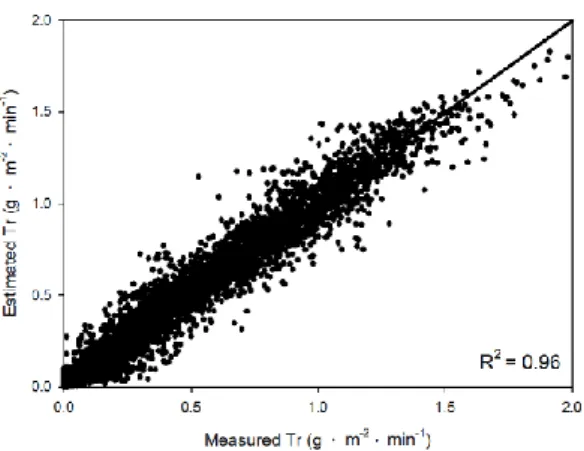
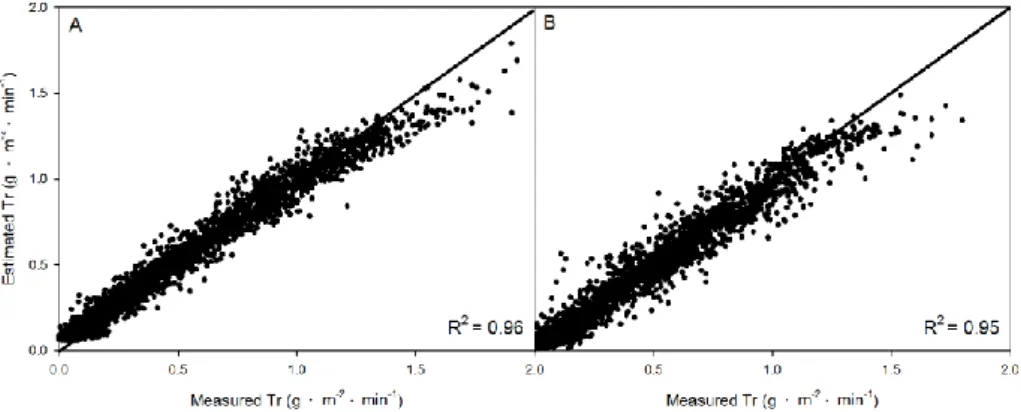
Estimation of the transpiration rate by the trained ANN showed overall high accuracy (Figs. 5, 6, and 7). The R2 value of the ANN trained with whole-year data was 0.96 (Fig. 5), those with Cropping periods 1 and 2 were 0.96 and 0.95 (Fig. 6), and those with seasonal data of spring, summer, autumn, and winter were 0.96, 0.96, 0.95, and 0.95 (Fig. 7), respectively. Generally, the ANN showed high coefficients of determination when using specific-period data. However, in Cropping period 1 with low radiation conditions, the measured estimated transpiration rates showed greater difference. Since transpiration rate tends to increase proportionally to light intensity (Saez et al., 2012; Kim et al., 2011), a lower transpiration rate occurs at lower radiation conditions than at higher radiation conditions (Ta et al., 2011). In low radiation conditions, the ANN was not sufficiently trained because the number of data points at the high transpiration rate plant parts was insufficient. Likewise, the results using seasonal data showed slightly lower accuracy in the high transpiration rate parts in autumn and winter at low radiation conditions. However, the results of this study indicate that estimation of transpiration rate using the ANN can be reliable when using whole-year data without dividing into cropping period or seasonal data.
25
Fig. 5. Comparison of transpiration rates (Tr) measured and estimated by the artificial neural network for the whole year (n=9138).
26
Fig. 6. Comparison of transpiration rates (Tr) measured and estimated by the artificial neural network for different cropping periods of high (A, n=5250) and low (B, n=3887) solar radiation.
27
Fig. 7. Comparison of transpiration rates (Tr) measured and estimated by the artificial neural network for spring (A, n=2880), summer (B, n=2370), autumn (C, n=2084), and winter (D, n=1804).
28
Test of Transpiration Rate Estimated by ANN Using Period Data
The trained ANN estimated the transpiration rate with overall high accuracy for a specific day in all four seasons (Figs. 8, 9, and 10). The transpiration rate increased under high radiation conditions and higher LAI. For trained ANNs with whole-year data, cropping period data, and seasonal data, RMSEs were 0.08 - 0.10 (Fig. 8), 0.07 - 0.09 (Fig. 9), and 0.07 - 0.09 (Fig. 10), respectively. In spring and summer with high radiation conditions, since the transpiration reaction was different in different cropping periods (Medrano et al., 2005; Shin et al., 2011), the accuracy of the ANN that performed training with cropping period data was the highest. In contrast, the accuracy was relatively decreased when using seasonal data because the number of data points available for training was small.In autumn, when training with whole-year data, a large error value was shown compared to other seasons. In general, shading films were used in August and September to prevent the internal temperature from rising due to high radiation in the greenhouse. Therefore, despite the high room temperature, the cumulative radiation inside the greenhouse was lowered. This may result in different transpiration responses to environmental factors in greenhouse crops (Kim et al., 2011). The ANN also differs from the model learned so far, which can lead to high RMSE values.
29
Therefore, it would be more accurate to use these factors in addition to those typically used. In particular, the error of the ANN tended to decrease when using specific data from whole-year data to seasonal data. However, since the error of the ANN according to period was not significantly different from that with whole-year data, the transpiration rate can be conveniently and accurately estimated by using whole-year data without dividing into cropping period data or seasonal data.
30
Fig. 8. Chronological comparisons of transpiration rates (Tr) between those measured and those estimated by the trained ANN using whole-year data for days in spring (A: Apr 07 and LAI=1.5), summer (B: Jun 21 and LAI=3.6), autumn (C: Sep 10 and LAI=1.5), and winter (D: Jan 09 and LAI=3.4). LAI is leaf area index.
31
Fig. 9. Chronological comparisons of transpiration rates (Tr) between those measured and those estimated by the trained ANN for the different cropping periods of high and low solar radiations for days in spring (A: Apr 07 and LAI=1.5), summer (B: Jun 21 and LAI=3.6), autumn (C: Sep 10 and LAI=1.5), and winter (D: Jan 09 and LAI=3.4). LAI is leaf area index.
32
Fig. 10. Chronological comparisons of transpiration rates (Tr) between those measured and those estimated by the trained ANN using seasonal data for days in spring (A: Apr 07 and LAI=1.5), summer (B: Jun 21 and LAI=3.6), autumn (C: Sep 10 and LAI=1.5), and winter (D: Jan 09 and LAI=3.4). LAI is leaf area index.
33
CONCLUSION
For estimating the transpiration rates of paprika grown in soilless cultures, an artificial neural network (ANN) consisting of an input layer using eight environmental and growth factors, five hidden layers, and an output layer was applied. The ANN obtained higher accuracy than the Penman–Monteith equation (P-M), and its accuracy was increased by adding root-zone environmental variables to the aerial ones. In particular, the ANN could accurately estimate the transpiration rate at a specific time in each season using data from the entire cultivation period regardless of season and cropping period. Considering the higher accuracy of the ANN, it is possible to use it to easily estimate transpiration rate and thereby efficiently develop irrigation strategies in soilless cultures.
34
LITERATURE CITED
Abadi M, Barham P, Chen J, Chen Z, Davis A, Dean J, Kudlur M (2016)
TensorFlow: A system for large-scale machine learning. In: Proceedings of 12th USENIX OSDI, 265-283. Savanah, GA, USA, 02–04 November 2016
Aubinet M, Deltour J, De Halleux D, Nijskens J (1989) Stomatal regulation
in greenhouse crops: analysis and simulation. Agric Forest Meteorol 48:21-44
Baille M, Baille A, Delmon D (1994) Microclimate and transpiration of
greenhouse rose crops. Agric Forest Meteorol 71:83-97
Ballantine JEM, Forde BJ (1970) The effect of light intensity and temperature
on plant growth and chloroplast ultrastructure in soybean. Am J Bot 57:1150-1159
Boulard T, Jemaa R (1992) Greenhouse tomato crop transpiration model
application to irrigation control. Acta Hortic 335:381-388
Cox LM, Boersma L (1967) Transpiration as a function of soil temperature
and soil water stress. Plant Physiol 42:550-556
De Boodt M, Verdonck O (1971) The physical properties of the substrates in
horticulture. In III Symposium on Peat in Horticulture 26:37-44
Del Amor FM, Cuadra-Crespo P, Walker DJ, Camara JM, Madrid R
(2010) Effect of foliar application of antitranspirant on photosynthesis and water relations of pepper plants under different levels of CO2 and water stress. Journal of Plant Physiology 167:1232–1238.
35
Demers DA, Gosselin A, Wien HC (1998) Effects of supplemental light
duration on greenhouse sweet pepper plants and fruit yields. Journal of the American Society for Horticultural Science 123:202-207
Dorais, M, Gosselin A, Trudel MJ (1991) Annual greenhouse tomato
production under a sequential intercropping system using supplemental light. Scientia horticulture 45:225-234
González-Dugo V, Orgaz F, Fereres E (2007) Responses of pepper to deficit
irrigation for paprika production. Scientia Horticulture 114:77–82
Guttormsen G (1974) Effects of root medium and watering on transpiration,
growth and development of glasshouse crops. Plant Soil 40:461–478
Hsiao TC, Xu LK (2000) Sensitivity of growth of roots versus leaves to water
stress: biophysical analysis and relation to water transport. J Exp Bot 51:1595-1616
Hamer PJ (1993) Validation of a model used for irrigation control of a
greenhouse crop. Acta Hortic 458:75-82
Jolliet O, Bailey BJ (1992) The effect of climate on tomato transpiration in
greenhouses: measurements and models comparison. Agric Forest Meteorol 58:43-62
Jolliet O (1994) Hortitrans, a model for predicting and optimizing humidity
and transpiration in greenhouses. J agric Eng 57:23-37
Kim YB, Bae JH, Park MH (2011) Effects of supplemental lighting on growth
and yield of sweet pepper (Capsicum annuum L.) in hydroponic culture under low levels of natural light in winter. Korean Journal of Horticultural Science and Technology 29:317–325
36
Kingma D, Ba J (2014) Adam: A method for stochastic optimization. arXiv
preprint arXiv:1412.6980v9
Kuiper PJC (1961) The effects of environmental factors on the transpiration
of leaves, with special reference to stomatal light response. veenman, wageningen
Moreno MM, Ribas F, Moreno A, Cabello MJ (2003) Physiological response
of a pepper (Capsicum annuum L.) crop to different trickle irrigation rates. Span J Agric Res 1:65-74
Monteith JL (1990) Principles of environmental physics. Edward Arnold
London 12:291
Motulsky H, Christopoulos A (2004) Fitting models to biological data using
linear and nonlinear regression: a practical guide to curve fitting. GraphPad Sofware Inc San Diego CA USA
Medrano E, Lorenzo P, Sánchez-Guerrero MC, Montero JI (2005)
Evaluation and modelling of greenhouse cucumber-crop transpiration under high and low radiation conditions. Sci Hortic 105:163-175
Nam DS, Lee JW, Moon TW, Son JE (2017) Transpiration prediction of
sweet peppers hydroponically-grown in soilless culture via artificial neural network using environmental factors in greenhouse. Protected Hort Plant Fac 4:411-417
Nederhoff EM, Rijsdijk AA, De Graaf R (1992) Leaf conductance and rate
of crop transpiration of greenhouse grown sweet pepper (Capsicum
annuum L.) as affected by carbon dioxide. Sci Hortic 52:283-301
Osakabe Y, Osakabe K, Shinozaki K, Tran LSP (2014) Response of plants
37
Papadopoulos AP, Pararajasingham S (1997) The influence of plant spacing
on light interception and use in greenhouse tomato (Lycopersicon
esculentum Mill.): A review. Scientia Horticulturae 69:1-29.
Petrie PR, Trought MT, Howell GS (2000) Influence of leaf ageing, leaf area
and crop load on photosynthesis, stomatal conductance and senescence of grapevine (Vitis vinifera L. cv. Pinot noir) leaves. VITIS 39:31-36
Saez PL, Bravo LA, Latsague MI, Sanchez ME, Rios DG (2012) Increased
light intensity during in vitro culture improves water loss control and photosynthetic performance of Castanea sativa grown in ventilated vessels. Scientia Horticulture 138:7–16
Sezen SM, Yazar A, Eker S (2006) Effect of drip irrigation regimes on yield
and quality of field grown bell pepper. Agric Water Manage 81:115-131
Shani U, Ben‐Gal A, Tripler E, Dudley LM (2007) Plant response to the soil environment: An analytical model integrating yield, water, soil type, and salinity. Water Resour Res 43:1-12
Shin JH, Noh EH, Son JE (2012) Transpiration, growth, and water use
efficiency of paprika plants (Capsicum annuum L.) as affected by irrigation frequency. Hortic Environ Biotechnol 53:129-134
Shin JH, Park JS, Son JE (2014) Estimating the actual transpiration rate with
compensated levels of accumulated radiation for the efficient irrigation of soilless cultures of paprika plants. Agric Water Manage 135:9-18
Shin JH, Ahn TI, Son JE (2011) Modeling of transpiration of paprika
(Capsicum annuum L.) plants based on radiation and leaf area index in soilless culture. Hortic Environ Biotechnol 52:265
38
Smittle DA, Dickens WL, Stansell JR (1994) Irrigation regimes affect yield
and water use by bell pepper. J Amer Soc Hortic Sci 119:936-939
Taormina R, Chau KW (2015) Neural network river forecasting with
multi-objective fully informed particle swarm optimization. J Hydroniform 17:99-113
Ta TH, Shin JH, Ahn TI, Son JE (2011) Modeling of transpiration of paprika
(Capsicum annuum L.) plants based on radiation and leaf area index in soilless culture. Hortic Environ Biote 52:265-269
Ta TH, Shin JH, Noh EH, Son JE (2012) Transpiration, growth, and water
use efficiency of paprika plants (Capsicum annuum L.) as affected by irrigation frequency. Hortic Environ Biotechnol 53:129-134.
Moon T, Ahn TI, Son JE (2018) Forecasting root-zone electrical conductivity
of nutrient solutions in closed-loop soilless cultures via a recurrent neural network using environmental and cultivation information. Front Plant Sci 9.
Vaidyanathan S (2015) 3-cells cellular neural network (CNN) attractor and its
adaptive biological control. Int J Pharmtech Res 8:632-640
Wang T, Gao H, Qiu J (2016) A combined adaptive neural network and
nonlinear model predictive control for multirate networked industrial process control. IEEE Trans Neural Netw Learn Syst 27:416-425