ISSN: 2508-7894 © 2021 KODISA & KAIA. KJAI website: http://www.kjai.or.kr
doi: http://dx.doi.org/10.24225/kjai.2021.9.1.9
A Study on a car Insurance purchase Prediction Using Two-Class Logistic
Regression and Two-Class Boosted Decision Tree
Su Hyun AN1, Seong Hee YEO2, Minsoo KANG3
Received: Feburary 25, 2021. Revised: March 01, 2021. Accepted: June 21, 2021.
Abstract
This paper predicted a model that indicates whether to buy a car based on primary health insurance customer data. Currently, automobiles are being used to land transportation and living, and the scope of use and equipment is expanding. This rapid increase in automobiles has caused automobile insurance to emerge as an essential business target for insurance companies. Therefore, if the car insurance sales are predicted and sold using the information of existing health insurance customers, it can generate continuous profits in the insurance company's operating performance. Therefore, this paper aims to analyze existing customer characteristics and implement a predictive model to activate advertisements for customers interested in such auto insurance. The goal of this study is to maximize the profits of insurance companies by devising communication strategies that can optimize business models and profits for customers. This study was conducted through the Microsoft Azure program, and an automobile insurance purchase prediction model was implemented using Health Insurance Cross-sell Prediction data. The program algorithm uses Two-Class Logistic Regression and Two-Class Boosted Decision Tree at the same time to compare two models and predict and compare the results. According to the results of this study, when the Threshold is 0.3, the AUC is 0.837, and the accuracy is 0.833, which has high accuracy. Therefore, the result was that customers with health insurance could induce a positive reaction to auto insurance purchases.
Keywords : Machine Learning, Two-Class Logistic Regression, Two-Class Boosted Decision Tree, Car Insurance, Purchase, Prediction
Major Classification Code : Basic Technology , Technical Application , Artificial Intelligence Convergence
1. Introduction
123Today, automobiles have become a key tool for land transportation, and their use range is expanding as a means of living. Cars are a running weapon and have a problem in that accident caused by banks also increase, leading to a
1 First Author, Student, Department of Medical IT, Eulji University, Korea, Email: [email protected]
2 Co-Author, Professor, Biomedical Laboratory Science, Eulji University, Korea. Email: [email protected]
3 Corresponding Author, Professor, Department of Medical IT, Eulji University, Korea. Email: [email protected]
significant increase in life and property damage. Due to the rapid growth in vehicles, automobile insurance has emerged as a critical business target for insurance companies (Choi, 2018). It is crucial to expand new contracts by creating new customers to improve business performance. However, as relationship marketing becomes more critical, the
ⓒ Copyright: The Author(s)
This is an Open Access article distributed under the terms of the Creative Commons Attribution Non-Commercial License (http://Creativecommons.org/licenses/by-nc/4.0/) which permits unrestricted noncommercial use, distribution, and reproduction in any medium, provided the original work is properly cited.
repurchase of insurance and maintenance of insurance contracts by existing customers is an important success factor for the insurance industry. In the long term, minimizing the conversion of existing customers to other insurance companies is a positive factor that increases corporate profits. Thus, it became a major problem for insurers to increase business efficiency by maintaining existing contractors by controlling the factors of car purchase conversion (Kong et al., 2019). However, consumers are concerned that the quality of service of the insurance company they are currently subscribing to is lower than the quality inherently reserved by consumers, and the expected utility from searching for a new insurance company is If it is less than the expected utility, it is highly likely to switch to a sub-optimal insurance company; otherwise, it is highly likely to search for or switch to a new insurance company. In particular, the more information about premiums presented by insurance companies, the more likely a subscriber will switch to another insurance company. The tips were found to be critical in decision-making (Jeon, 2014). Therefore, this study was conducted by analyzing customer characteristics and implementing a prediction model to activate advertisements for customers interested in such auto insurance in this paper. The research results can also be used to increase purchase desire by effectively exposing automobile insurance to existing insurance customers. Through this study, it is possible to build a model that predicts whether an insurance company's existing health insurance customers will be interested in auto insurance. In addition, it is possible to maximize the profits of the insurance company by devising a communication strategy that can optimize the business model and profit for the customer.
Health Insurance Cross-sell Prediction data was used to conduct the above research, and Kaggle, an open-source site, provided the data. The data used are data related to past car history or current car insurance in addition to personal information of existing health insurance customers. These data predicted the customer's purchase of insurance according to various factors using the Two-Class Logistic Regression and Two-Class Boosted Decision Tree algorithm in Microsoft Azure.
2. Literature Review
2.1. Machine Learning Program
Azure is Microsoft's cloud computing platform that has been in service since 2010. In 2011, Platform as a Service (PaaS) was followed by Infrastructure as a Service (IaaS) service in 2013. The Azure platform provides over 600 services. You can collect and manage data in the cloud using the Azure platform, create models through Azure Machine
Learning Studio, and easily build web services and apply them to various devices. At Microsoft Ignite, It announced Azure Machine Learning designer's general availability, the drag-and-drop workflow capability in Azure Machine Learning studio, which simplifies and accelerates building, testing, and deploying machine learning models for the entire data science team, from beginners to professionals (Nam et al, 2019). In addition, unlike existing cloud platforms and machine learning libraries and tools, it provides an easy-to-access GUI environment in consideration of user convenience (Kang et al., 2018).
2.2. Supervised Learning
Supervised learning is the machine learning task of learning a function that maps an input to an output based on example input-output pairs. It infers a function from labeled training data consisting of a set of training examples. In supervised learning, each example is a pair consisting of an input object (typically a vector) and a desired output value (also called the supervisory signal). A supervised learning algorithm analyzes the training data and produces an inferred function, which can be used for mapping new examples. An optimal scenario will allow for the algorithm to correctly determine the class labels for unseen instances (Kwak, 2020). Supervised Learning is a learning model that takes a set of labeled training data and creates a discriminant that analyses the data using various algorithms and then uses the algorithms discovered on a new data set to produce results. Supervised learning is divided into regression and classification. Since both classification and regression are supervised models, they have in common the fact that they learn from labeled input data. The difference between classification and regression is that classification results in a fixed value, whereas regression means that the resulting value can be any value within the range of the data set.
2.3. Machine Learning
Machine Learning is the scientific study of algorithms and statistical models that computer systems use to perform a specific task without using explicit instructions, relying instead on patterns and inference. It is seen as a subset of artificial intelligence. It also focuses on representation and generalization. Representation is the evaluation of data, and generalization is the processing of data that is not yet known. The term Machine Learning was first used by Arthur Samuel, an IBM researcher in the field of artificial intelligence, in his paper "Studies in Machine Learning Using the Game of Checkers."
Machine learning is a part of artificial
intelligence,
focusing
on
representation
and
generalization as a field for developing algorithms and
technologies that enable computers to learn. In
addition, data can be analyzed using algorithms,
learning through analysis, and make decisions or
predictions based on learning. Machine learning is
largely classified into supervised and unsupervised
learning,
and
supervised
learning
includes
classification algorithms, regression algorithms, and
deep learning (Kim et al., 2018).
According to Yu-Jin Nam, The methodology
consists of three main steps: data set selection. The
second step includes preprocessing, in which the
original data is prepared for classification. The last step
contains training models according to the accuracy of
each algorithm (Nam at el., 2019).
In machine learning, Support-Vector Machine (SVM) is supervised learning models with associated learning algorithms that analyze data used for classification and regression analysis. Given a set of training examples, each marked as belonging to one or the other of two categories, and an SVM training algorithm builds a model that assigns new examples to one category or the other, making it a non-probabilistic binary linear classifier. An SVM model is a representation of the separate categories that are divided by a clear fap that is as wide as possible. New examples are then mapped into that same space and predicted to belong to a category based on the side of the gap on which they fall. The reason for using a two-class support vector machine is that technically it can be used in both classification and forecasting problems. For its experimental usage, the performance of two-class logistic regression and two-class neural networks were lower than the two-class support vector machine (You et al., 2020).2.4. Machine Learning Algorithms
2.4.1. Two-Class Logistic Regression
Logistic regression is a kind of simple machine learning that performs regression estimation on proportional, proportional, or categorical data. Compared to more advanced classification and regression techniques, it is based on a very simple theory, but probabilistic analysis is possible for categorical data. In other words, it is possible to predict the occurrence of a specific event by using an independent variable that has a direct influence on the dependent variable (Kim et al., 2020). Logistic regression analysis can explain the types of associations and interactions caused by the model structure and can evaluate the influence of explanatory variables on response values through parameter inference. In addition, since it is possible to perform discrimination and classification based on predicted probability, various industries such as medicine, telecommunications, and finance are performing tasks to
predict the probability of an event occurring using logistic regression analysis (Park et al., 2016).
2.4.2.Two-Class Boosted Decision Tree
It is a data mining technique that charts rules into a tree structure and classifies the group of interest into several small groups or performs prediction. In other words, it analyzes the collected data and classifies new data into patterns that exist between them. The decision tree creates a tree in Top-Down format, and an appropriate amount of training set must be prepared in advance. The decision tree algorithm classifies a given training set to generate a decision tree and classifies and predicts a given test set. The decision tree has the following characteristics. First, data can be easily classified according to the degree of relevance, and it is easy to assign an action to it. Second, it is expressed in a tree structure that is easy for humans to read, and because it informs the basis of classification or prediction, the results can be easily understood. Third, even if the number of attributes constituting data is unnecessarily large, data classification is easy because it does not affect classification when constructing a tree. Fourth, since data is used without a separate processing process (Min et al., 2014).
3. Data Set
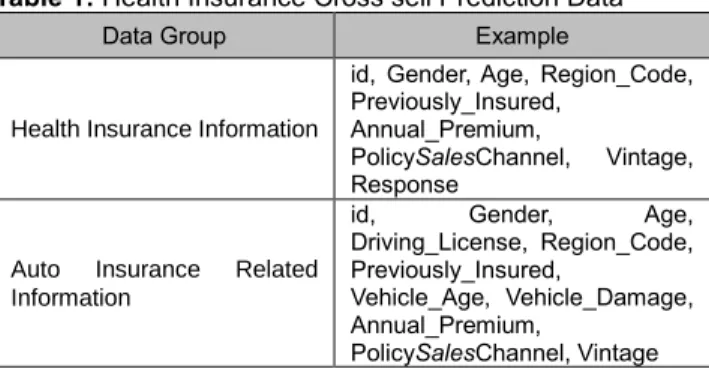
The health insurance customer data used in this study was provided by Kaggle, an open source site, and was specifically organized in 381110 rows and 12 columns. Table 1: Health Insurance Cross sell Prediction Data
Data Group Example
Health Insurance Information
id, Gender, Age, Region_Code, Previously_Insured,
Annual_Premium,
PolicySalesChannel, Vintage, Response
Auto Insurance Related Information
id, Gender, Age,
Driving_License, Region_Code, Previously_Insured,
Vehicle_Age, Vehicle_Damage, Annual_Premium,
PolicySalesChannel, Vintage
Health Insurance Cross sell Prediction.csv data was predicted by dividing the columns into health insurance-related information group and auto insurance-insurance-related information group as shown in Table 1 above.
Table 2: Health Insurance Cross sell Prediction Data Description
ID Unique ID for the customer Response 1: Customer is interested, 0: Customer is not interested
Table 2 above is a detailed description of the labels ‘id’ and ‘Response’ set to obtain the result value. It can be seen that the label' id’ means a number that is unique to each customer. When the label ‘Response’ is 1, it means that the customer is interested in purchasing auto insurance, and when it is 0, it means that there is no interest in purchasing insurance.
4. Experimental model
The process of building an automobile insurance purchase prediction model using the Two-Class Logistic Regression and Two-Class Boosted Decision Tree algorithm through the Microsoft Azure Machine Learning Studio program is as follows.
First, for Health Insurance Cross-sell Prediction.csv data, data preprocessing was performed to delete empty data using Clean Missing Data. The minimum missing value ratio for Clean Missing Data is set to 0. The maximum missing value ratio is set to 1 so that the missing value can be cleaned up even if there is only one missing value. It was set to be able to. Among the Health Insurance Cross-sell Prediction.csv data columns, id, Gender, Age, Region_Code, Vehicle_Age, Vehicle_Damage, Policy_Sales_Channel, Annual_Premium, Vintage, Previously_Insured, Response were selected. Driving_License, a column judged to be unnecessary for predicting the auto insurance purchase prediction model, was excluded. The preprocessed Health Insurance Cross-sell Prediction Data was separated into learning and training data and test data through Split Data. The data separation ratio was set to 70% (0.7) for training data and training data and 30% (0.3) for tester data. The random seed was assigned to 12345, and the Stratified split was set to False. In Select, a single column, Two-Class Logistic Regression, and Two-Class Boosted Decision Tree were executed with Response as a label in the Train Model for Two-Class Logistic Regression Two-Class Boosted Decision Tree. In the Two-Class Logistic Regression algorithm, Create trainer model was used as a Single Parameter. Also, both the L1 regularization weight and the L2 regularization weight were set to 1. The Two-Class Logistic Regression algorithm has the advantage of being able to produce a quick and simple model, but it has the disadvantage of its simplicity. Therefore, the results were derived by fusion of the two models by simultaneously using the Two-Class Boosted Decision Tree to present accurate and diverse models. Therefore, in the Two-Class Boosted Decision Tree, a Single Parameter was used for Create
trainer mode, and the maximum number of leaves per tree was entered as 20. If this value is increased, there is a disadvantage of overfitting and increasing training time. Still, since it has the advantage of increasing the tree's size and increasing the accuracy, it was determined and entered as 20, which is a value judged as an appropriate value. If the learning rate is set abnormally large, a problem may occur in producing the optimal model, so the proper ratio was set to 20% (0.2). In the number of trees, if too many decision trees are generated, there is an advantage in that a better range of results can be obtained.
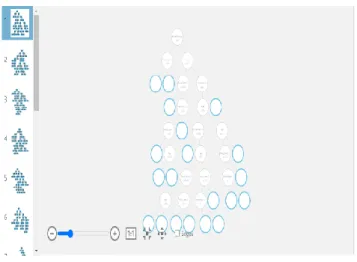
Figure 1: Train Model
Figure 1 above is a visualization of the learning model for the Two-Class Boosted Decision Tree. Through the picture above, you can visualize the Two-Class Boosted Decision Tree algorithm to get an overview of what learning is going on about the learning data. In addition, it is possible to intuitively grasp multiple figures on the prediction accuracy of the test data at a glance. When creating the learning model, it was executed with ‘Response’ as the label. The score model function predicts the 'Response' of the module evaluation data set. In the Train model, 'Response' is selected as the label and the Score Label of the car insurance purchase prediction for 'Response' is a prediction example.
5. Experiment Results
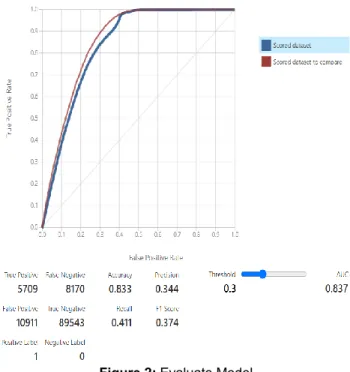
The accuracy, that is, the accuracy that checks how much the predicted value is equal to the correct answer, was measured as 0.833. The precision of determining how much of the predicted values were actually predicted was 0.344, and the recall rate of measuring the proportion of the true value matched by the model among the total true values was measured as 0.411 result value. If the area under the ROC curve graph of the Evaluate model is wide, the reliability of
the model is judged to be high. However, when the threshold is 30% (0.3), the AUC of the car prediction purchase model is measured as 0.837, and when the threshold is 30% (0.3), it is known that the graph is recorded closest to (0, 1), that is, 1 I can. This shows that the accuracy of the model is improved when the threshold is 30% (0.3). Therefore, it can be judged that the reliability of the currently implemented car purchase prediction model is high because the result value that is judged to be highly accurate in the Two-Class Logistic Regression and Two-Class Boosted Decision Tree for both the AUC and ROC curve graphs
Figure 2: Evaluate Model
Figure 2 shows the evaluation model and related figures for Health Insurance Cross sell Prediction data using the Class Logistic Regression algorithm and the Two-Class Boosted Decision Tree algorithm. The graph above is an ROC (Receiver Operating Characteristic) graph that combines the results of Two-Class Logistic Regression and Two-Class Boosted Decision Tree. When the threshold of the two algorithms was 30% (0.3), the Evaluate Model showed true positive, true negative, false positive, and false negative statistics. When the data was positive, the true positive was measured as 5709, and the data was predicted as negative, but the false positive was measured as 10911. Although the data was predicted as a negative, the false positive was measured as 8170, and the data was predicted as a negative, and the true negative was measured as 89543.
5. Conclusion
In this paper, using the Two-Class Logistic Regression and Two-Class Boosted Decision Tree, we predicted the possibility of purchasing auto insurance by health insurance buyers of insurance companies. While proceeding with the thesis, we encountered problems and difficulties in analyzing one data using two algorithms. In particular, it had the most difficulty determining and selecting an algorithm that can be used together while improving accuracy. It was difficult to choose one specific algorithm and analyze the model, and it was difficult to determine the options in the process of selecting and setting certain columns and conducting the experiment. In addition, a fairly complex problem occurred in the process of model analysis using one or more algorithms, which caused difficulties in predicting the model. In order to produce a more accurate and fast car insurance purchase prediction algorithm model, it is expected that a better model can be produced if the prediction is made using data that is more effective and has various columns than the current one. In addition, the Two-Class Logistic Regression algorithm has the advantage of being able to produce a fast and simple prediction model, but it has the disadvantage of producing a simple model. Therefore, two algorithm models were compared and compared using the Two-Class Boosted Decision Tree at the same time to predict the results. As a result, it was possible to derive a predictive model with higher accuracy results. It is expected that the creation of an automobile insurance purchase prediction model based on the personal purchase information of the purchaser of such health insurance can be utilized in the future when an insurance company provides customized advertisements. Suppose an insurance company collects various personal information of customers who normally use insurance in addition to auto insurance or health insurance. In that case, it can predict and analyze insurance in related fields by predicting its customers' interests based on the data. In this case, even if the number of customers in the insurance company does not increase significantly, it can be expected to have a positive effect of ensuring much higher profitability based on its customers. Also, the fact that more insurance can be predicted with one data is also expected to have the advantage of increasing data utilization. In this way, in the future, we are currently building a machine learning model that can predict, recommend, and suggest insurance products in areas where customers feel their usual necessity in addition to automobile insurance by collecting and utilizing various information in addition to the purchaser's personal insurance purchase information. You can use the thesis results. Therefore, this paper can be used to construct and produce an artificial intelligence model that predicts and recommends insurance products that suit each customer's
needs by grasping the needs of customers in various and detailed ways. Also, it is not limited to insurance products, but the ultimate future-oriented goal pursued by the current thesis is to make it convenient for companies to use for advertising activities and direct publicity if they are applied to many products or daily life.
References
Choi, B. G. (2018). A study on the meaning of automobile in the no insurance automobile injury insurance. Journal of Insurance Law Research, 12(1), 211-234.
Kong, D. A., & Bang, J. H. (2019). A Study on the Repurchase of Automobile Insurance at Expiration. Journal of Industrial Economics and Business, 32(5), 2393-2415.
Jeon, Y. S. (2014). Analysis on Possibility of Auto Insurance Customer's Company Switching. Korea Insurance Research Institute, 25(3), 3-36.
Kang, M. S., Kang, H. J., Yoo, K. B., Ihm, C. H., & Choi, E. S. (2018). Getting started with Machine Learning using Azure Machine Learning studio. Seoul, Korea: Hanti media. Kwak, Y. S. (2020). A Study on Methods to Prevent the Spread of
COVID-19 Based on Machine Learning. Journal of Korean of Artificial Intelligence, 8(1), 1-6.
Kim, K. P., & Song, S. W. (2018). A Study on Prediction of Business Status Based on Machine Learning. Journal of Korean of Artificial Intelligence, 6(2), 23-27.
You, S. H., & Kang, M. S. (2020). A Study on Methods to Prevent Pima Indians Diabetes using SVM. Journal of Korean of Artificial Intelligence, 8(2), 7-10.
Yoo, S. W., Shin, Y. B., & Shin, D. G. (2020). Comparison of the Machine Learning Models Predicting Lithium-ion Battery Capacity for Remaining Useful Life Estimation. Journal of The Korean Institute of Gas, 24(6), 91-97.
Kim, H. I., Han, K. Y., & Lee, J. Y. (2020). Prediction of Urban Flood Extent by LSTM Model and Logistic Regression. Journal of The Korean Society of Civil Engineers, 40(3), 273-283.
Park, B. J., & Hur, J. (2016). Study on the Analysis of Wind Power Outputs using Multivariate Logistic Regression. Journal of The Korean Institute of Electrical Engineers, 13, 104-105. Min, S. H., Oh, Y. J., & Park, S. (2014). User-friendly Robot
Vacuum Cleaner System based on Decision Tree. Journal of The Korean Institute of Information Scientists and Engineers, 14, 1836-1838.
Nam, Y. J., & Shin, W. J. (2019). A Study on Comparison of Lung Cancer Prediction Using Ensemble Machine Learning. Korean Journal of Artificial Intelligence, 7(2), 19-24.